
Published: February 17th, 2020
There could be an impulsive upside move about to begin on GBP/NZD currency pair. And today we will try to understand why we expect a bullish scenario and when it might start, by looking at Daily, 4-Hour and 1-Hour charts.
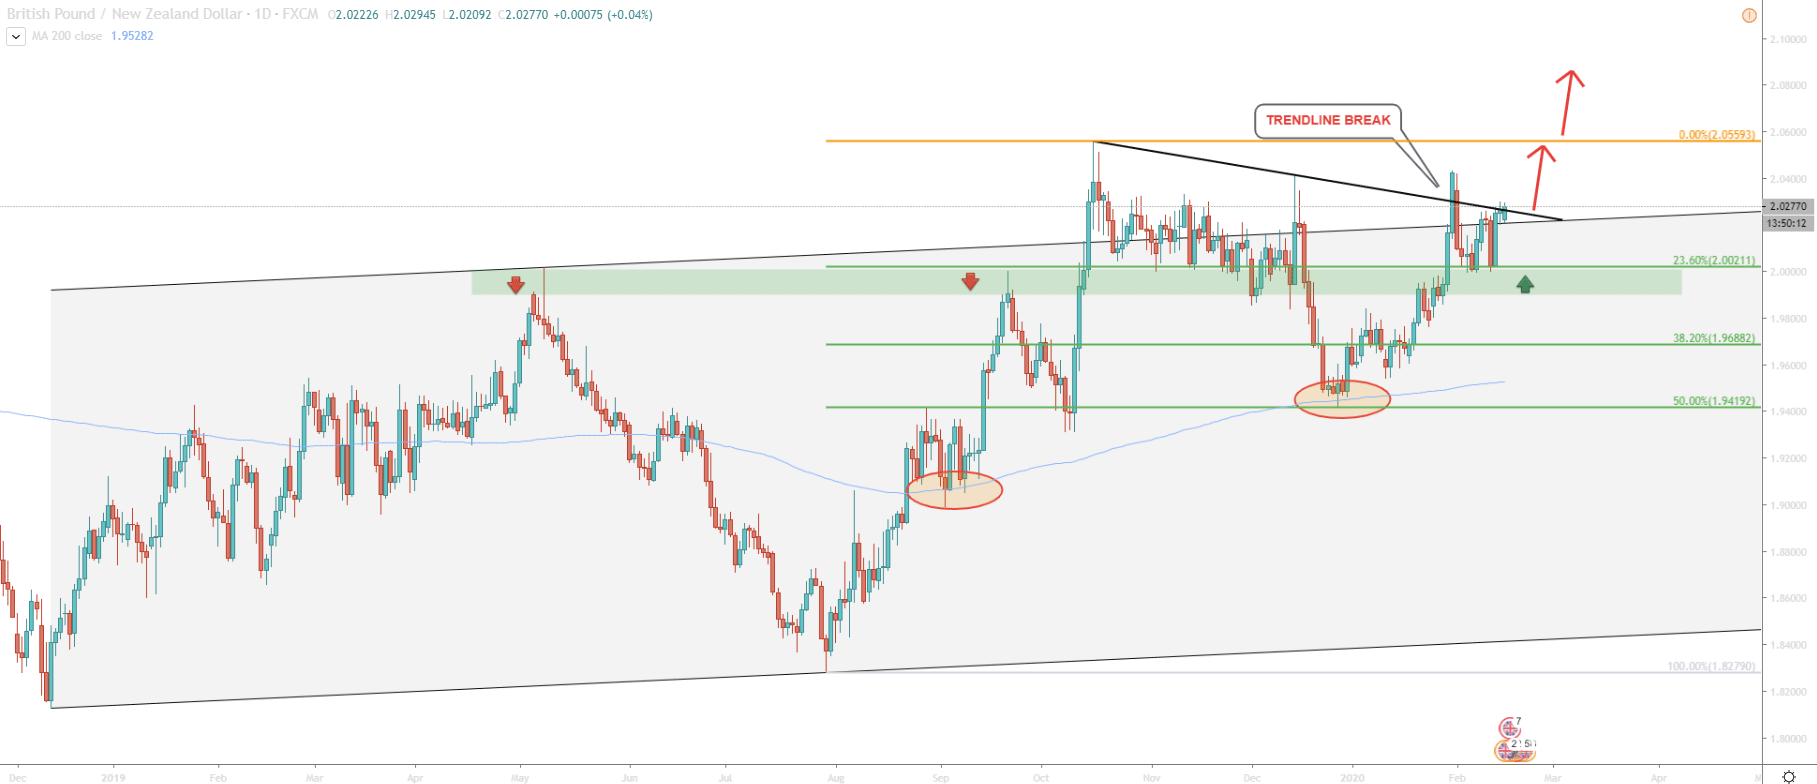
In December 2018 GBP/NZD exchange rate has reached 1.8279 low. Since then the pair started to move higher and the uptrend has begun. Up until October 2019 price remained within the ascending channel. But, on October 15, it broke above the channel, showing great buying interest. While trending upwards, GBP/NZD has rejected 200 Moving Average on two occasions, on September 3 and on December 27. This could be interpreted as a confirmation of the ongoing uptrend.
On January 31, 2019, price broke above the downtrend trendline, which is yet another confirmation of the strong upside momentum. Take a look at the support area around 2.0000 which is marked in green color. Before it was a clear resistance, where price failed to move higher for two times in a row. But what happens now? GBP/NZD broke above this area and found the support on the previously formed resistance.
Moreover, after breaking the resistance, 50% Fibonacci retracement at 1.9419 has been rejected cleanly. Finally, on a Daily chart, currently, everything is in favor of the uptrend continuation.
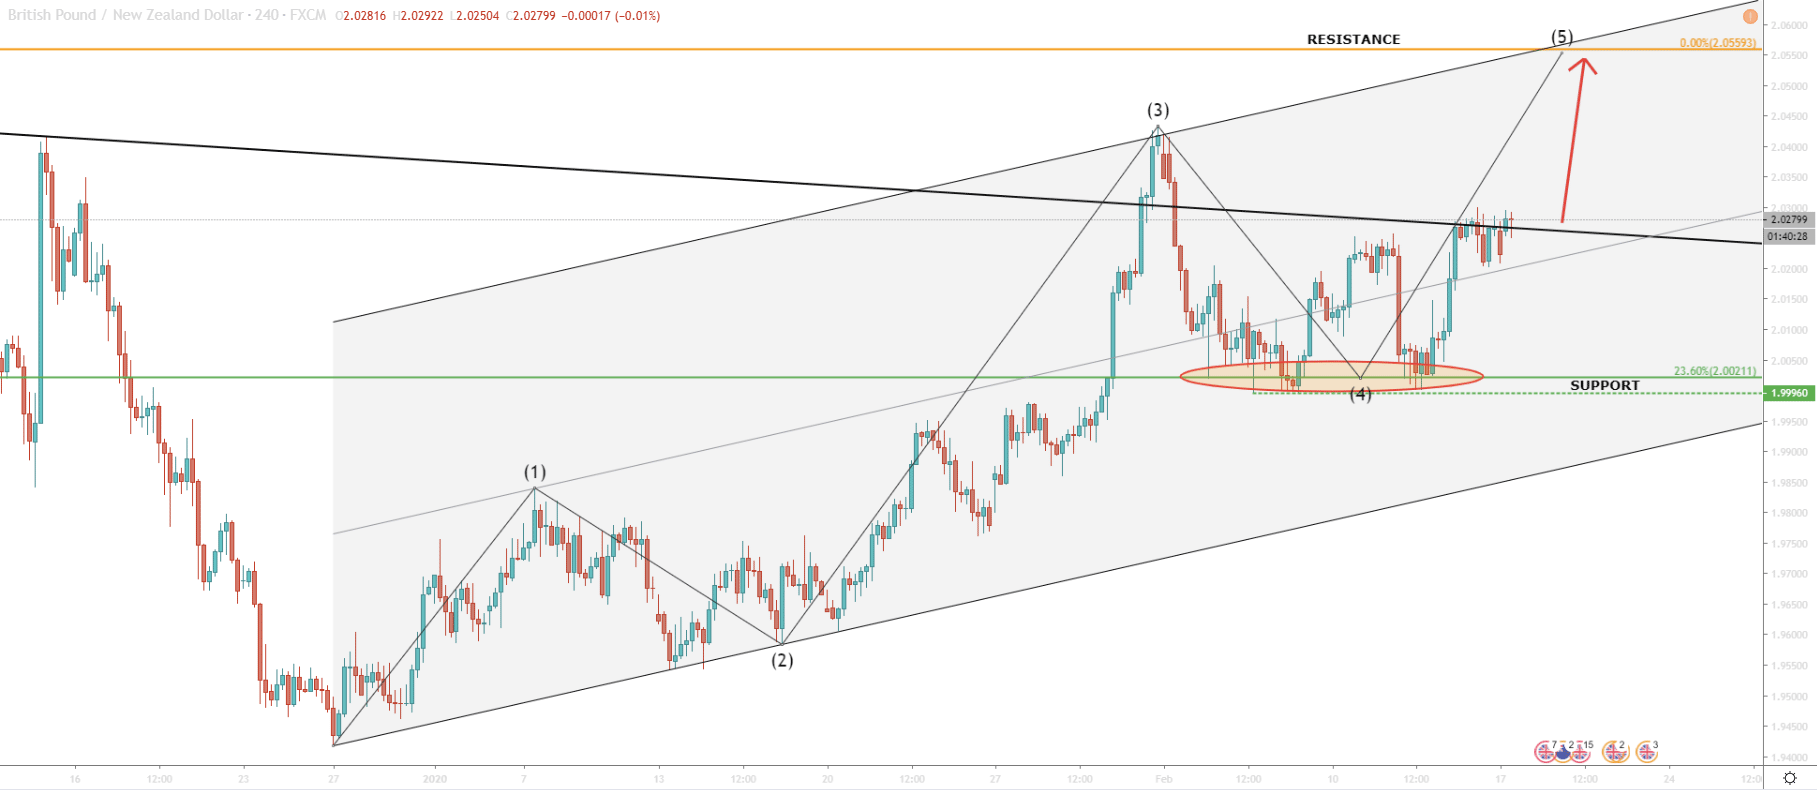
The 4H chart also indicates valid uptrend. Pair has been trading within the ascending channel, although on the 3rd wave up price broke above the channel. GBP/NZD reached the upper trendline of the extended ascending channel and corrected down to 1.9996. Not only this a strong psychological price area (2.0000), but also a Fibonacci retracement level. The Fibonacci support was rejected and now, yet again, GBP/NZD printing higher highs and higher lows. It could be that price is about to finish the 5th wave upwards and can potentially reach 2.0560 resistance. This resistance level corresponds to the previous price bounce, which occurred back on October 16, as can be seen on a Daily chart.
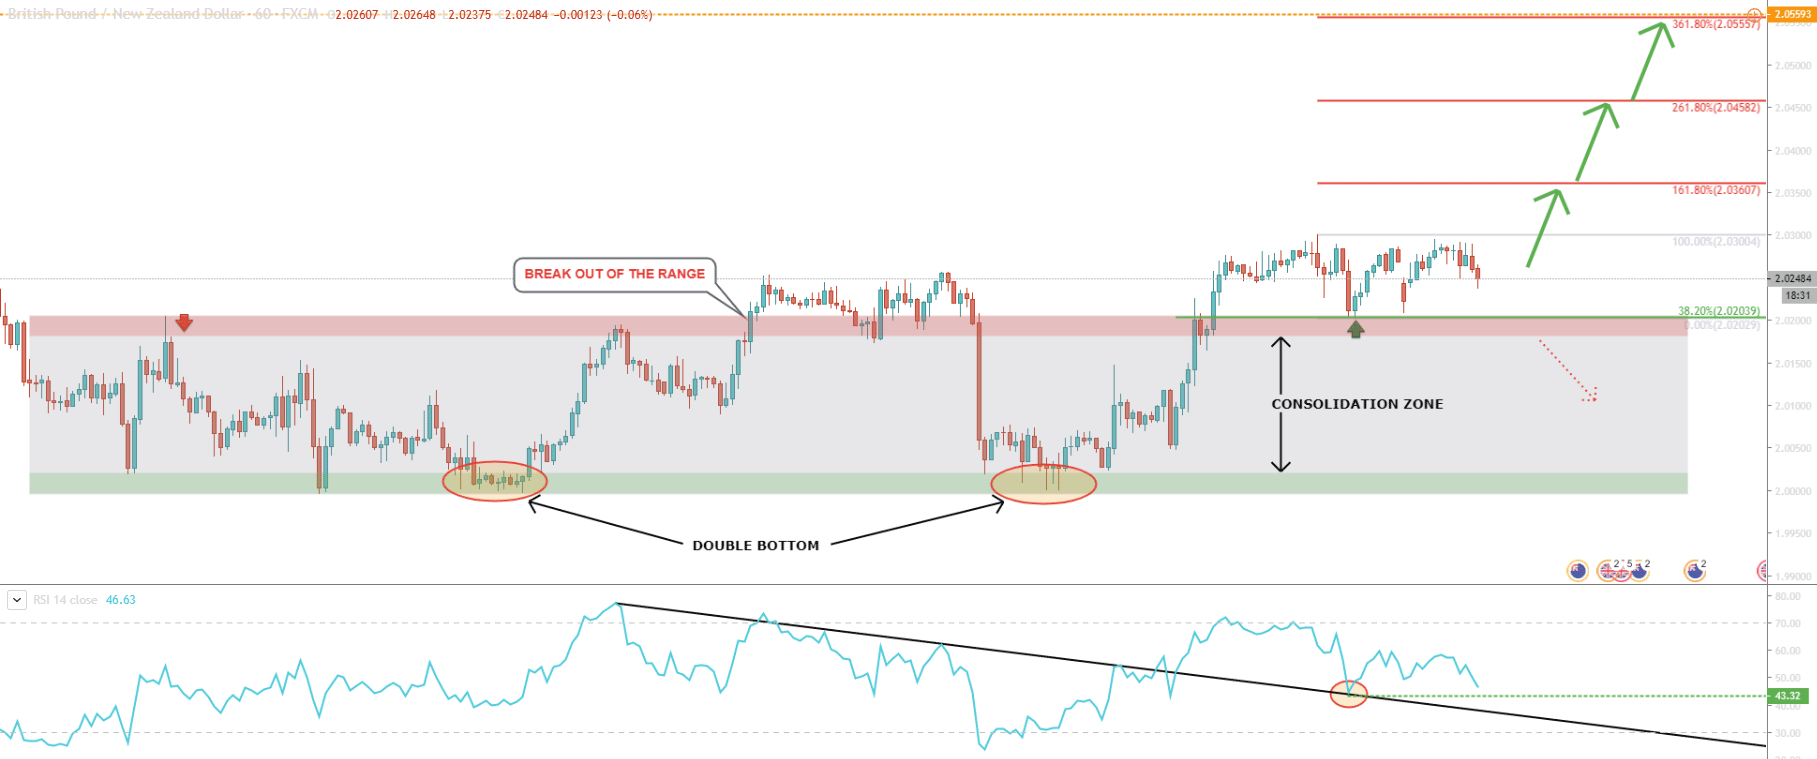
On the 1H chart, the consolidation phase has been going on through the 4 - 10 of February. On the 10th price broke above the 2.0200 resistance, although after that, sharply corrected down. Nonetheless, on correction, the support at 2.0000 was rejected. The next wave up resulted in a break out of the range yet again, showing the lack of selling power.
The most recent downside correction failed to go beyond the 2.0200 support and at the same time resulted in the rejection of the 38.2% Fibonacci support.
Analysis of multiple timeframes suggests strong bullish sentiment. Any corrective move down could potentially be a good opportunity for buyers.
Based on the previously established high along with Fibonacci retracement levels applied to the most recent correction, we have established 3 upside targets:
The final target for the current wave would be the key resistance level. Daily break and close above might push the price even higher.
Strong support is located at 2.0203. 1H break and close below this price can be the first signal to get cautious as it would most likely invalidate the bullish scenario. As a result, the price can start consolidating and eventually move back to the range zone.
Support: 2.0204, 2.0020, 1.9688, 1.9419
Resistance: 2.0300, 2.0360, 2.0458, 2.0555