
Published: February 21th, 2020
GBP/JPY could be offering a high probability trade setup while trading at the top of the long-term price rage. The consolidation area is 350 pips which is very wide and could hold not one, but multiple trading opportunities.
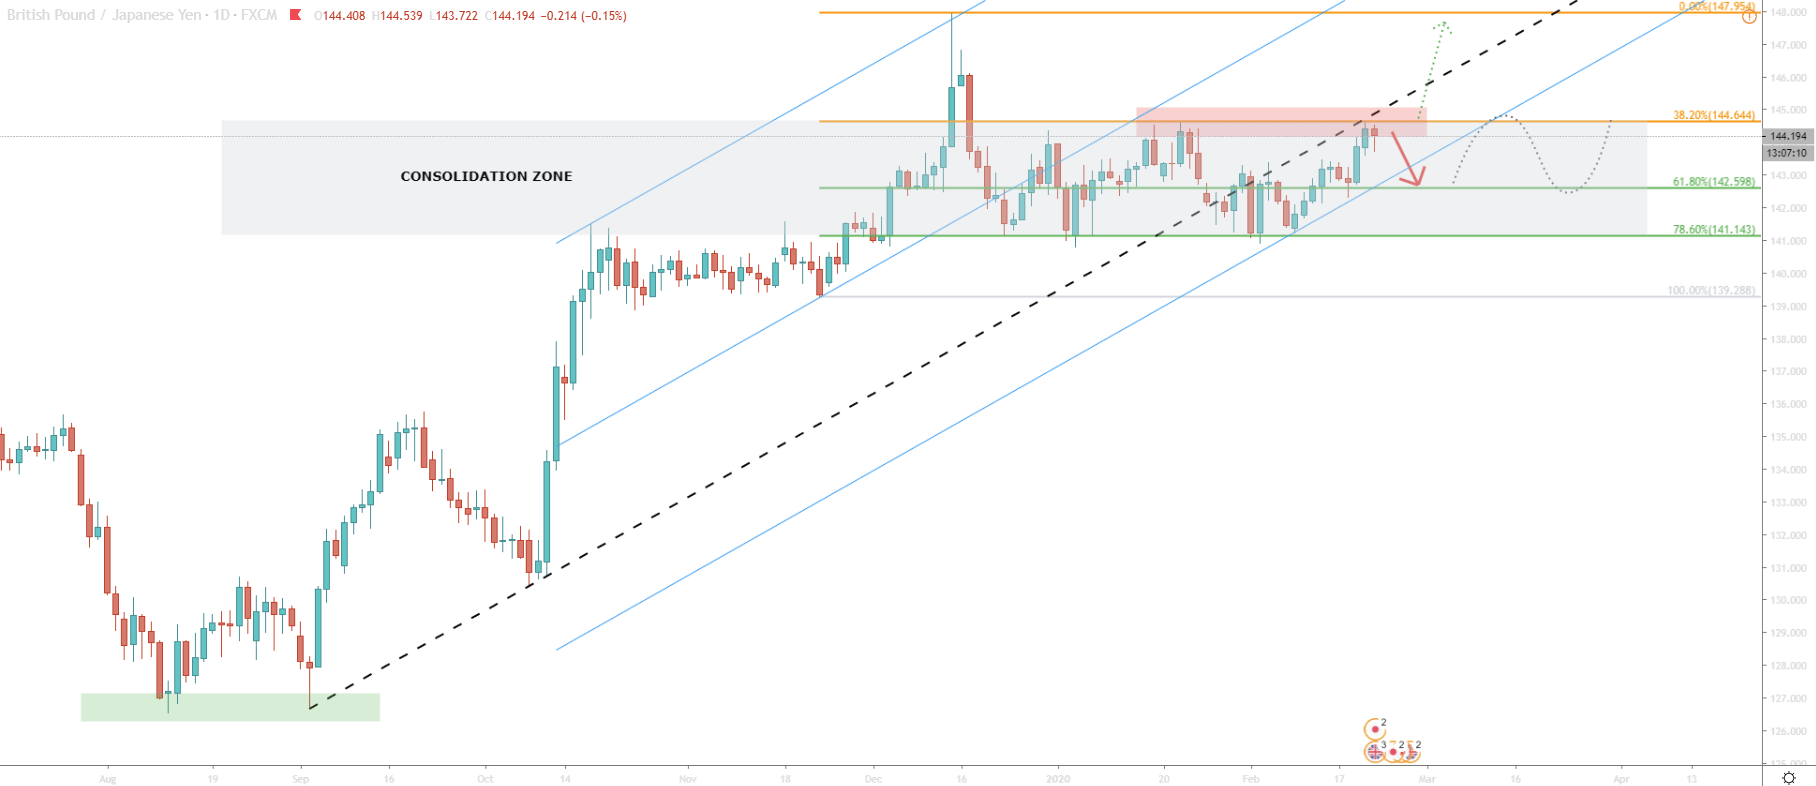
Once we look at the Daily chart, it becomes very obvious that the consolidation zone formed between 144.64 resistance and 141.14 support. These prices also correspond to the Fibonacci retracement levels applied to the last wave up, prior to hitting 148.00 long term resistance on December 13. It is worth mentioning that this was a 6-month high for GBP/JPY.
After reaching that high, correction followed and pair reached the 78.6% Fibonacci support. This was the point when the range trading has begun. The consolidation is going on for 2 months now and there are no signs of a long term trend being started. While there are no confirmations of either uptrend or a downtrend it could be worth trying to capitalize on the sideways move.
During the past few days price reached the long term uptrend trendline, where it found the resistance, along with the 38.2% Fibonacci retracement. This might be the beginning of yet another corrective wave down.
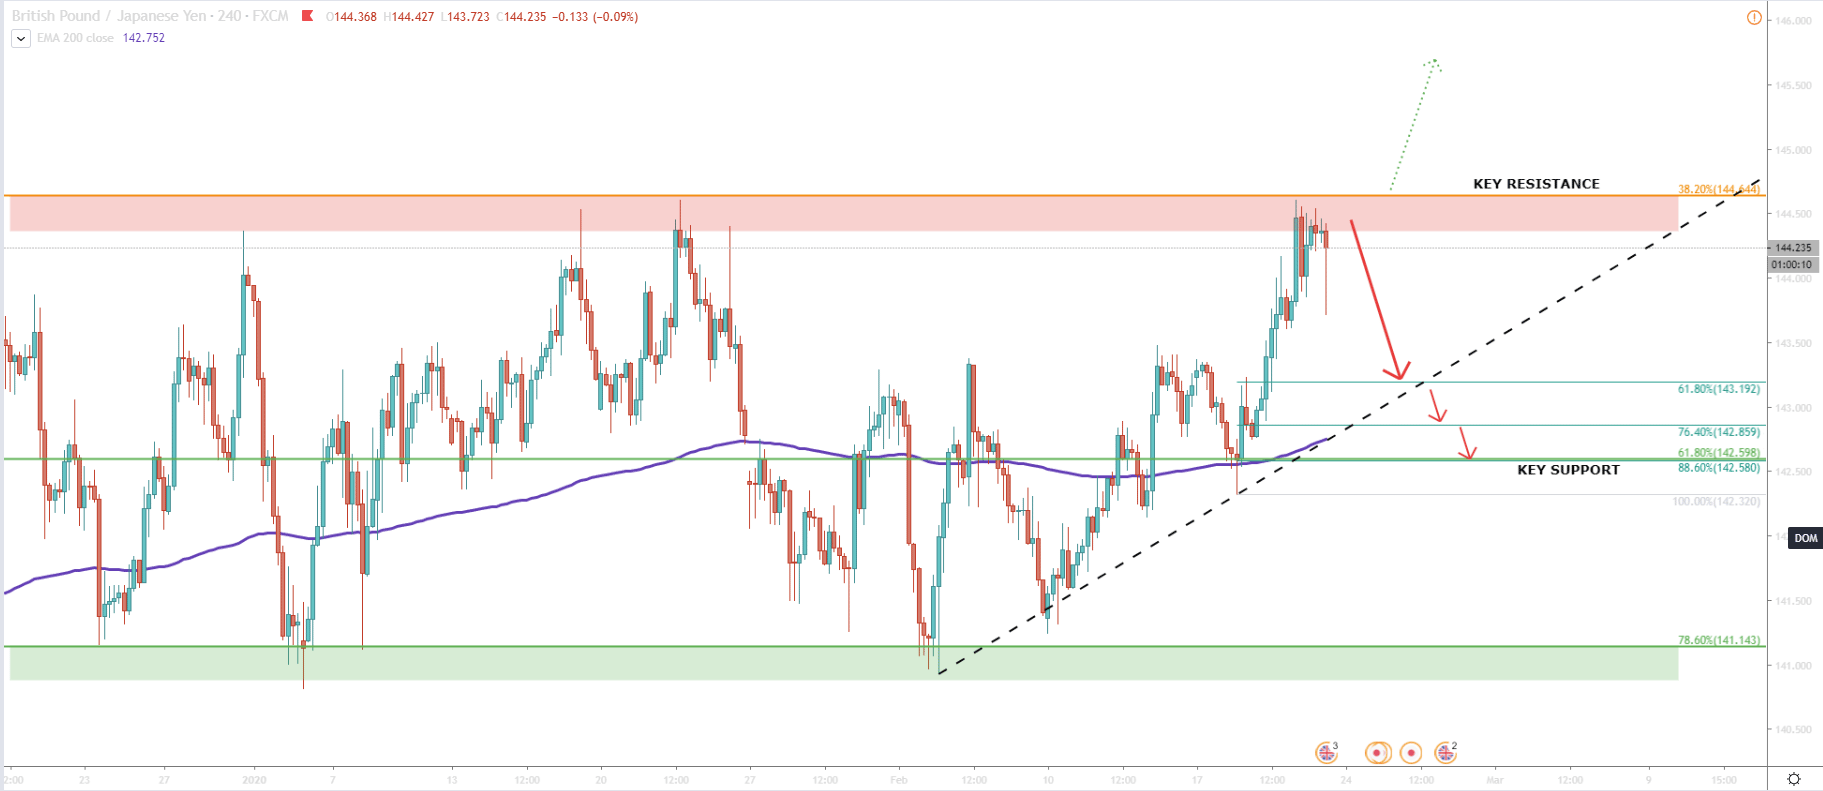
On the 4H chart, it is the same picture, a very wide ongoing consolidation. During the past 48 hours, GBP/JPY stayed right at the top of the range but failed to go any higher. As long as the price remains below the resistance, a downside move can be expected. The most obvious downside target would be the 200 Moving Average, around which price has been moving in the past two months. But there are more target levels to watch, which we will explain in just a bit.
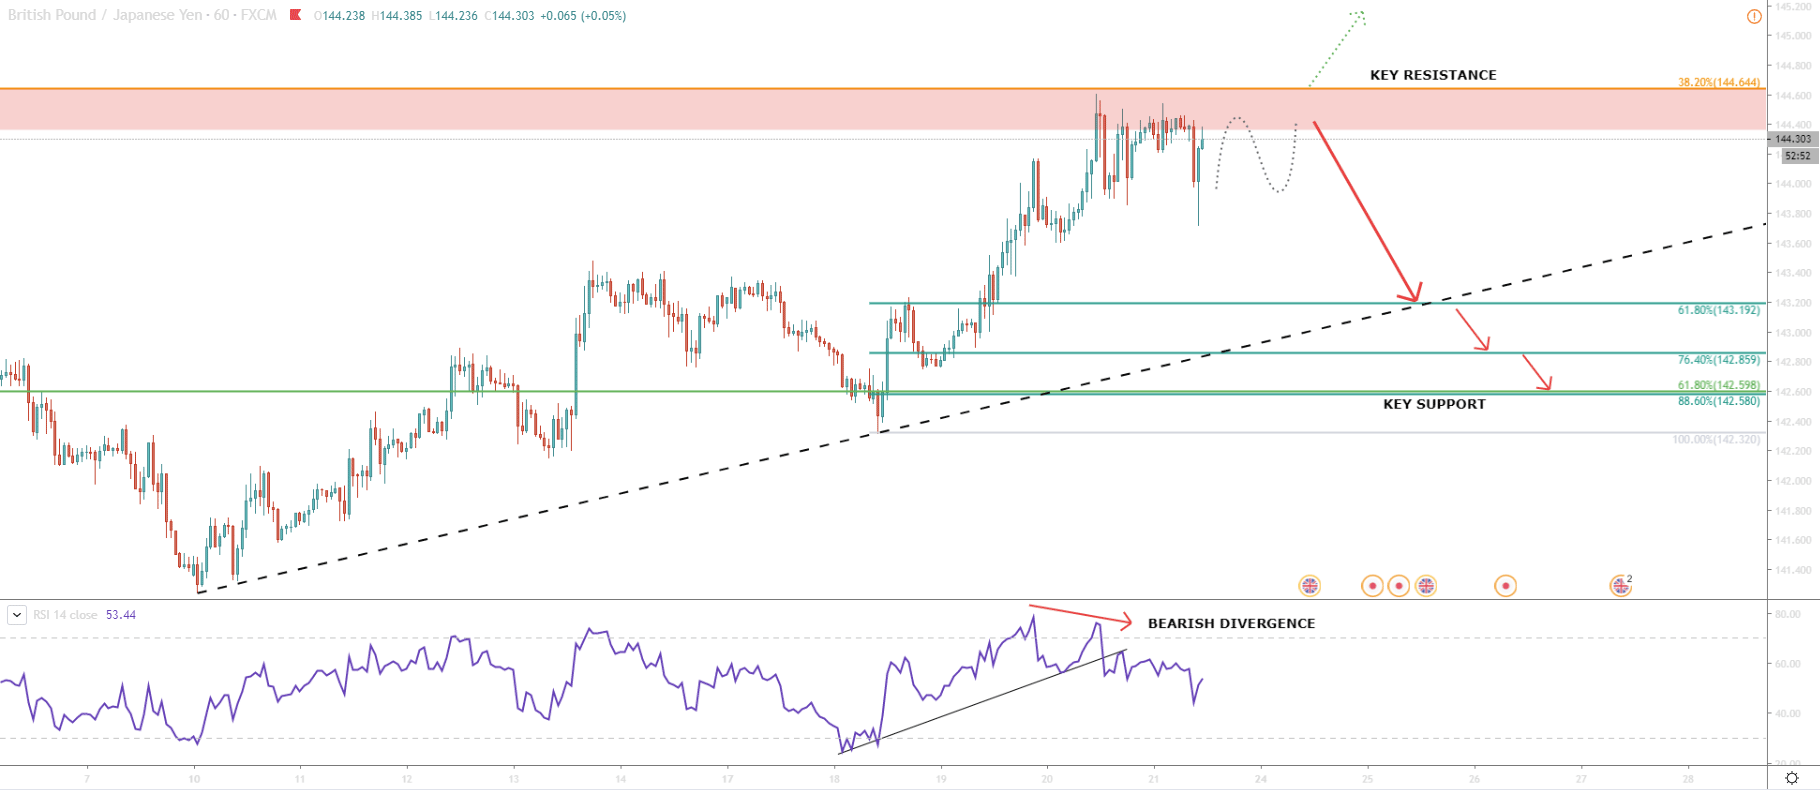
On the 1H chart, we can see a bearish divergence formed by the RSI oscillator. Another important thing is that after forming a divergence, RSI broke below the uptrend trendline, suggesting weakness in price. But now let’s have a look at Fibonacci retracement levels, each of which could provide strong price support in the coming days. Key support is located at 142.60, which is confirmed by two retracement levels at the same time. First, is 61.8% retracement of the Fibonacci applied on the daily chart. Second is the 88.6% Fibonacci retracement level applied to the 18-20 February upside wave.
At the same time, support levels are seen at 61.8% (143.19) and 76.4% (142.85). Any of them could stop price from falling further and therefore must be monitored closely for rejection.
Currently, the pair is at the top of the rage. Bearish divergence on 1H chart suggesting that there won’t be a breakout to the upside and that the range trading is likely to continue.
There are 3 Fibonacci support levels, where each can act as a downside target.
The key support is seen at 142.60 because it is confirmed by two different Fibonacci levels at the same time.
There always must be an alternative scenario and in our case, it would be the break above the range. Key resistance is based at 144.64, which is 38.2% Fibonacci. 4H break and close above this price can be the confirmation of the beginning of a bull trend. Such a move is likely to result in a massive kick of stop losses and can initiate a strong impulse to the upside. But also, the price can start rising very slowly, however under much more volatile market conditions.
In a scenario of a breakout, GBP/JPY could eventually reach the 148.00 resistance, to form a double top at that price.
Support: 143.19, 142.85, 142.60
Resistance: 144.64