
Published: June 9th, 2020
Overall, the GBP is starting to look weaker in relation to other major currencies. For example one of our most recent analyses was for the EUR/GBP which also suggested a weak GBP, while the pair is expected to move up. In today’s analysis, we will look at the highly correlated EUR/GBP currency pair, which is GBP/CHF.
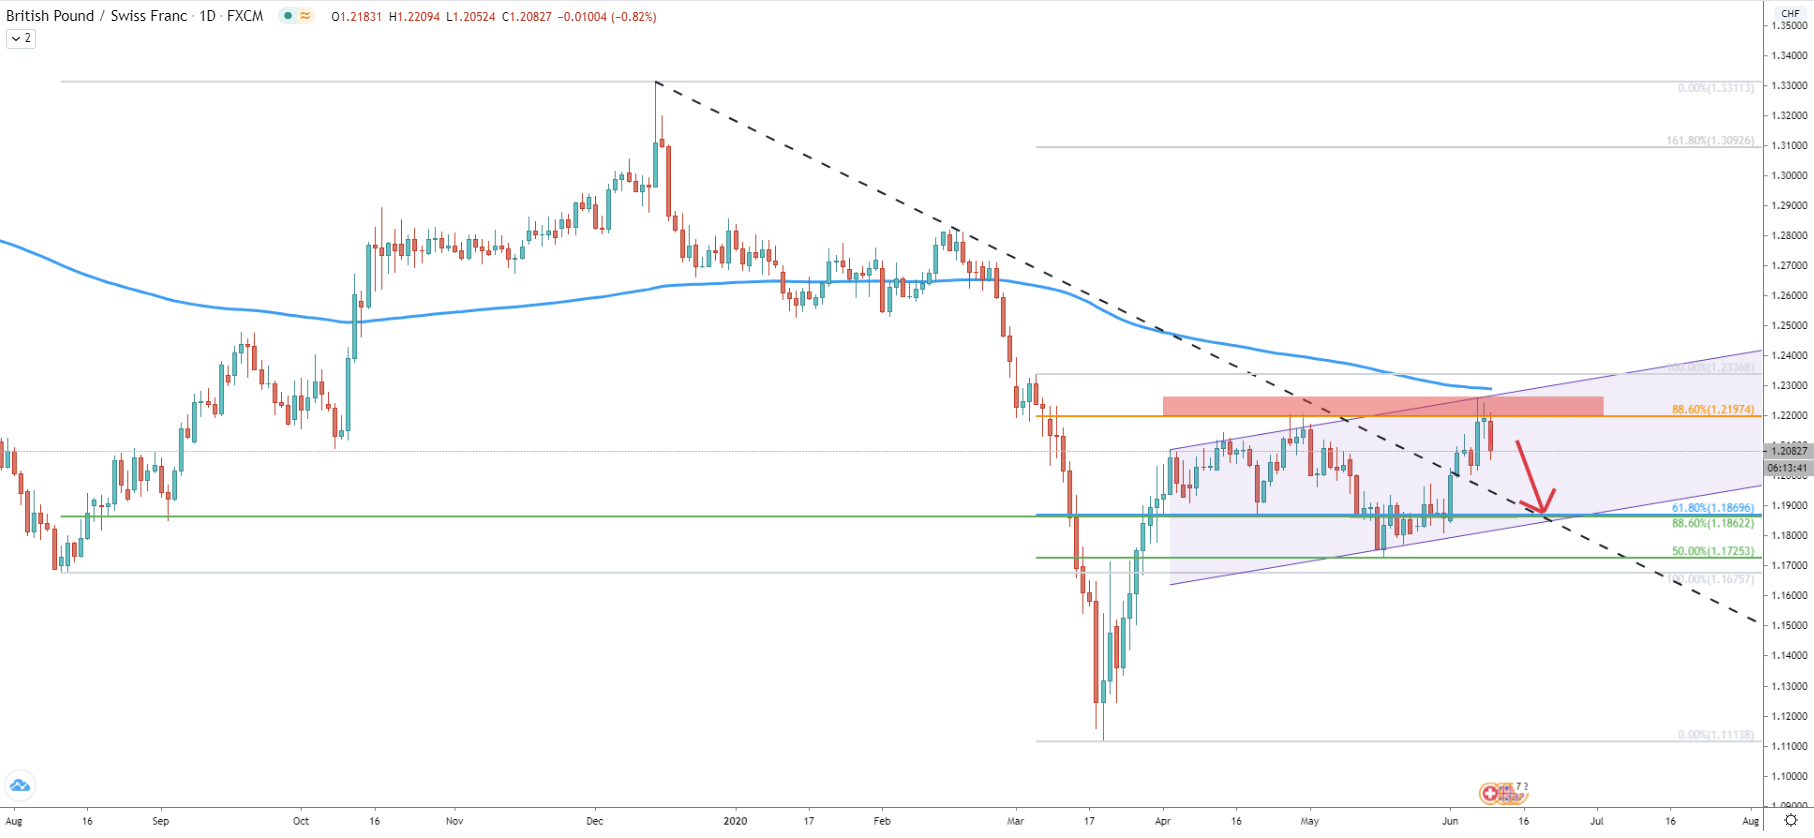
Starting off with a Daily chart, the price still remains below the 200 Exponential Moving Average while producing lower lows and lower highs. This suggests the validity of a long term downtrend, which might continue for weeks to come. Recently price almost reached 200 EMA, although without testing it started to move down. We have applied two Fibonacci retracement levels, one to the August 12, 2019 - December 13, 2019, corrective wave up. The second was applied to the last wave to the downside, which occurred between 05-19 March 2020. It is clear that 61.8% and 88.6% Fibs meet together at 1.1870 area, which back on the April 21 was rejected cleanly.
Perhaps there will be a re-test of this support area, especially considering that it corresponds to the lower trendline of the descending channel and the downtrend trendline, which is now acting as the support. Finally, GBP/CHF has produced a double top near 88.6% Fibs at 1.2200 area, and previously this level has been rejected cleanly. Recently price attempted to break above, although Daily close was below the resistance, yet again suggesting strong downside pressure.
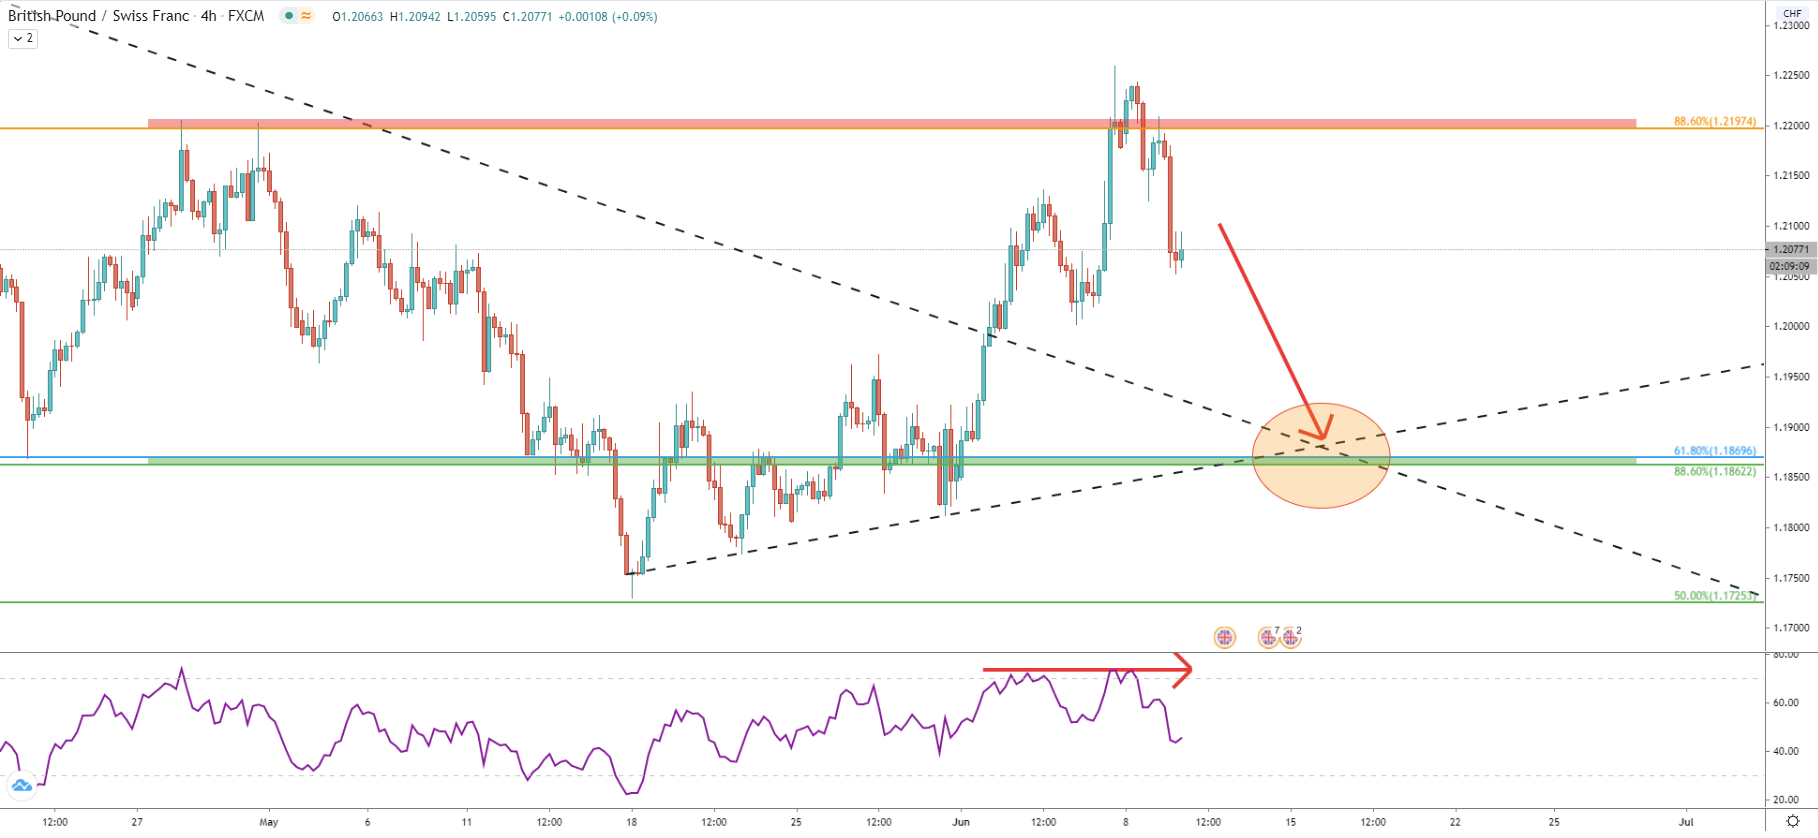
On the 4-hour chart, the bounce off 1.2200 resistance can be seen more clearly. On the attempt to break above the resistance, the RSI oscillator has produced a bearish divergence. After this price went down sharply, and following the fast decline, perhaps a short term consolidation can be expected before/if the price will continue moving lower. We can also see that the downside target corresponds to the uptrend and the downtrend trendlines cross, which still means that there is around 200 pips downside potential.
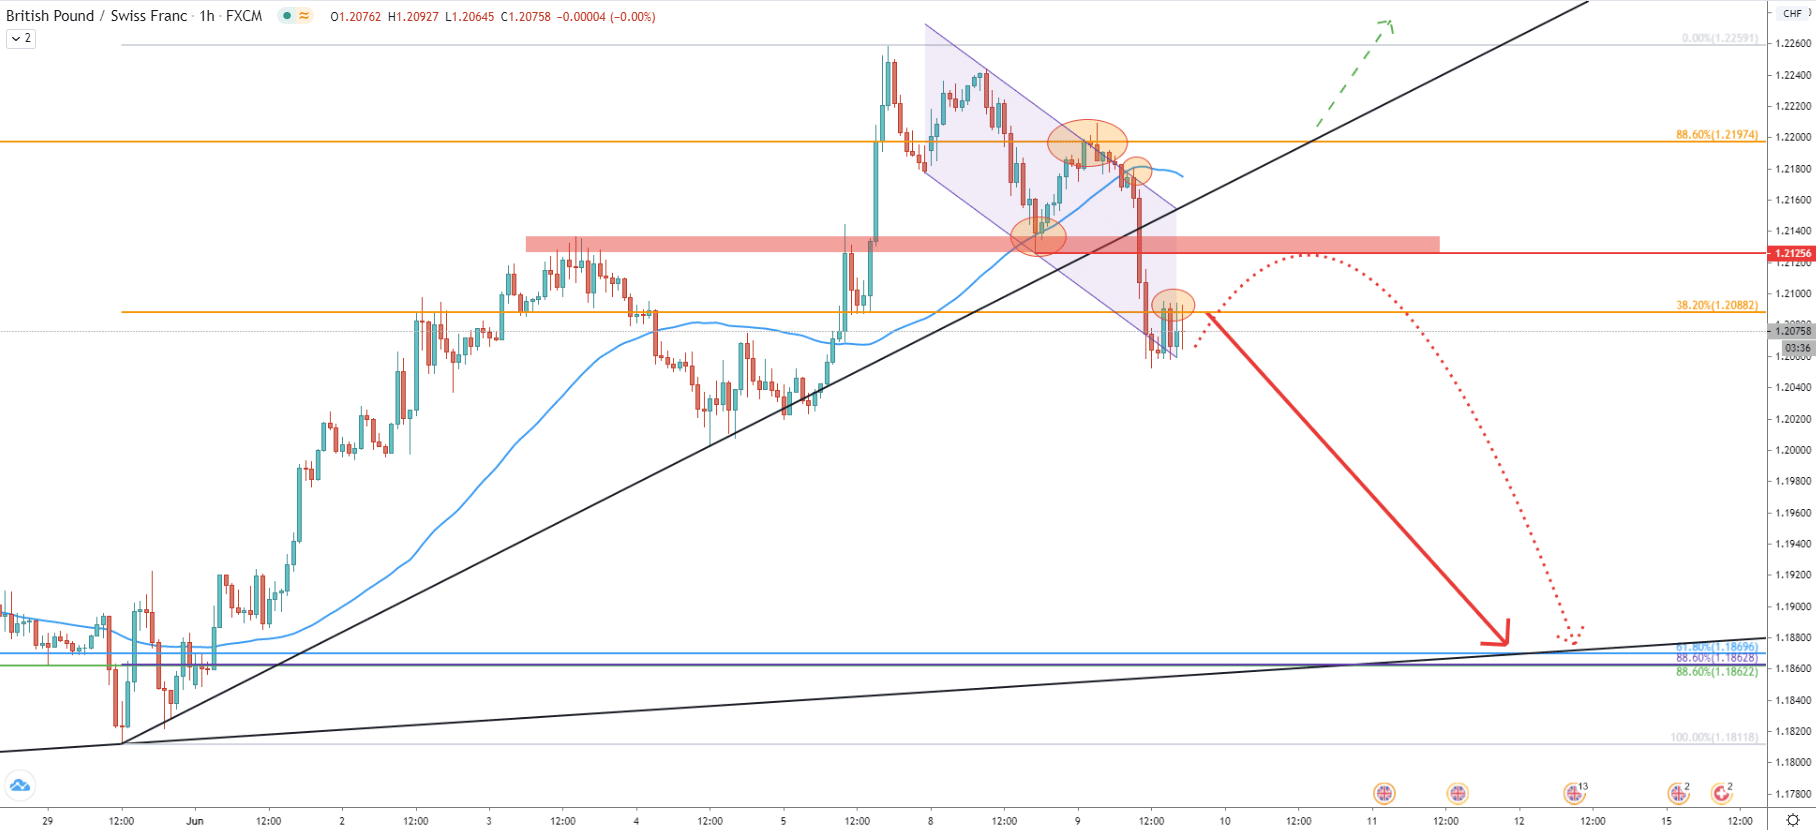
The 1-hour chart shows that GBP/CHF is moving within the descending channel. It is also visible that there was the rejection of the upper trendline of the channel, bounce off the 88.6% Fibs, and then rejection of the 50 Exponential Moving Average. All of this happened within a very short time span, and then the price went down like a rock. It broke below the previously formed support area near 1.2125, and below the 38.2% Fibs at 1.2088. Sellers are in control and while GBP/CHF remains at the 1.2088 resistance, it might provide yet another selling opportunity. The previously mentioned downside target near 1.1870 also corresponds to the 88.6% Fibs applied to the May 29 - June 05 uptrend, and perhaps the final downside target could be right at the 1.1863.
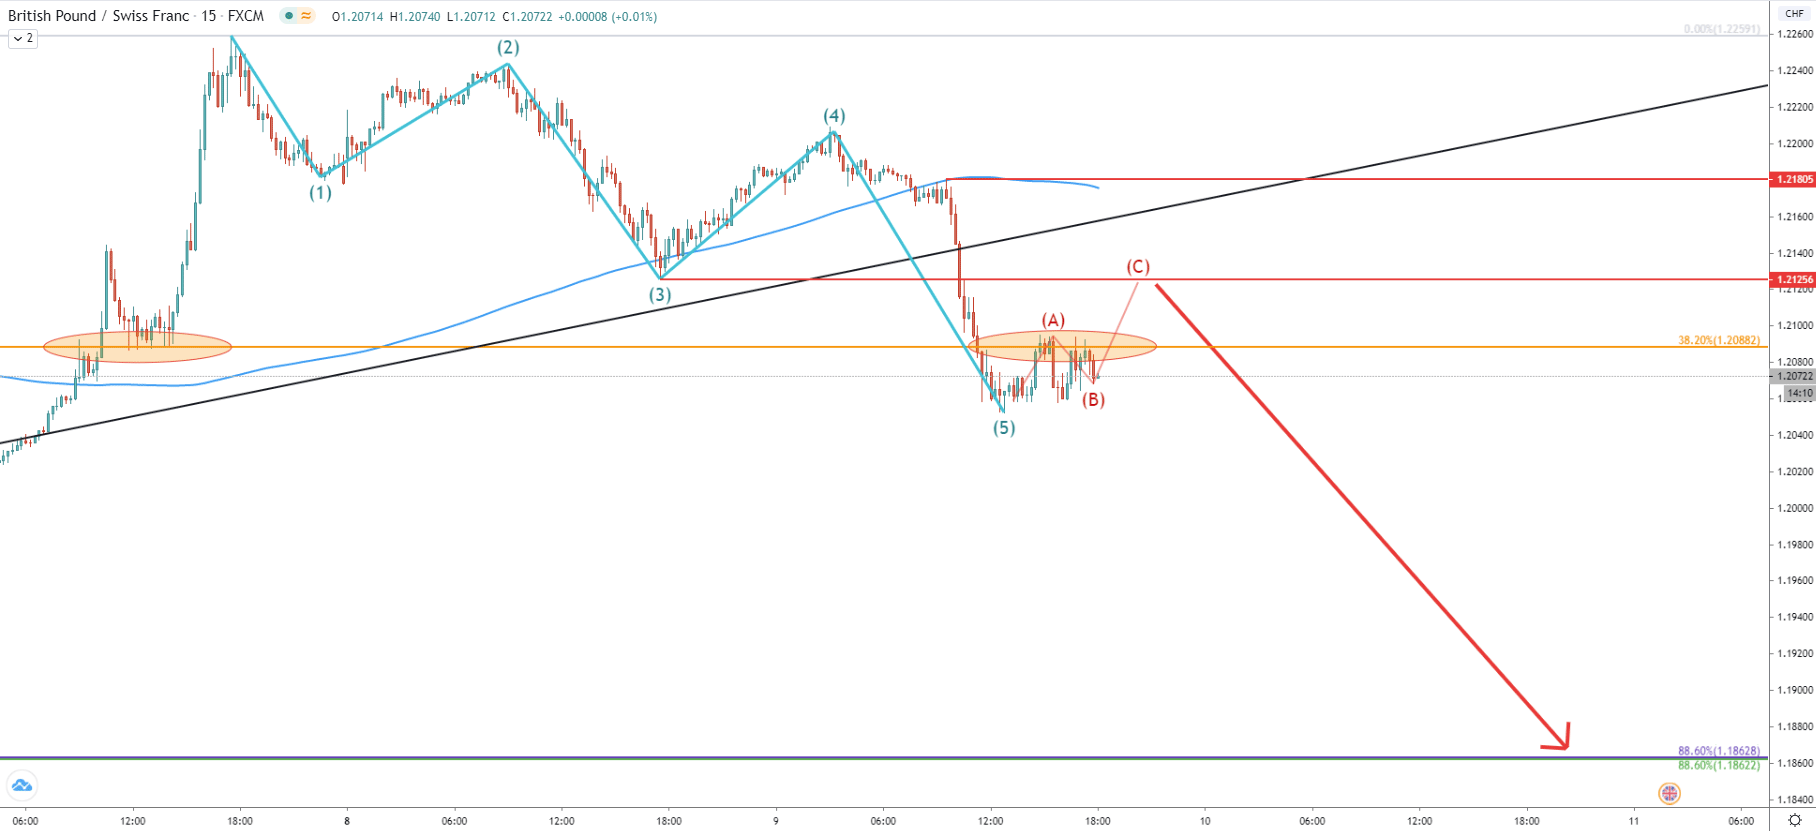
The last chart to analyze is based on a 15m timeframe, where we can observe a clear downtrend pattern. GBP/CHF produced 5 waves to the downside, which means that right now there could be 3 corrective waves to the upside. The resistance is based at the previous support, which is 1.2125 and it is possible that pair will retrace up, in order to re-test this level. But at the same time, we can see that price remains at the 1.2088 resistance level and pair can start moving down without any warning, at any time and without any sort of upside correction.
The recent fast selloff of the GBP/CHF shows that sellers are dominating. Besides, the price remains at the resistance level, which can result in yet another wave to the downside that can be produced at any time.
The one and only key support is located near the 1.1870 area, specifically 1.1863. It is confirmed by 3 different Fibonacci retracement levels as well as the crossing of the uptrend and the downtrend trendlines.
The 1.2180 is the point of rejection of the 50 EMA on the hourly chart, making it a strong resistance level for GBP/CHF. If there will be break and close above this level, GBP/CHF bearish outlook will be immediately invalidated and price should be expected to reverse to the upside.
Support: 1.1863, 1.1725
Resistance: 1.2088, 1.2125, 1.2200