
Published: July 8th, 2020
Today we’ll observe GBP/CHF currency pair on 6 different timeframes. Yes, there will be 6 charts in total, because it is just so much going on and making it impossible to share fewer charts. We’ll try to make it simple and easy to comprehend for everyone. Let’s get started.
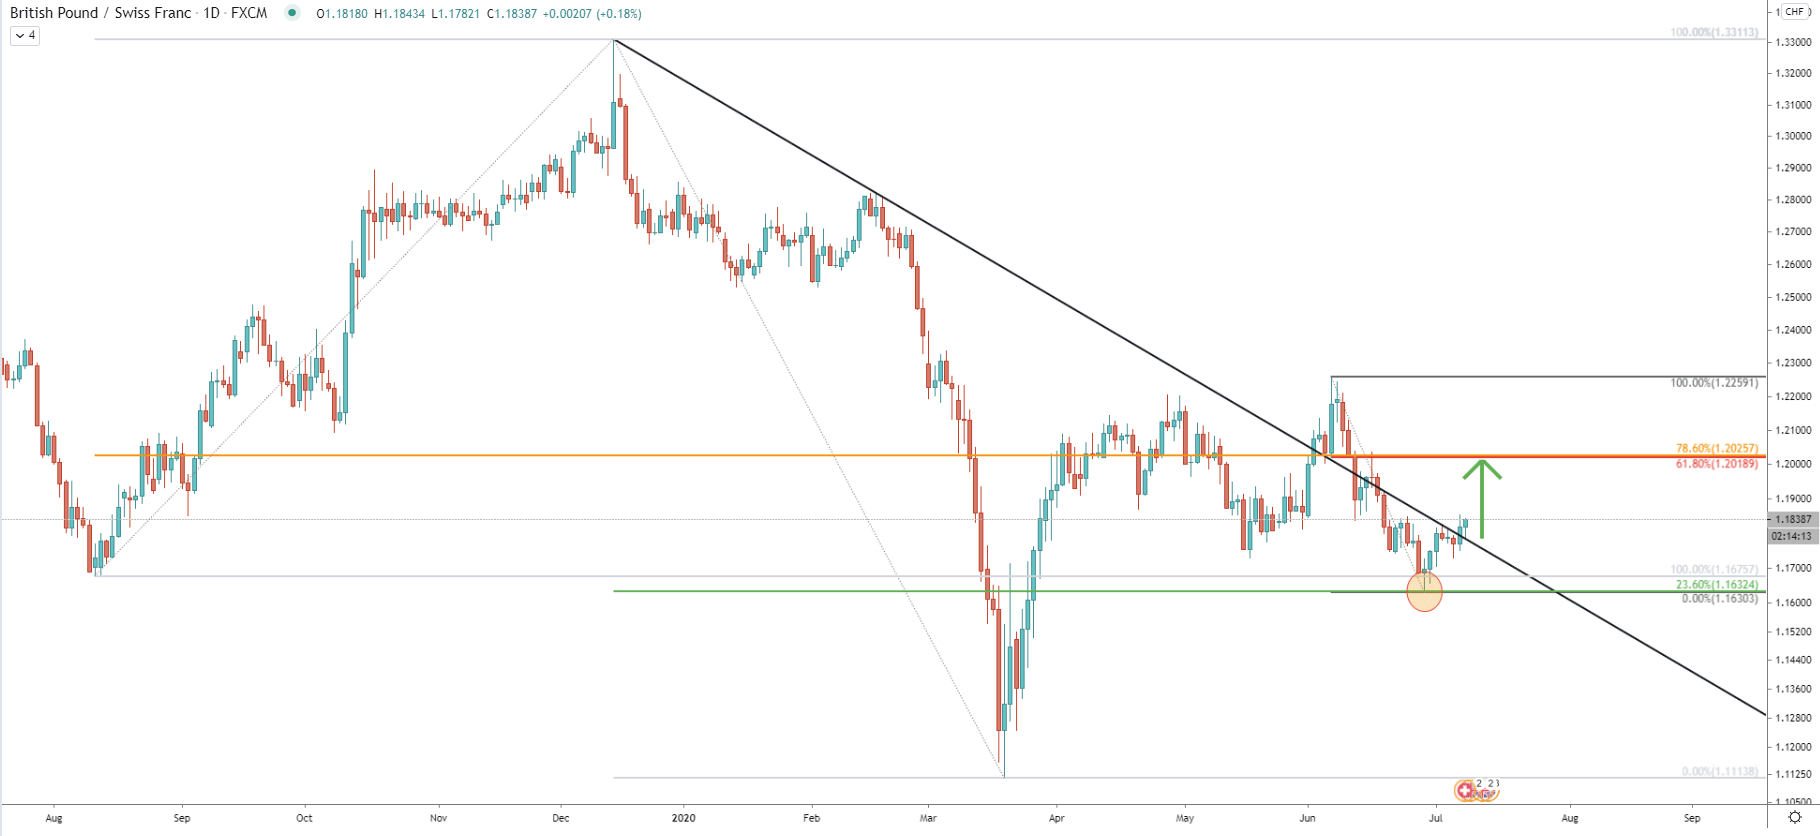
On the daily chart, we have applied 3 Fibonacci indicators, and you can see trendlines of all indicators. One was applied to the uptrend, another to the downtrend, and the third one to the current corrective wave down.
After price broke above the downtrend trendline, a sharp correction down followed. GBP/CHF has dropped from 1.2259 high, down to the 1.1630 low, which is a 620 pips drop. The correction was stoped at 23.6% Fibonacci retracement level which has been rejected cleanly. After the rejection price went up and yet again broke above the downtrend trendline. Based on the 61.8% and 78.6% Fibs the key resistance is seen at the 1.2020 area, which could be the nearest upside target.
Here we have applied other Fibs to the overall uptrend, were GBP/CHF rejected 1.2143 resistance. Recently the price has reached precisely 50% Fibs at 1.1629 and rejected it cleanly. At the same time, the RSI oscillator formed a bullish divergence and price went up, breaking above the 50 Exponential Moving Average. This goes to show that bulls are in control and the uptrend could be starting to dominate.
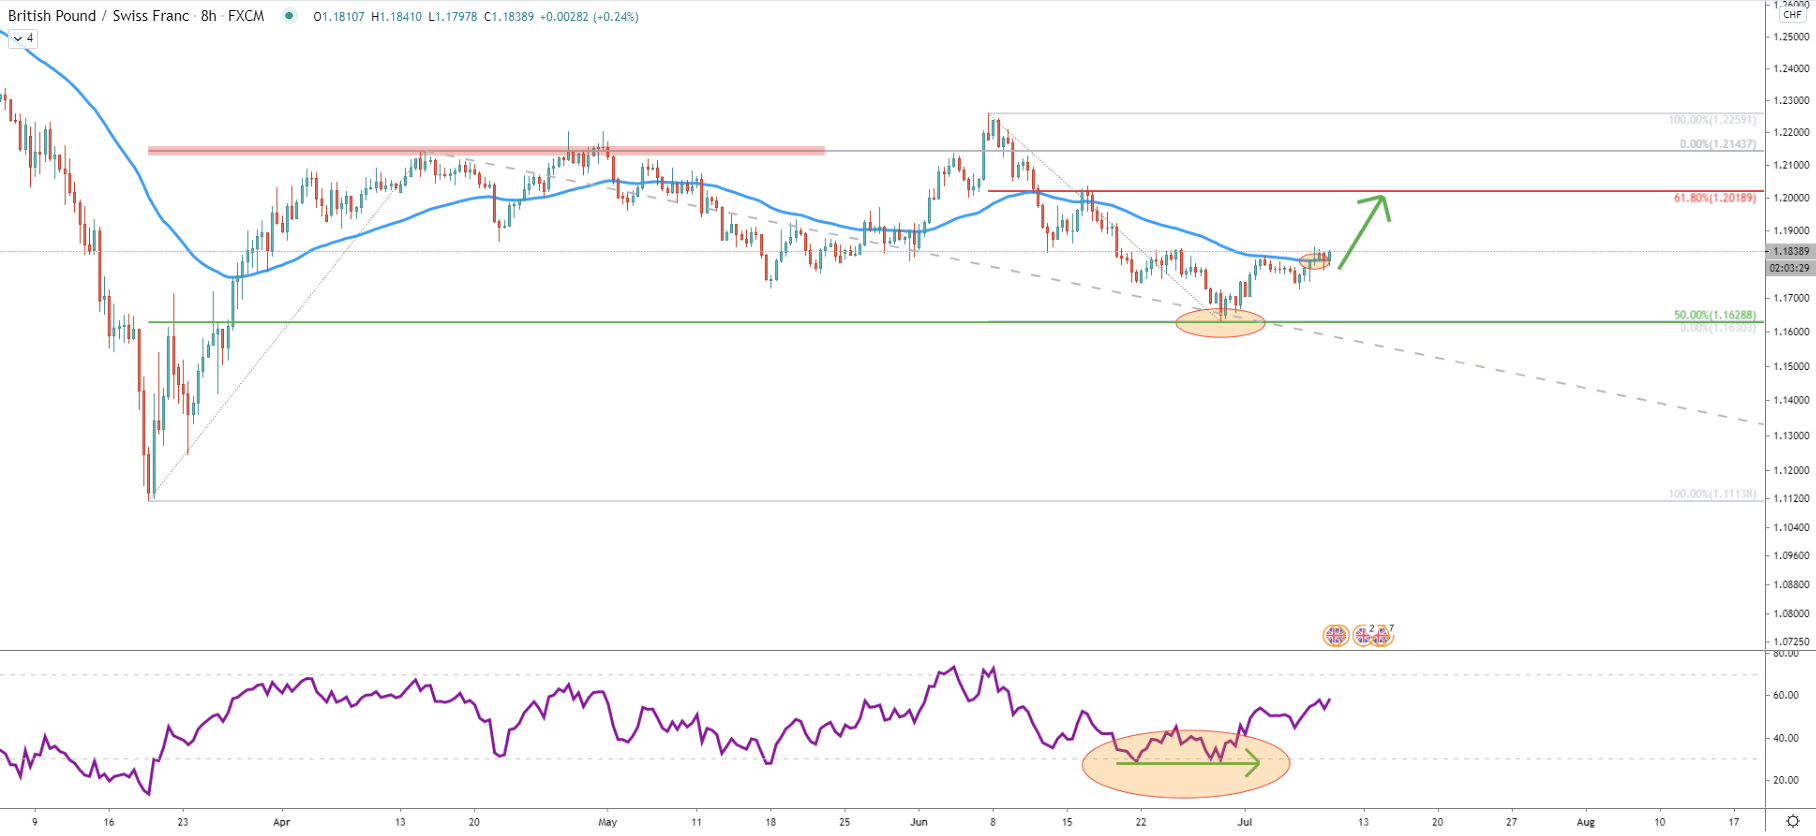
On the 4-hour chart, GBP/CHF rejected the support downtrend trendline, while the RSI oscillator yet again formed a bullish divergence. Price went up and broke above the 50 EMA after which pulled back. On the correction down, pair cleanly bounced off the 50% Fibs and again went above the 50 EMA. Currently, GBP/CHF found support at the EMA, which could have been the potential beginning of an uptrend.
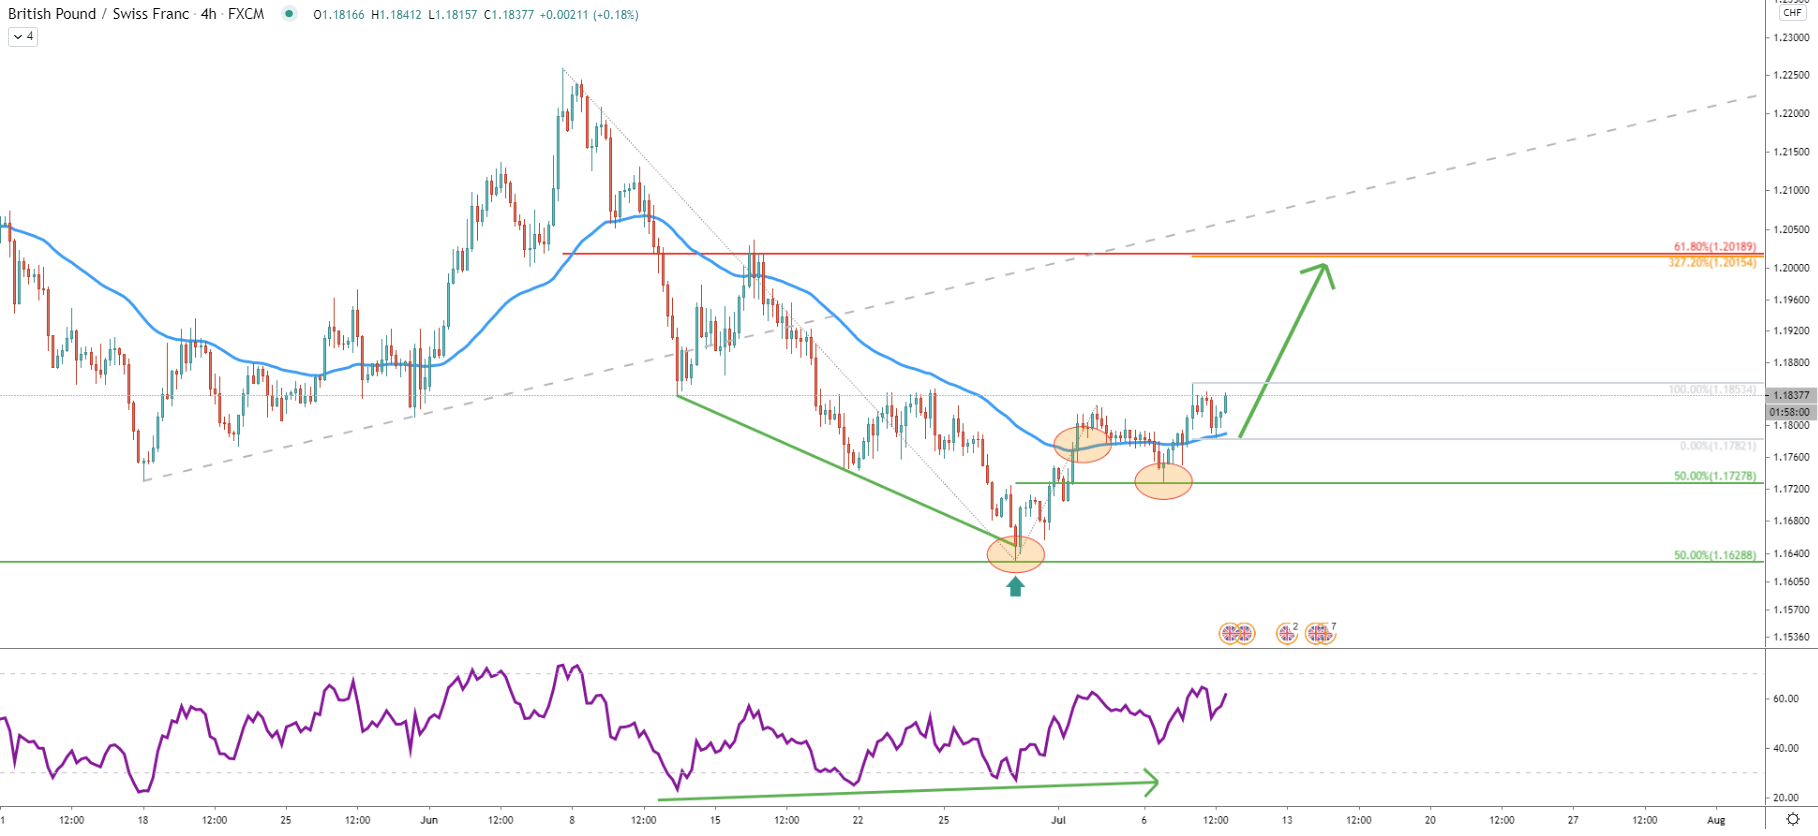
On this chart, we have applied Fibs to the most recent small pullback, where EMA was rejected. What we can see is that 327.2% Fibonacci retracement level is extremely close to the previously mentioned resistance at 1.2020.
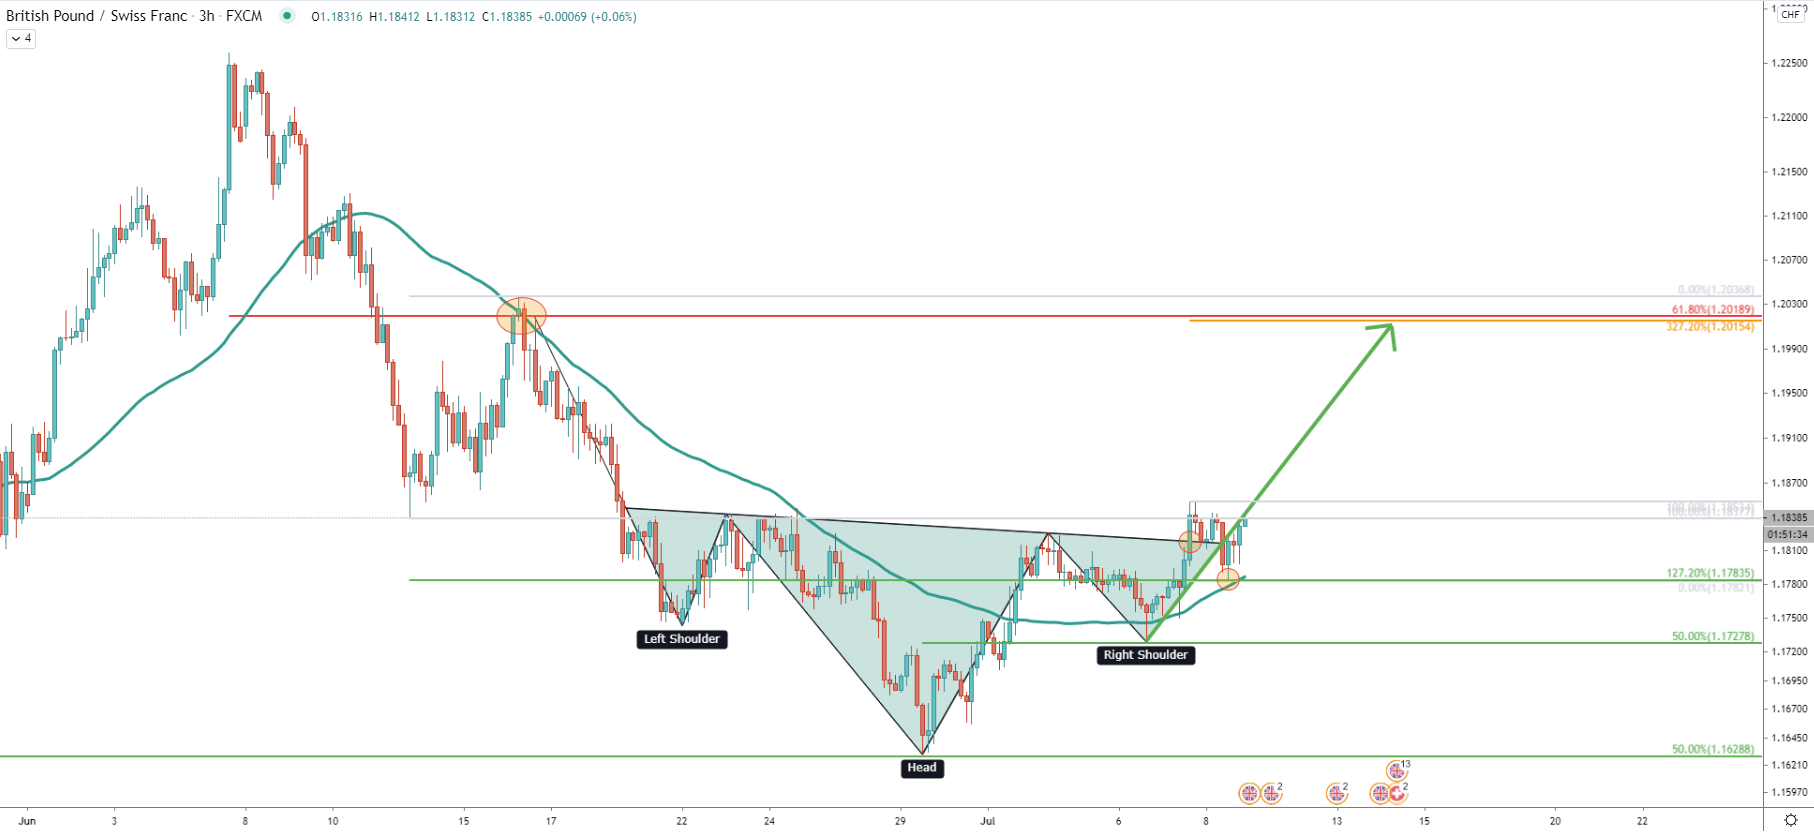
On the 3-hour chart, we have a very famous reversal pattern which is called Inverted Head and Shoulders. The neckline of the pattern was broken and in order to complete H&S price is highly likely to move towards the 1.2015 - 1.2020 area. Another factor to support the potential uptrend is a clean bounce off the 127.2% Fibs, applied to the corrective wave up where 200 SMA was rejected back on June 16.
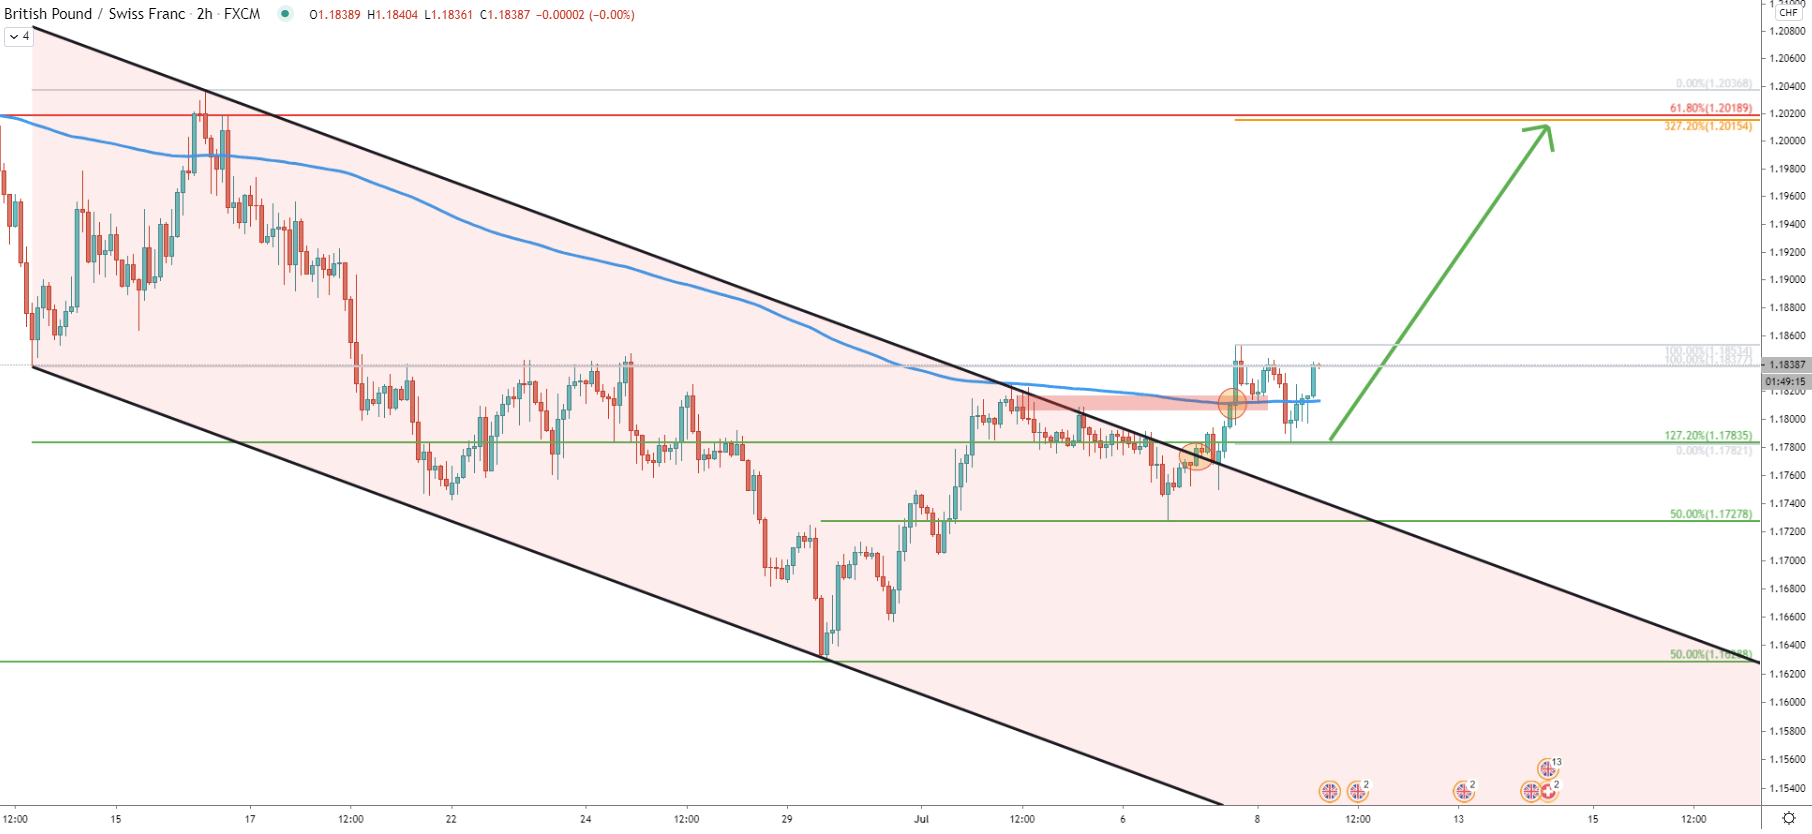
Pair broke above the descending channel along with the 200 EMA on the 2-hour chart. Also, GBP/CHF broke above the previously established resistance area, where EMA and the ascending channel were rejected cleanly back on June 2. So is it the very beginning of a strong upside move? Well, there is certainly a good probability of that happening.
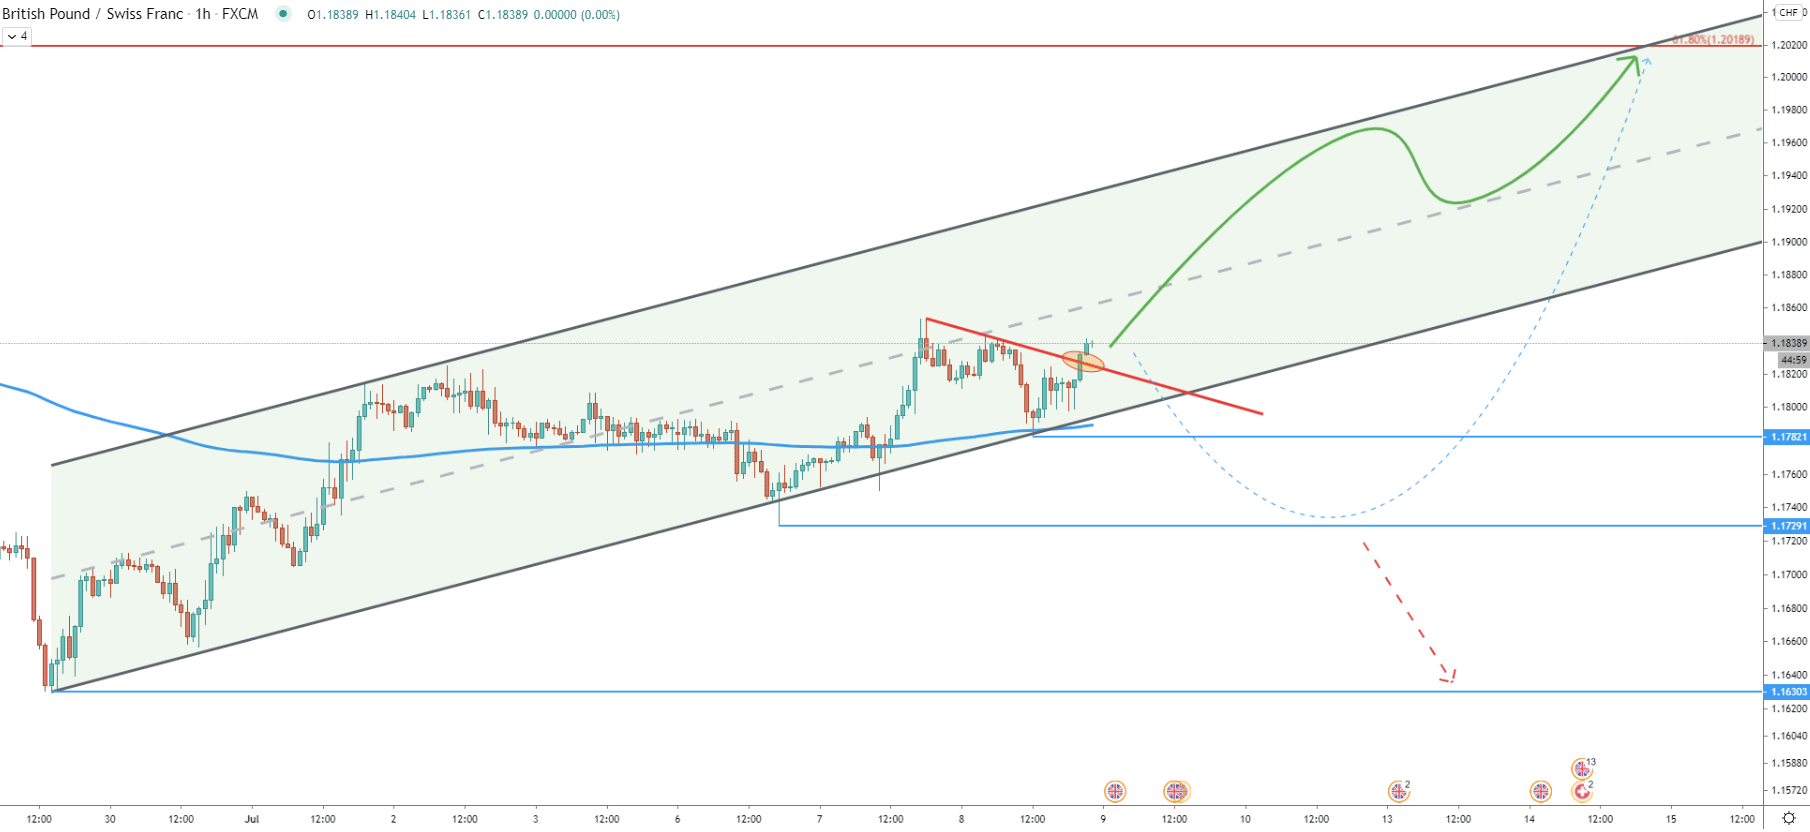
On the 1-hour chart, the price has broken above the downtrend trendline after rejecting the 200 EMA and the lower trendline of the ascending channel. Here we can see multiple price development scenarios, from positive to negative. While GBP/CHF is expected to continue trending up within the channel, it is also possible that there will be an attempt to break below the 1.1728 support.
Each of the charts above showed either a rejection of the support or a break above the resistance. There are just too many bullish signs at the moment and all these facts are strongly in favor of the incoming upside wave. However, we are yet to see if the market will do what it says.
Based on multiple charts and Fibonacci retracement levels, the key resistance area is located between 1.2015 and 1.2020.
All-in-all there are now 3 clean bounces off different Fibonacci retracement levels, and each of them could indicate the potential downtrend continuation in case of the break below. The nearest support is at 1.1783 and it is very possible that the price will go lower to test next support at 1.1728. This is the price where GBP/CHF formed the right shoulder of the H&S pattern. If there will be a daily break and close below this support, the upside scenario will be invalidated and GBP/CHF should move lower to re-test the final support at 1.1628.
Support: 1.1783, 1.1727, 1.1628
Resistance: 1.1853, 1.2015