
Published: May 15th, 2020
Yet again we will continue on the potential strength of the Great British Pound in the medium term. GBP has been clearly trending downwards, which is positive for the UK economy, although this tendency could be ending, at least in the short to medium term. Today we will look at the GBP/CHF currency pair and its’ price potential in the coming weeks.
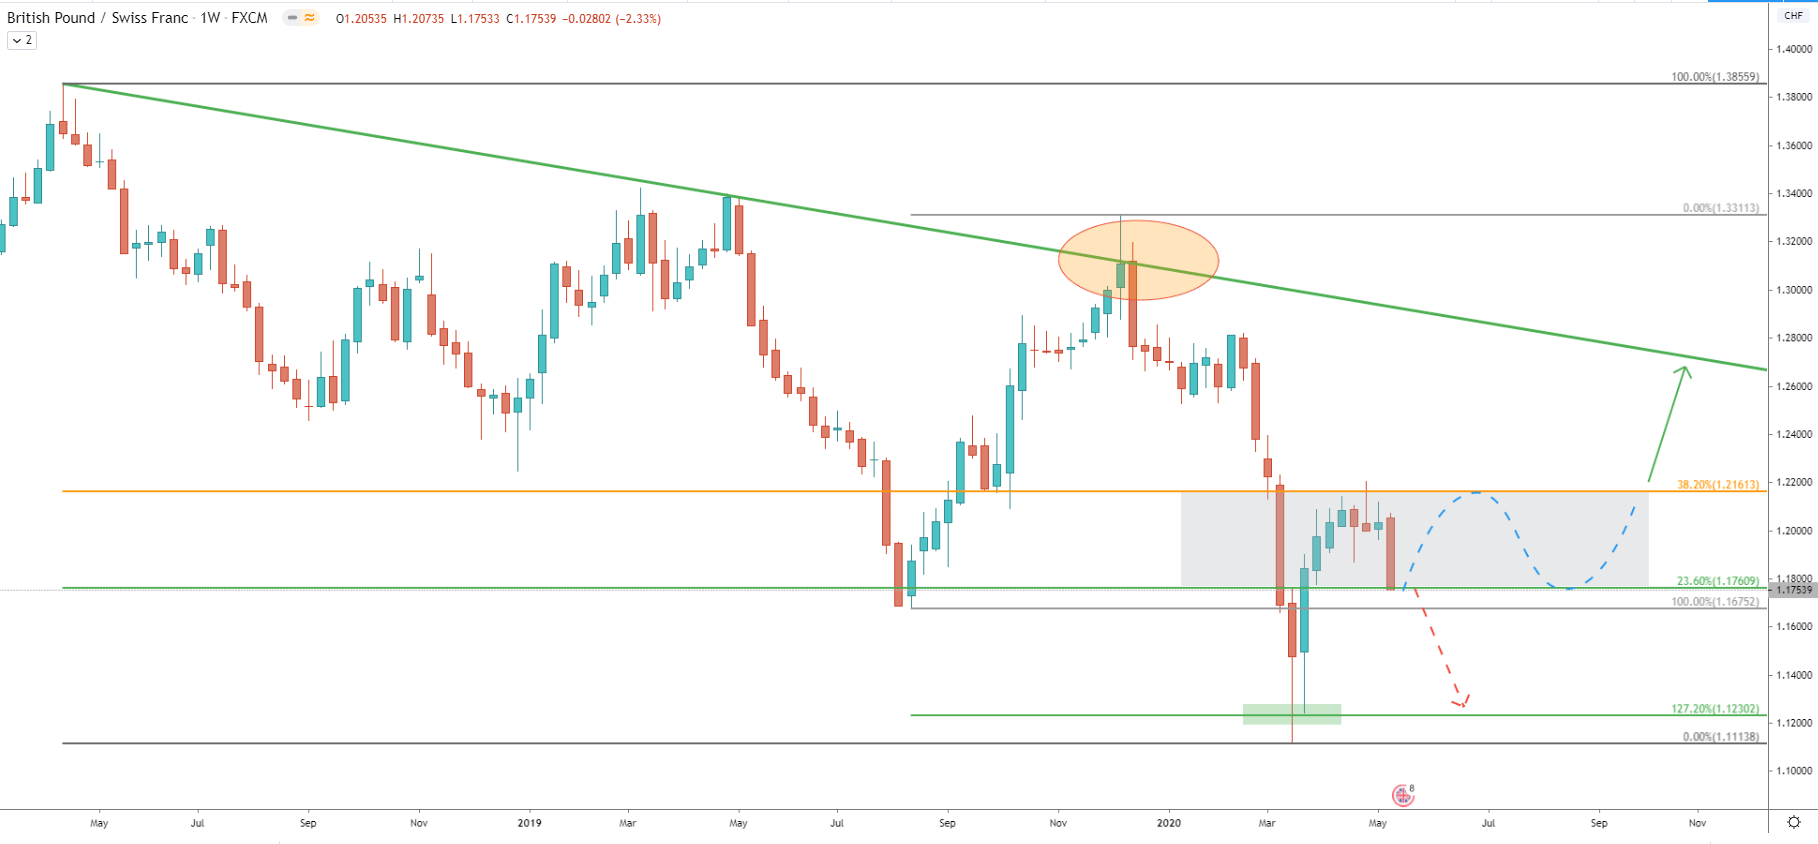
On the weekly chart, we can witness a long term downtrend which has never ended for an extremely long period of time. In fact, GBP/CHF has been trending down since April 2000. This is an astonishing 20 years of decline which should come to an end at some point. Whether this is the time to buy GBP/CHF for the long run is unclear, although medium to short term perspective could be getting bullish.
Price remains below the downtrend trendline suggesting a strong bearish momentum. Although we must take into consideration the previous level of support confirmed by the Fibonacci retracement level. Overall, GBP/CHF has approached the 1.1760 support area, confirmed by the 23.06% Fibonacci retracement level applied to the previous corrective wave up. This might result in the beginning of the consolidation phase over the long timeframe, but in the short timeframe, the price could start to increase. Based on Fibs, the resistance level is based at a 38.2% retracement level that is 1.2160 area, and this is the potential correctional move up, that can take place in the coming weeks.
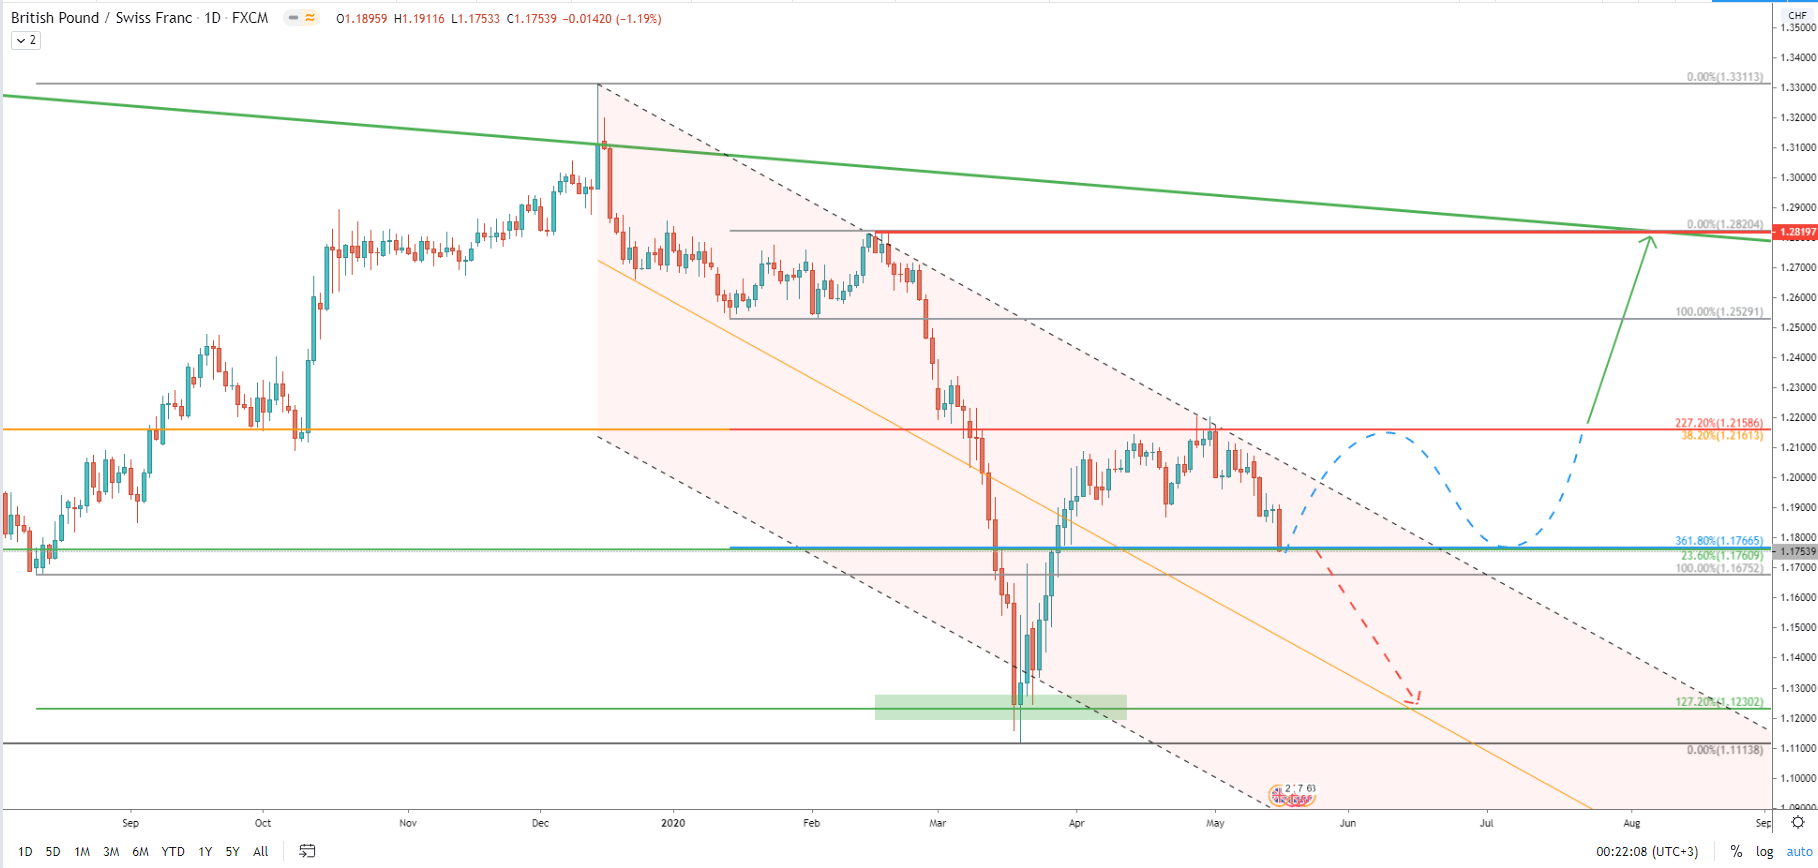
On the Daily chart, the price has reached the bottom of the descending channel, corrected up, and rejected the top of the channel. Still, the long term trend remains heavily bearish, but we can’t ignore the fact that price has approached the major support. The support is located at 1.1766, which is confirmed by two Fibs, 23.6%, and 361.8% level. This could also mean the potential correction to the upside, considering the non-stop decline by GBP/CHF this week.
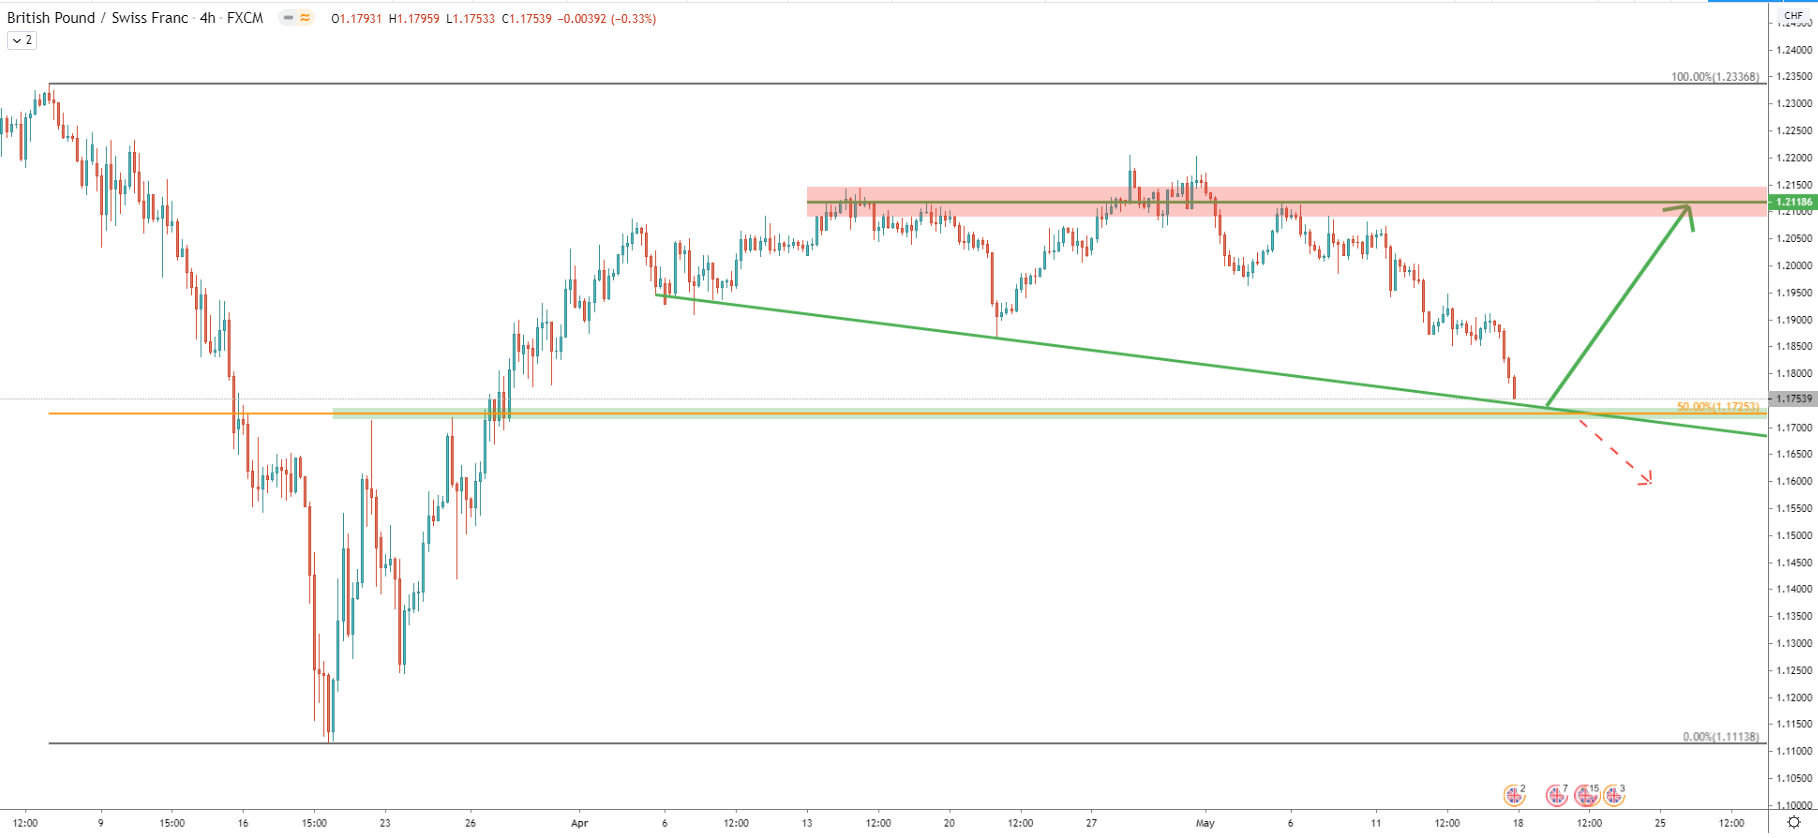
On the 4H chart, it gets more interesting since the price has almost reached to support the downtrend trendline. Along with it 50% Fibs at 1.1725 is very close and we are yet to see whether it will be rejected or broken. In case of rejection GBP/CHF is highly likely to retrace up quite heavily, at least toward the previous resistance area at 1.2120. On the other hand, daily break and close below the Fibonacci support should result in a much stronger move down.

On the 1H chart, the price has reached the bottom of the descending channel, suggesting a potential trend reversal. It is very important to see the weekly closing price above the lower trendline of the descending channel since this could be a perfect confirmation of the incoming corrective move to the upside. According to the 200 Moving Averages, Simple and Exponential, the nearest resistance is based on the 1.1943 area, which is nearly 200 pip growth potential. If GBP/CHF manages to break above this resistance, the dors for mush stronger growth will be wide open.
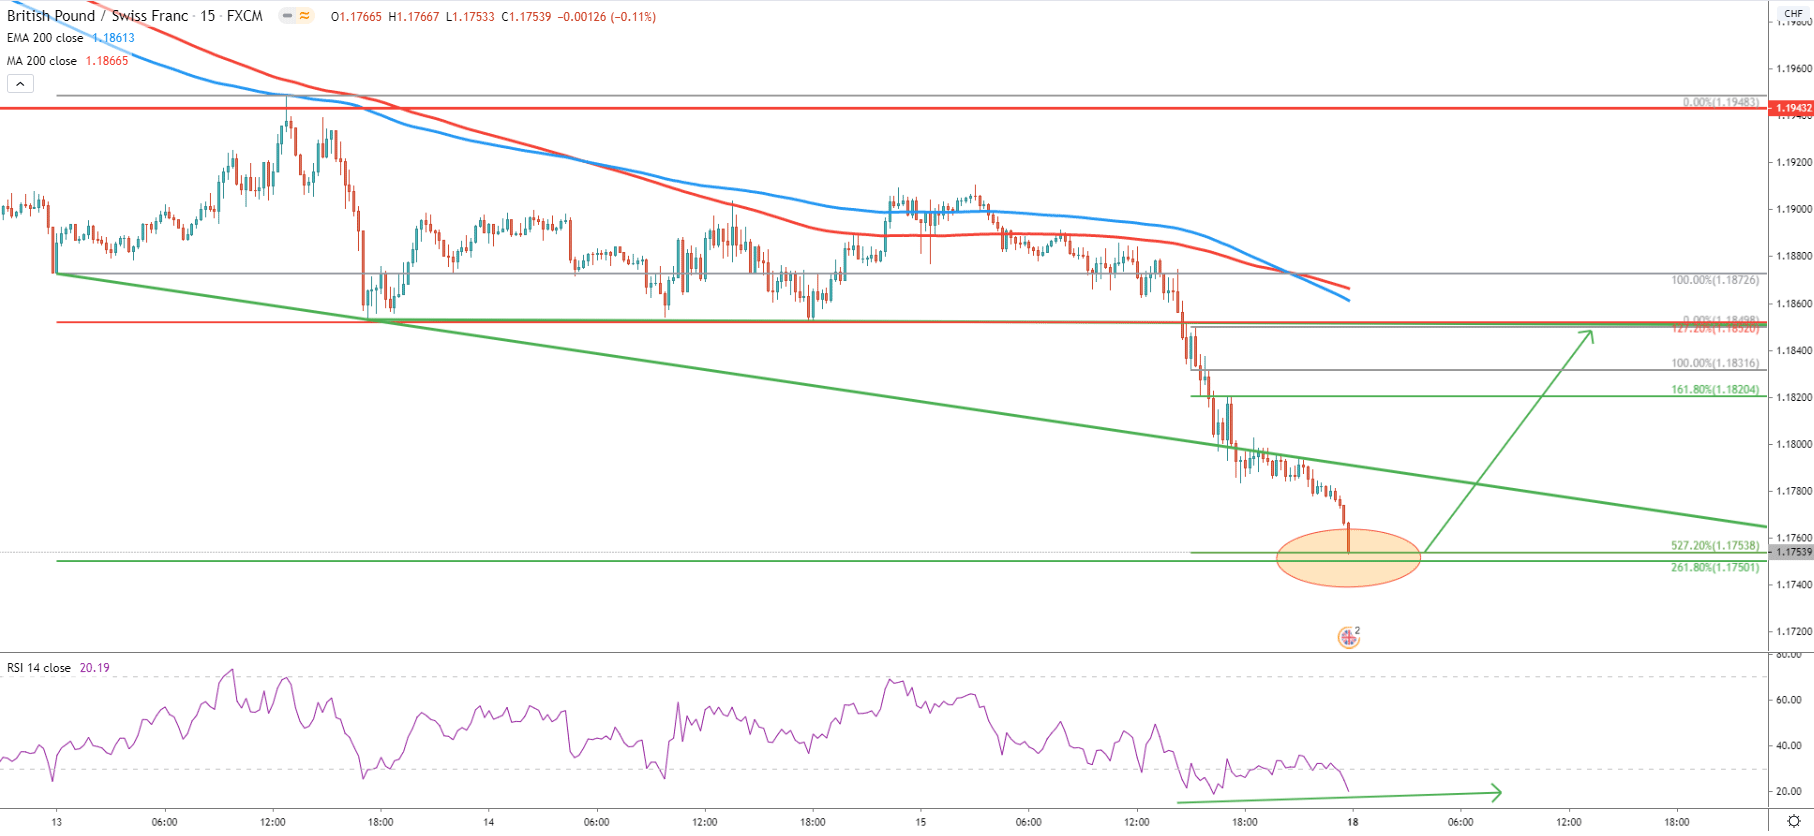
Finally comes the 15M chart, where we have appalled two Fibonacci retracement levels. First to the corrective wave up where 200 EMA was rejected, and second to the corrective wave up after the break below the 1.1820 support. We can see that the 1.1750 area could actually be a strong demand zone. Besides, the RSI oscillator is forming a bullish divergence as the price continues to move lower and RSI fails to produce a new lower low. Perhaps right now GBP/CHF is right at the bottom or very close to it, and such price action might provide a good buying opportunity in the short to medium term.
GBP/CHF has been declining sharply, although there is always time for correction. Based on Fibonacci support levels as well as the rejection of the lower trendline of the descending channel, we can expect a strong pullback.
Based on this analysis, there are two major resistance levels to monitor. First is at 1.1820 as per the 15M chart as the minor resistance. The second is at 1.2118 area as per the 4-hour chart, which seems to be the most likely scenario in case the correction will take place.
As per the 4H chart, extreme resistance is seen at 1.1725. Only daily break and close below this support will completely invalidate bullish outlook and GBP/CHF should be expected to continue long term price decline.
Support: 1.1765, 1.1725,
Resistance: 1.2118, 1.2160