
Published: March 19th, 2020
Today we will observe GBP/CAD currency pair on multiple timeframes to understand the big picture and what to expect in the coming days. Overal pair became very volatile which can result in a substantial price movement. With higher volatility risk increases, but at the same time profit potential also becomes much higher.
Let’s get started with a weekly chart for GBP/CAD
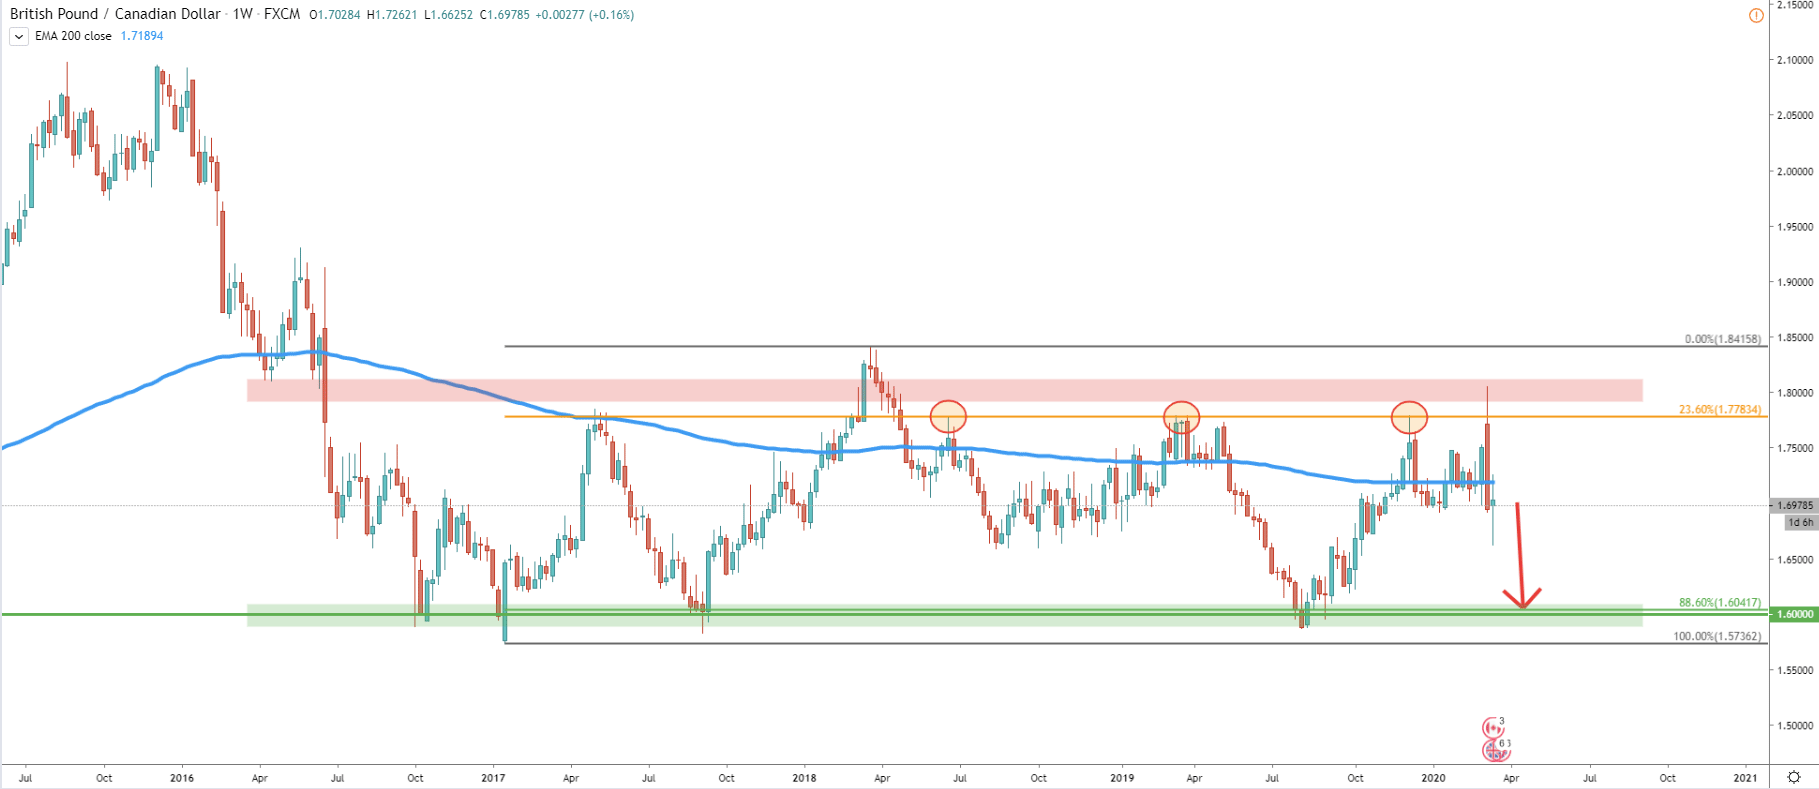
We can see a very wide range-trading zone, which is actually around 2000 pips. Looks like price has stuck between 1.6000 support and 1.8000 resistance zones, and has been staying within for nearly 4 years. Fibonacci applied to the corrective wave up, from the lowest low to 1.8416 high, shows that price found the resistance at 1.7783. Which is 23.6% retracement levels.
Last week, GBP/CAD attempted to break above this level, although it failed to close above. After this, a strong move down followed, resulting in a break and close below the 200 Exponential Moving Average. This shows weakness in price and could initiate yet another move down towards 1.6000 psychological support
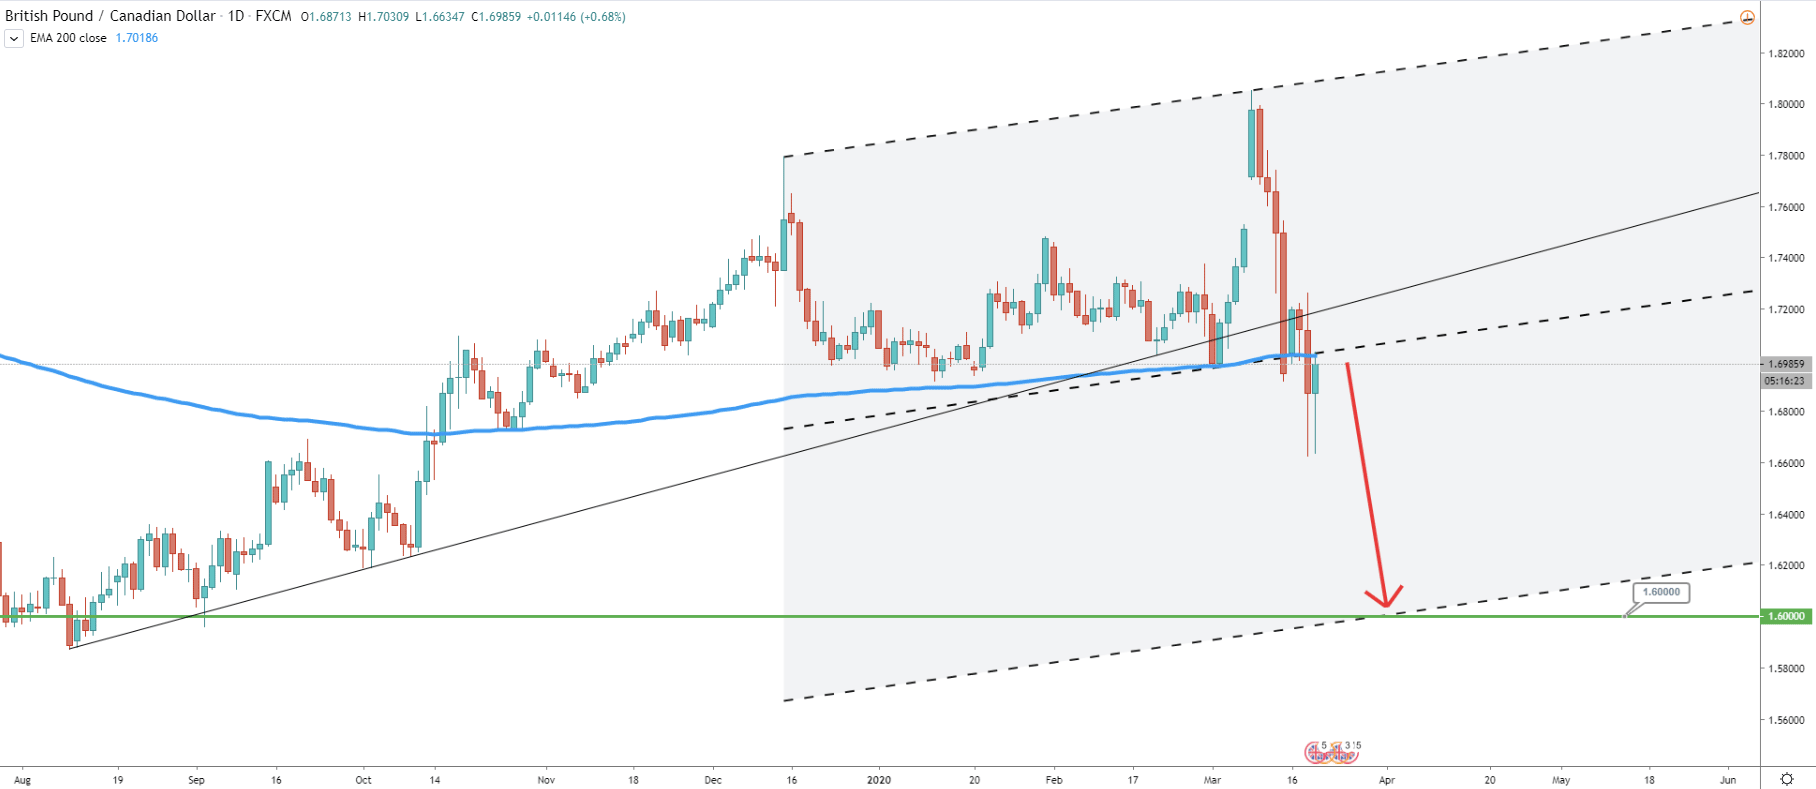
On the daily chart, the pair also broke below the 200 EMA. Not only this, but the price also broke the uptrend trendline along with the ascending channel. The lower trendline of the extended ascending channel shows that price could, in fact, drop towards previously mentions support level at 1.6000.
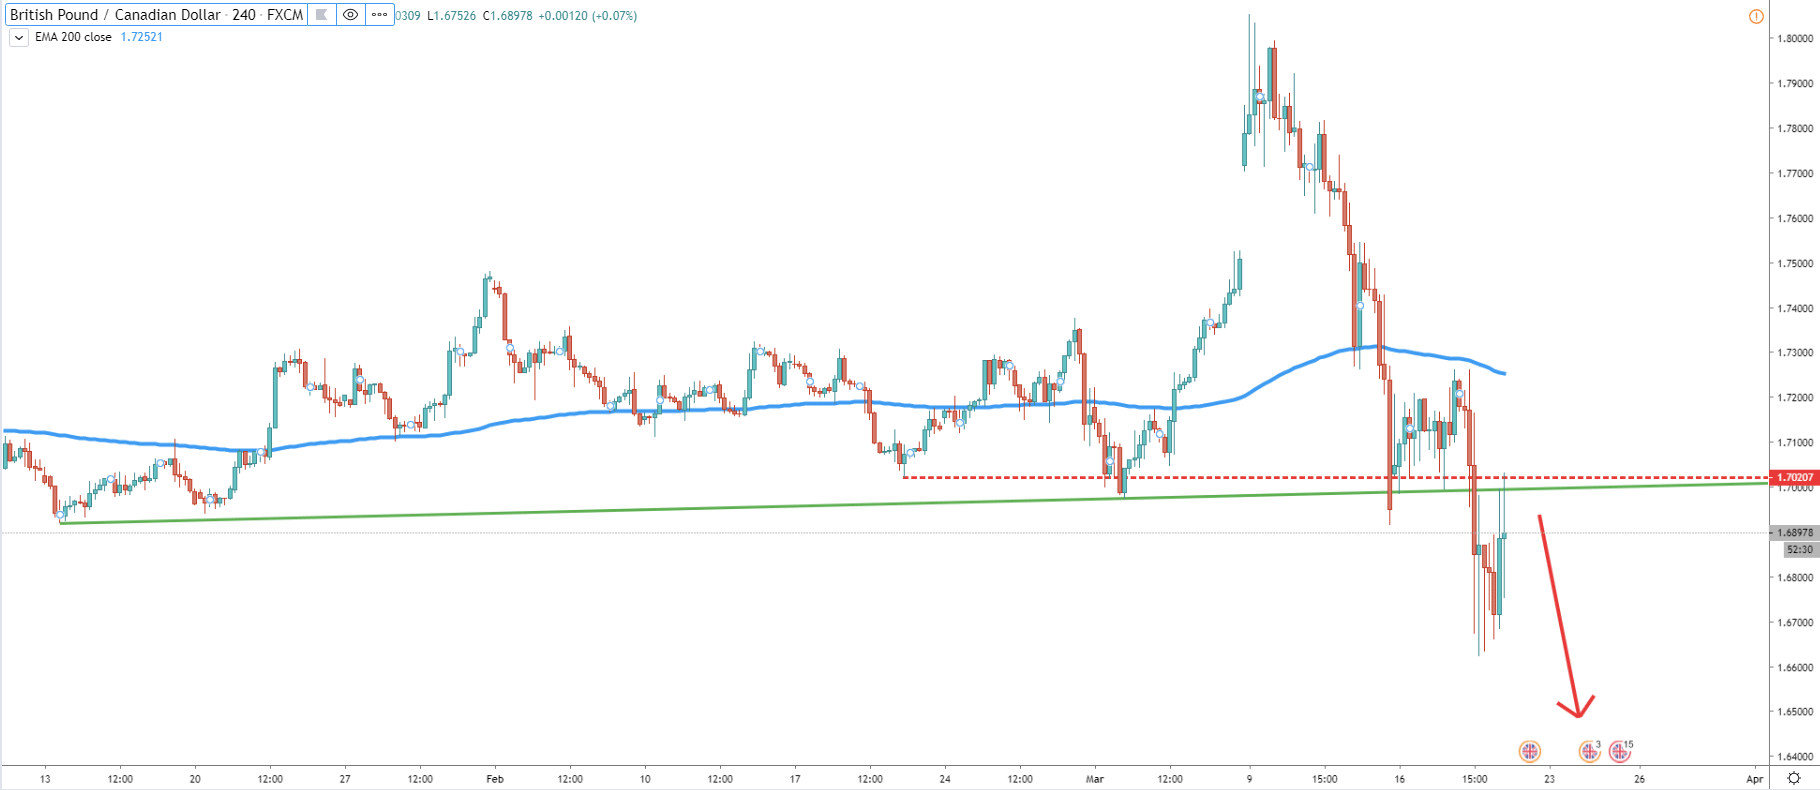
Here we can see another breakout of the uptrend trendline and previously established low. Clearly GBP/CAD begun to print lower lows and lower highs and at the same time is trading below the 200 EMA. This suggest the validity of a downtrend on the lower timeframes. Considering the recent bounce off the 1.7020 resistance area, which previously acted as the support, the downtrend could accelerate further any time from this point onwards.
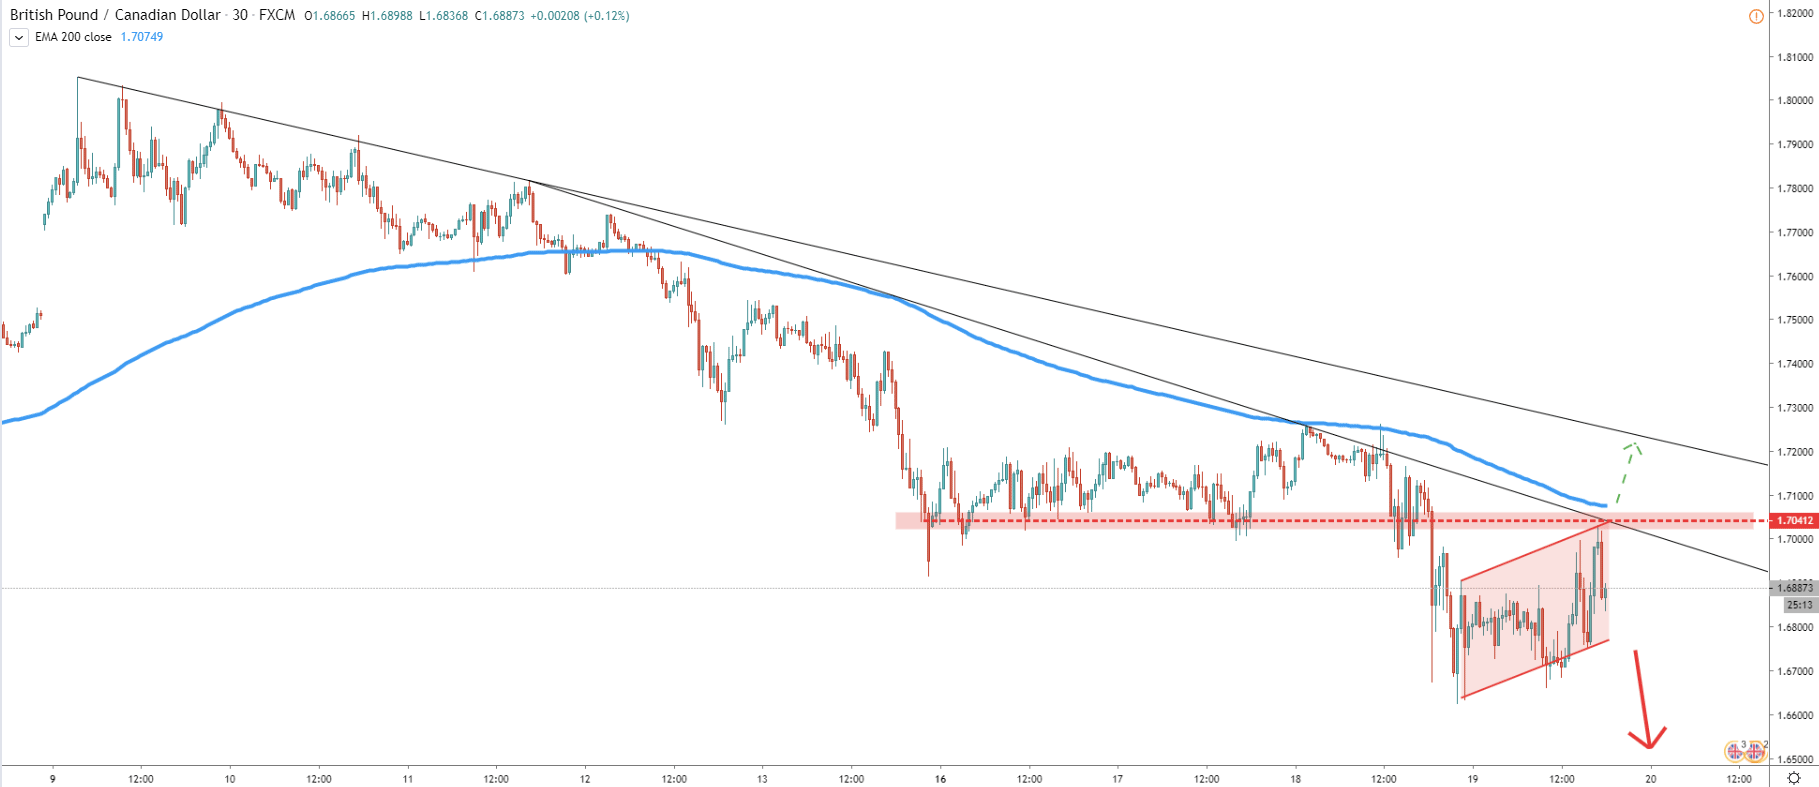
The lowest timeframe we’ll observe is 30m. It also shows that price remains below the 200 EMA and below the downtrend trendline. Recently, after rejecting the 200 EMA, the price broke below a very strong support area near 1.7040. Throughout the past 24 hours, it seems like a bearish flag pattern is being formed. At the same time price has reached the previous level of support, which is now obviously is a resistance. Perhaps the selling opportunity might present itself upon the break below the ascending channel (bearish flat). This should result in a continuation of a strong downtrend, where the price can drop another 800 pips to test 1.6000 support area.
On a weekly chart, it is a clear range-trading for GBP/CAD. Recently price rejected the resistance and now shows strong signals of a downtrend on lower timeframes. This could be the continuation of a downtrend, although, only break below the channel on the 30-m timeframe could be the confirmation.
It is probably best to focus on key psychological levels such as 1.6600, 1.6500, 1.6400, 1.6300, 1.6200, 1.6100, with a 1.6000 being the final downside target.
At this time, the probability of an uptrend, or in other words trend reversal, is very low, since there are too many bearish signals given by the market. However, considering current volatility and unpredictable market behaviour, GBP/CAD should be expected to reverse to the upside at any time. Firs warning sign of trend reversal might be a break above the 1.7040 resistance as well as 200 EMA on a 30M chart. But final confirmation is a daily break and close above the 1.7265 resistance, where previously price rejected the 200 EMA.
Support: 1.6600, 1.6500, 1.6400, 1.6300, 1.6200, 1.6100, 1.6000
Resistance: 1.7040, 1.7265