
Published: August 10th, 2020
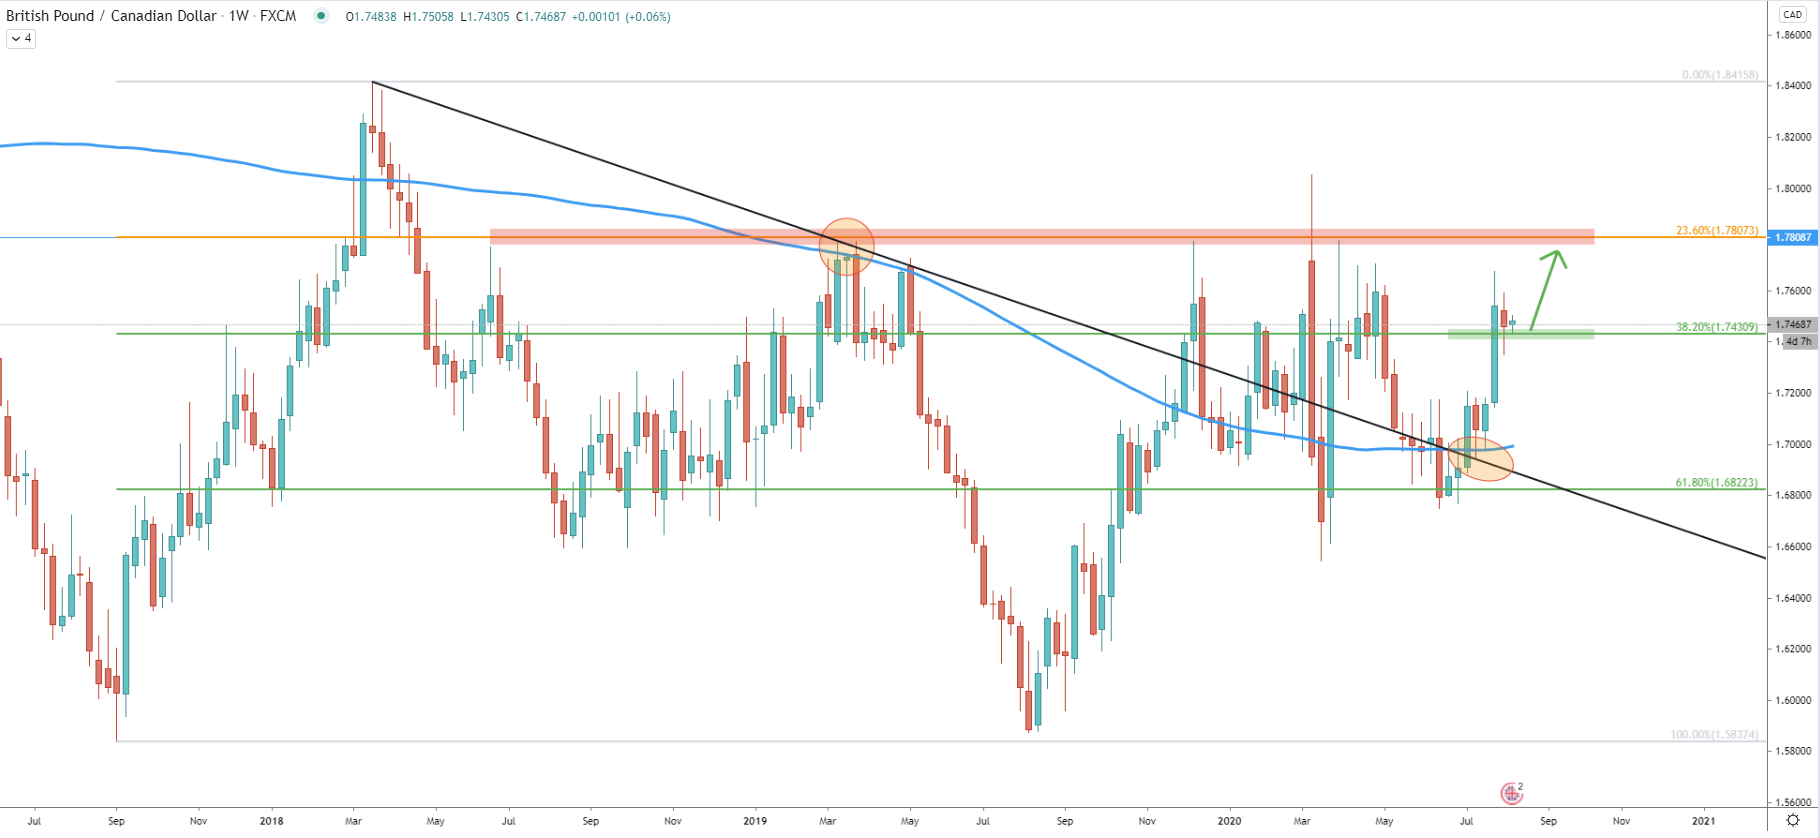
If we look a the Weekly chart price action, we are able to see an extremely wide range-trading. The support area has been formed near 1.5900 and the resistance near 1.7800. The support is confirmed by the double bottom formation, and the resistance by 23.6% Fibonacci retracement level applied to the September 2017 - August 2019 upside swing.
During past 3 weeks, after the pair rejected the downtrend trendline along with the 200 Simple Moving Average, the price has gone up substantially. Right now it found the support at 1.7430, which is 38.2% Fibonacci retracement level. Such price action can result in further growth of the GBP/CAD, eventually reaching 1.7800 key psychological resistance corresponding with 23.6% Fibonacci retracement level.
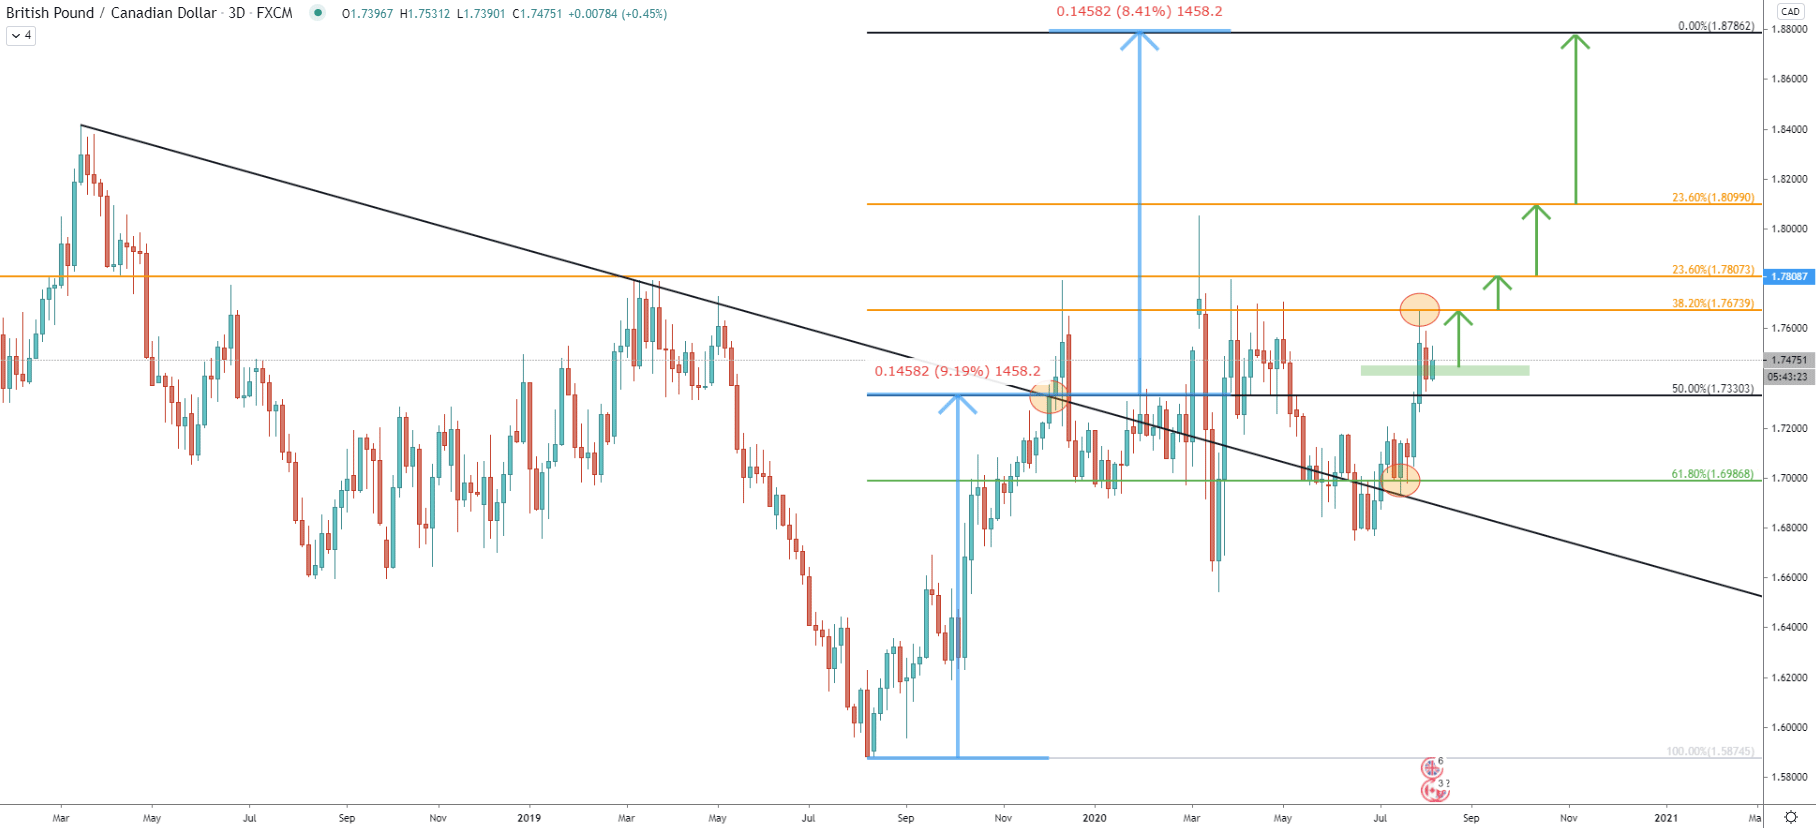
To get a detailed picture of the potential resistance levels, we have applied the Fibonacci retracement indicator to the downtrend trendline breakout point. Fibs were applied so that the 50% retracement level is placed at 1.7330, where GBP/CAD broke above the trendline. This approach provides the potential final upside target which is located at 1.8786, i.e. 0% retracement level. Along with the final resistance, we can also see 38.2% Fibs at 1.7674, where the price bounced off on July 31. It could be that this level is the nearest resistance and GBP/CAD could be heading up to re-test this level and produce a double top.
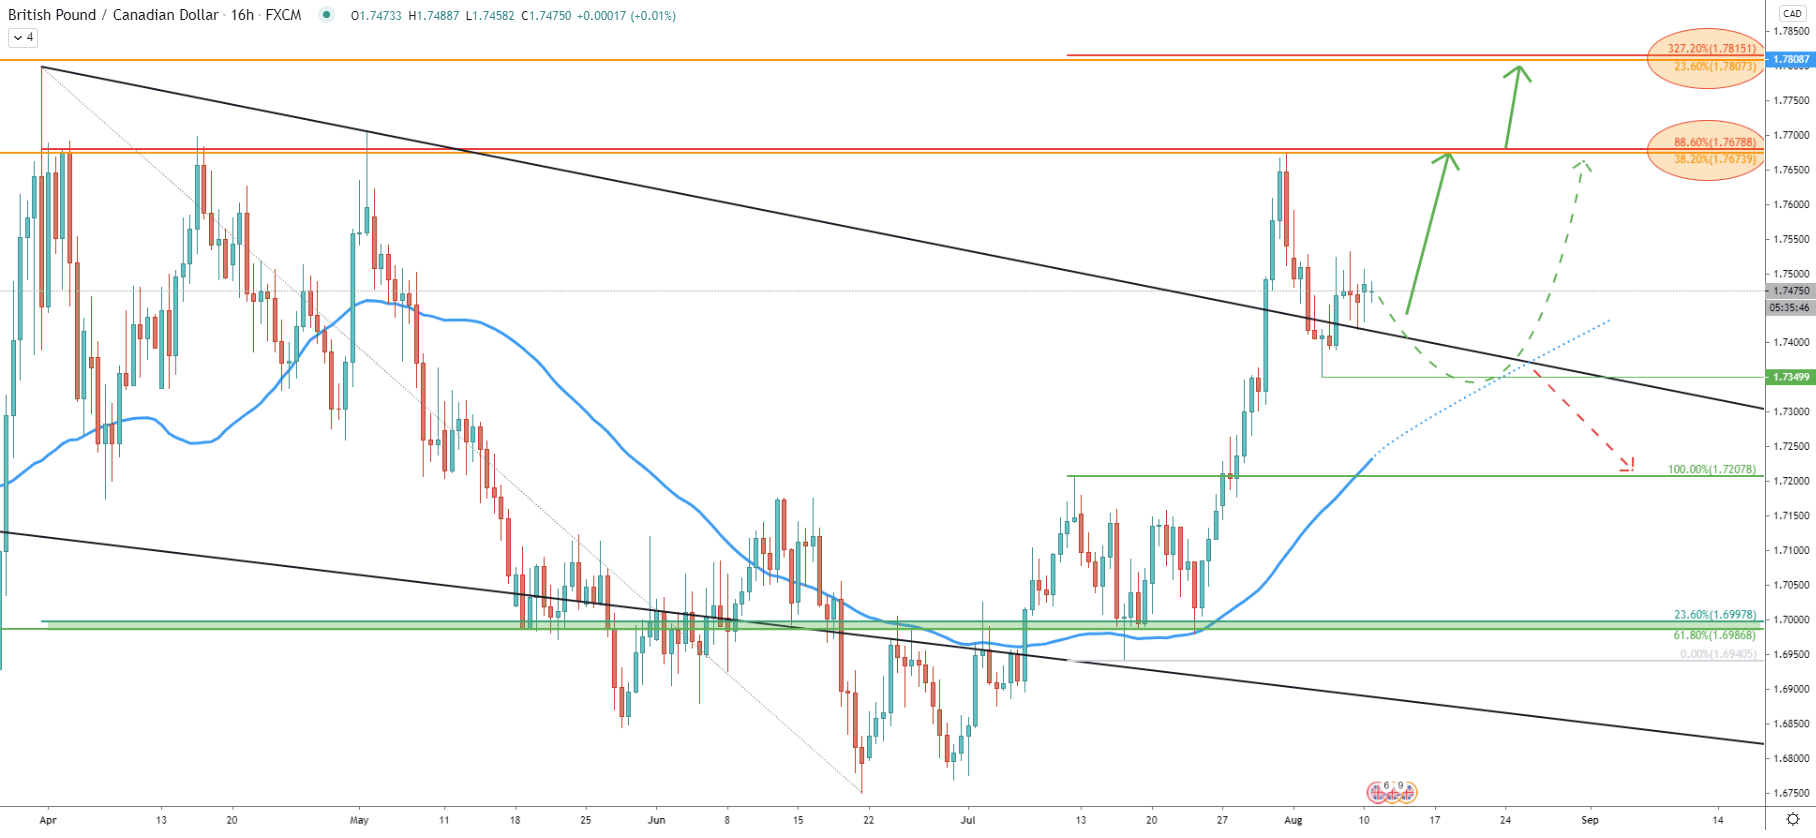
On this chart, the Fibonacci retracement indicator was applied to the corrective wave down after price broke above the 1.7000 psychological resistance as well as 50 Exponential Moving Average. It shows taht 327.2% Fibs corresponds to the 1.7800 level and 23.6% Fibs as per the Weekly chart. But prior to that, there is 1.7673 resistance, which at this cart corresponds to the 88.6% Fibs applied to the March 31 - June 19 corrective move down.
Therefore, there are two major upside target areas, first being near the 1.7675 and second near the 1.7800. Although, considering the fact that price has already rejected 1.7673 level, there is a risk of a trend reversal to the downside. But for this scenario price must break and close below the recent low at 1.7350.
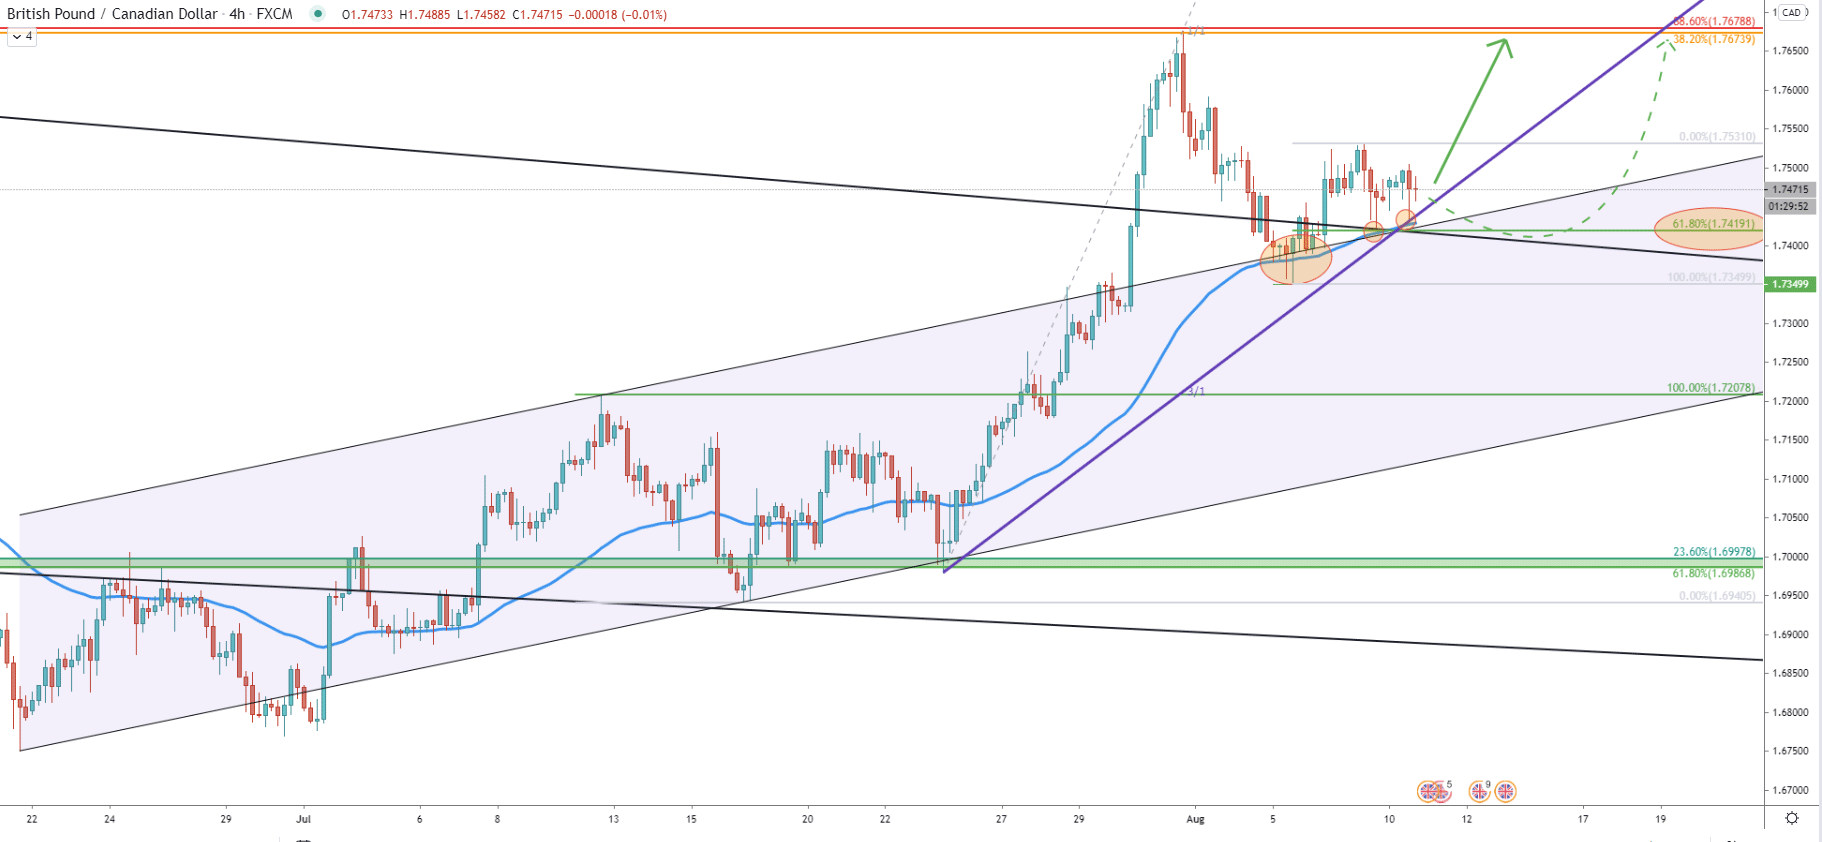
On the 4-hour chart price broke above the ascending channel, suggesting a strong bullish trend. The correction down followed and GBP/CAD has been rejecting the upper trendline of the channel on multiple occasions. Along with it, 50 SMA was rejected several times, price cleanly bounced off the 3/1 Gann Fan trendline as well as 61.8% Fibonacci retracement level at 1.7419.
It is more than obvious that bulls continue to defend the 1.7350 support area, and as long as the price remains above, the uptrend continuation is imminent. Based on Fibs and the Gann Fan trendline crossing, the First resistance could be reached as soon as August 19, and prior to that consolidation can take place.
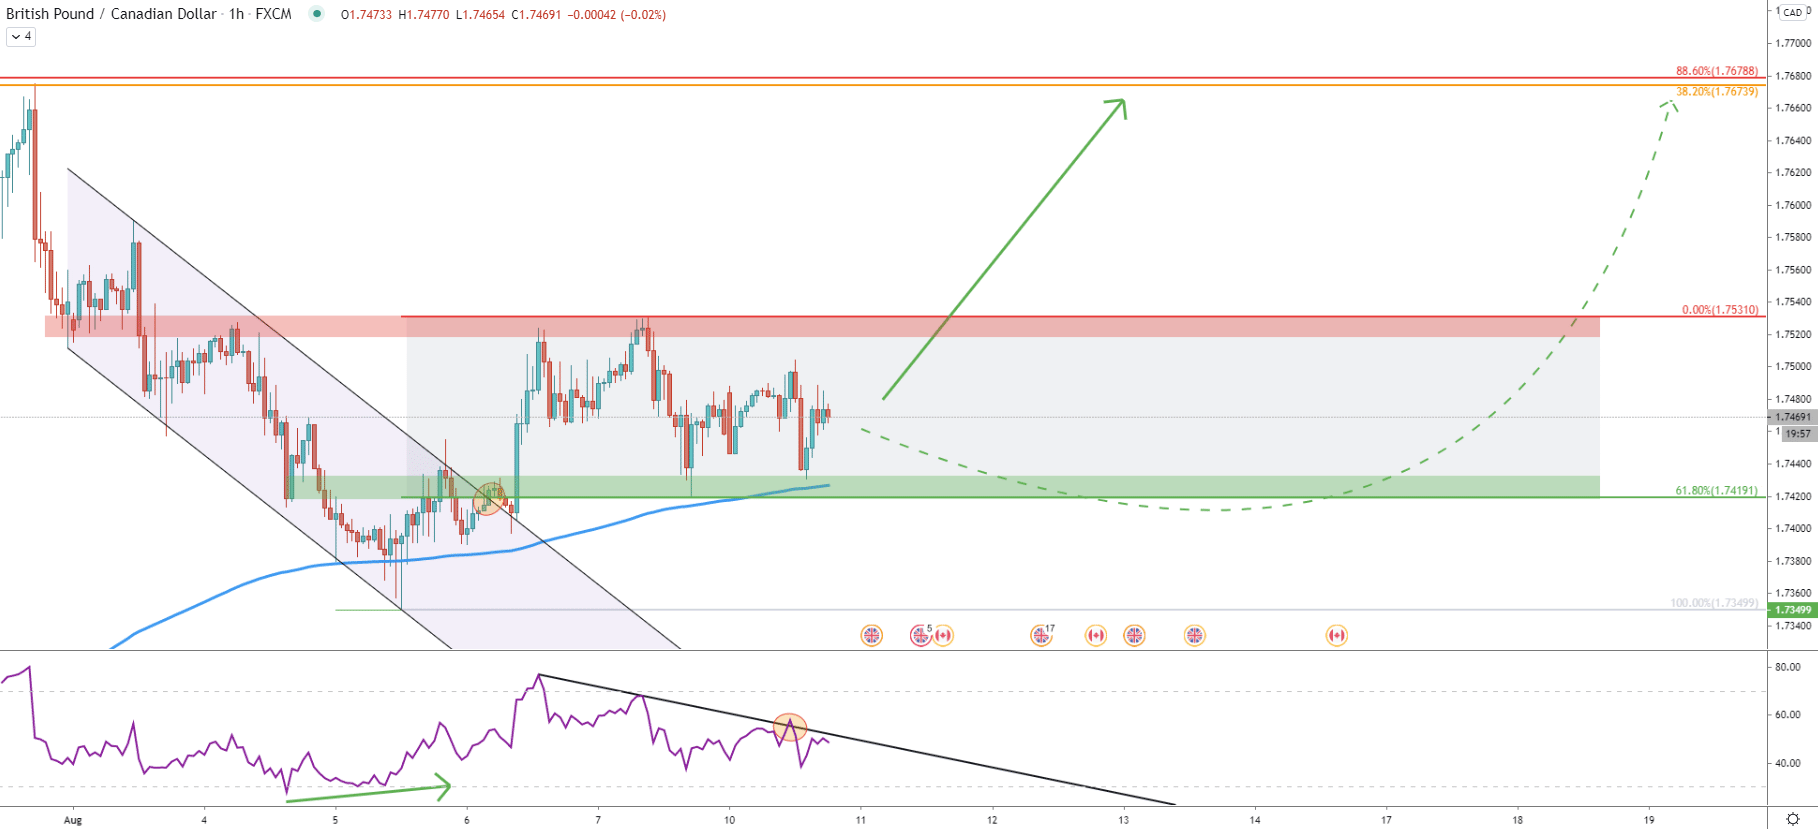
Speaking of the consolidation phase. The support has been formed near 1.7419, which is the 61.8% Fibonacci retracement level corresponding to the descending channel breakout point. The resistance is formed at 1.7530, which based on the previous price action was a strong supply/demand zone.
In any case, considering the formation of the bullish divergence on the RSI oscillator as well as the downtrend trendline breakout and the channel breakout, the probability is in favor of an uptrend. Clearly there is a high possibility that GBP/CAD will be producing spikes below the 1.7419 support, although only daily break and close could increase the risk of further price decline.
GBP/CAD rejected multiple Fibonacci support levels and trendlines, strongly suggesting a very bullish trend. Nevertheless, before/if the price will continue rising, the sideways move can take place. But all-in-all, there is a strong probability that pair will increase by another 400 pips in the coming weeks.
As per the 16-hour chart, there are only two strong resistance levels that could be tested within a couple of weeks. These are 1.7673 and 1.7800. Obviously the 1.7800 is a lot more attractive considering it is a strong psychological level.
As per the 16-hour chart, the support is seen at 1.7350. Daily break and close below this level can invalidate a strongly bullish outlook and pair might be starting to produce lower lows. Eventually, in the long run, 1.7200 support could be reached.
Support: 1.7419, 1.7350
Resistance: 1.7673, 1.7800