
Published: July 24th, 2020
Yesterday we have shared the analysis on the GBP/NZD and today we will analyze GBP/CAD. Both of them have two things in common; the expected uptrend and the presence of the Great British Pound in the pair. This suggests the strength of the GBP across the board, potentially on multiple pairs. So let’s dive into analysis on the GBP/CAD to see the probability of the upside potential.
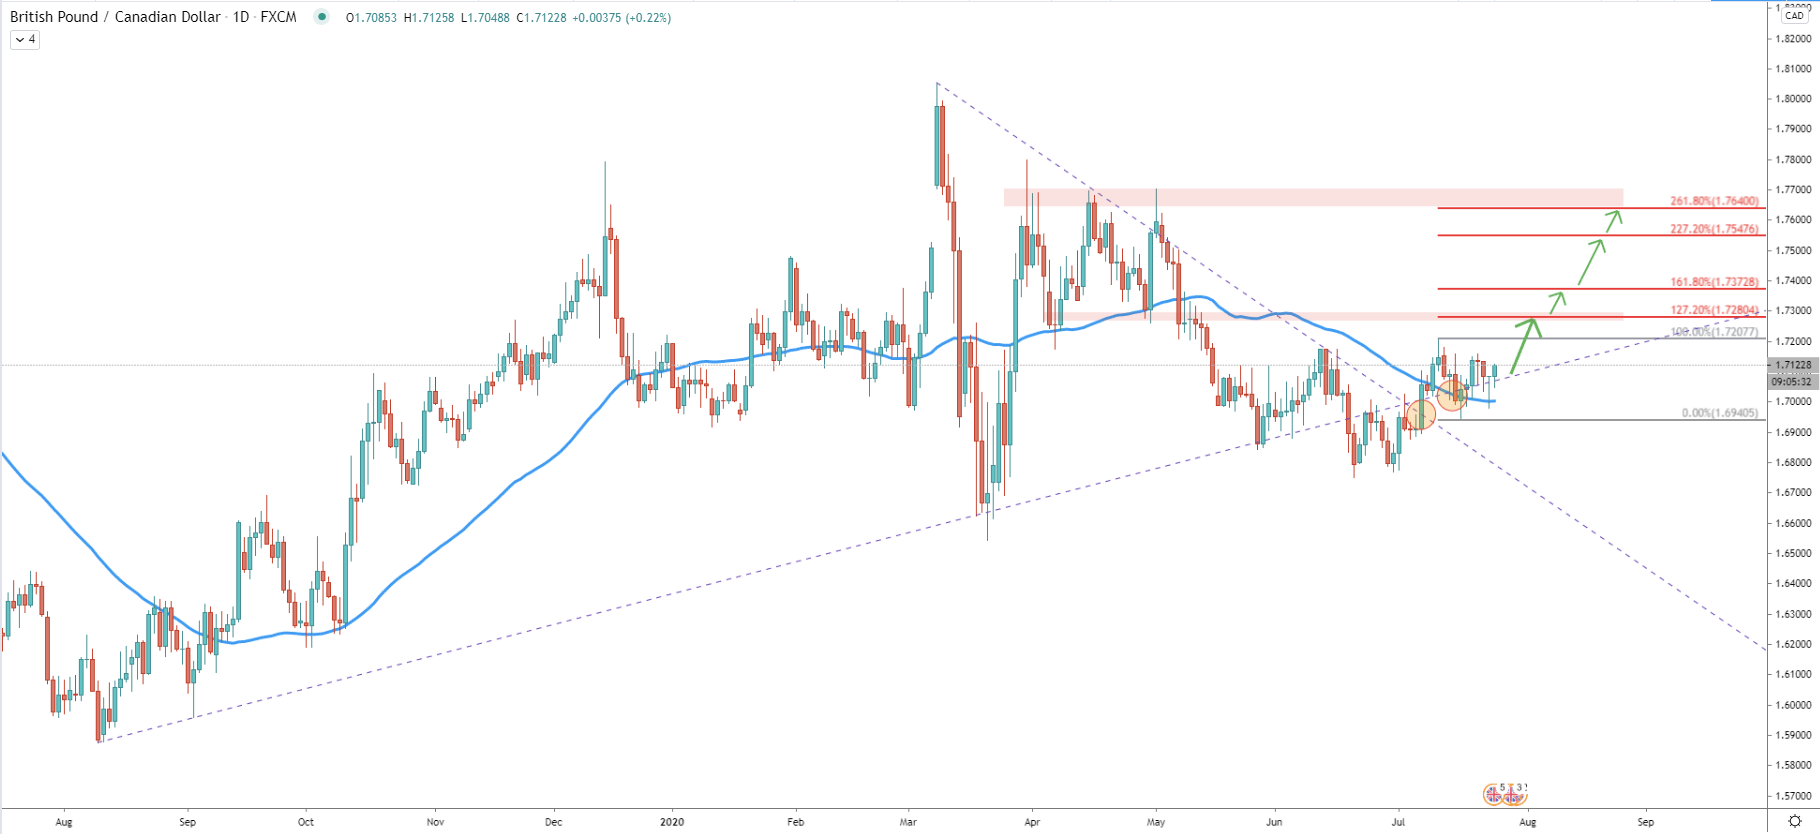
The daily chart shows a valid uptrend since the price still printing higher highs and higher lows. The recent correction has resulted in the price decline towards the 1.6750 level, which was 85-days low. During the decline, GBP/CAD broke below the long-term uptrend, although price recovered quite fast and the recent price action shows that the uptrend is being rejected.
GBP/CAD broke above the downtrend trendline and on the small pullback found the support on the 50 Exponential Moving Average which was rejected along with the uptrend trendline. It certainly looks like GBP/CAD is forming an inverted Head and Shoulders pattern, although it is not confirmed yet.
Fibonacci retracement indicator was applied to the current correction after breaking above the EMA. We could use multiple levels from this Fibs to spot potential resistance if the price will continue to rise. The nearest resistance is seen at 1.7280 which is 127.2% Fibs. This level also corresponds to the previous support area and could play a key role in further price development. Daily break and close above 1.7280 might invite more buyers and push the price as high as 1.7640, which is 261.8% Fibs corresponding to the previously formed area of resistance.
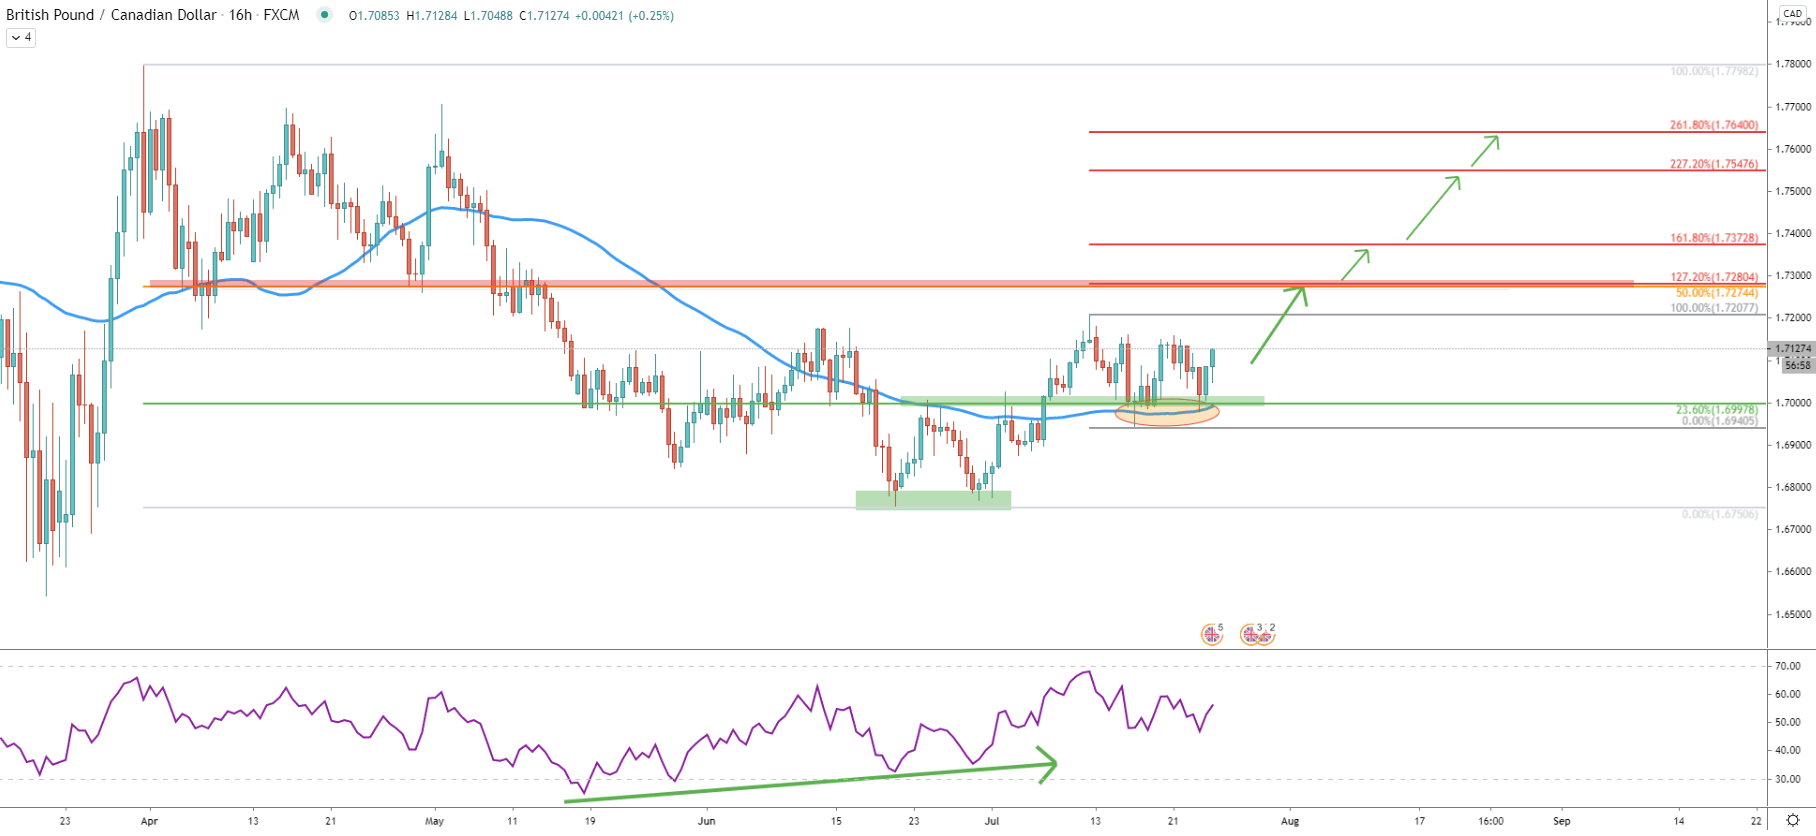
On the 16-hour chart, the price has formed a double bottom near 1.6750 support area and the RSI oscillator has shown a bullish divergence. Following this price action, GBP/CAD went up and broke above the previous resistance area near 1.6997. Right now that resistance has become the support which is also confirmed by 23.6% Fibonacci applied to the March 31 - June 19 downtrend.
All-in-all, GBP/CAD found strong support near 1.7000 psychological level, confirmed by Fibonacci as well as 200 Exponential Moving Average. The double bottom was formed at this support which could have been the strong indication of an incoming uptrend. Previously mentioned key resistance at 1.7280 also corresponds to the 50% Fibs, which suggest another 150 pip growth for GBP/CAD in the coming trading week.
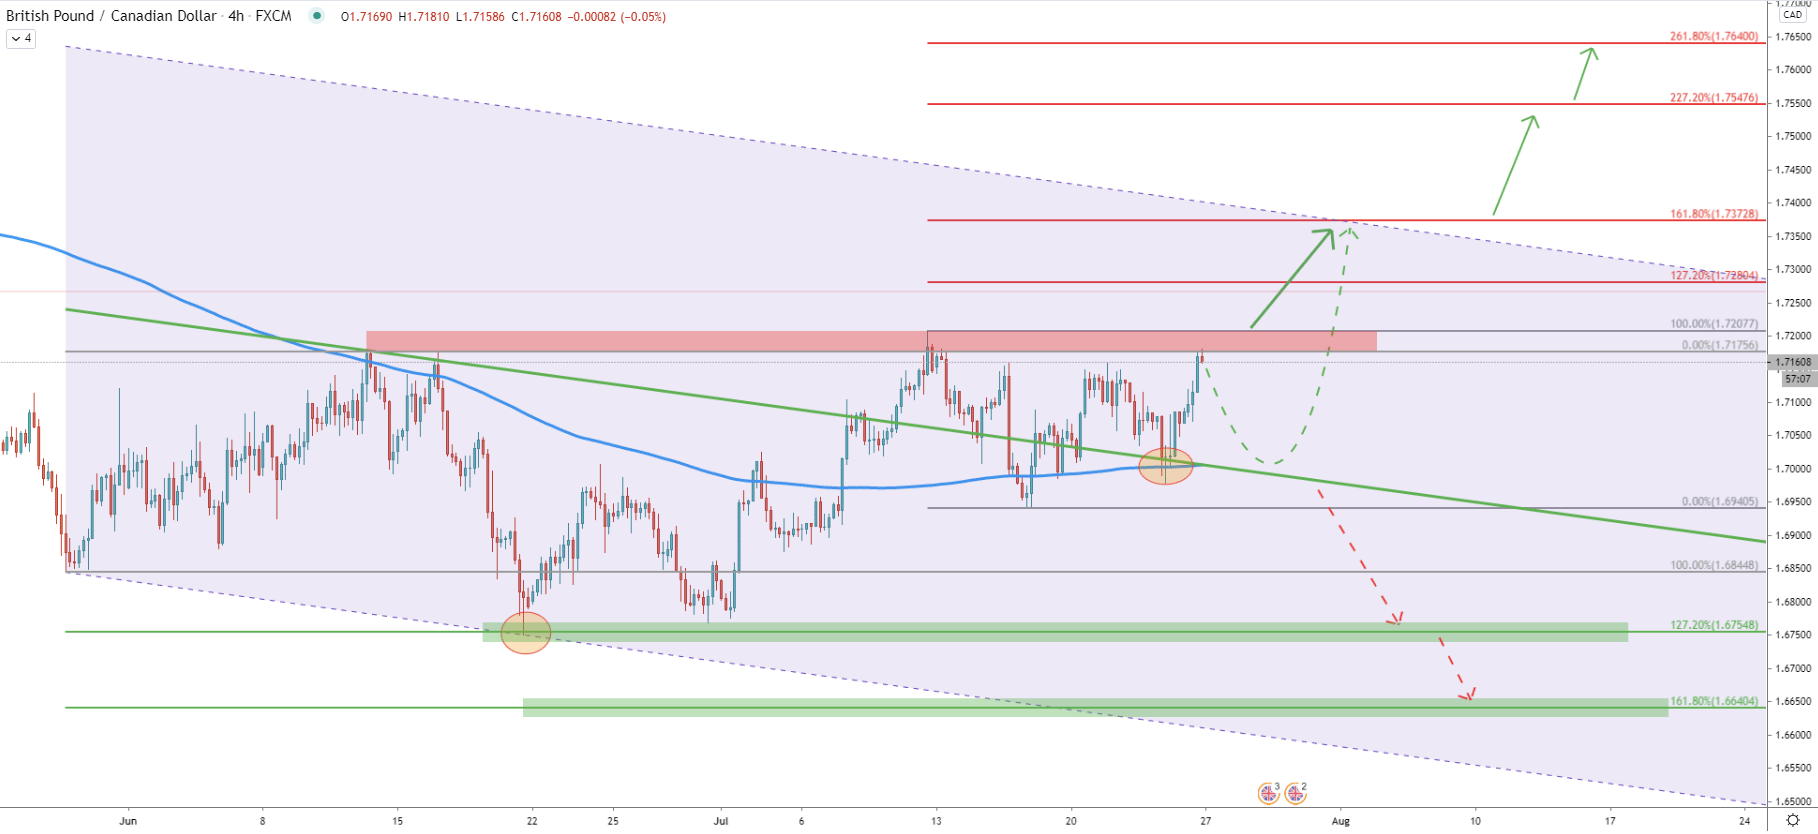
On the 4-hour chart, the price has reached and rejected the 127.2% Fibonacci support level at 1.6754, which occurred on June 19. Then, after the formation of the double bottom price went up and broke above the descending channel. On July 23, the upper trendline of the channel along with the 200 EMA was acted as the support, which was rejected. Perhaps it was a perfect buying opportunity for the short term buyers.
On the other hand, considering that price has reached the resistance area, a pullback can be expected. GBP/CAD could once again re-test 1.7000 support area, which will be yet another buying opportunity with a good risk/reward ratio.
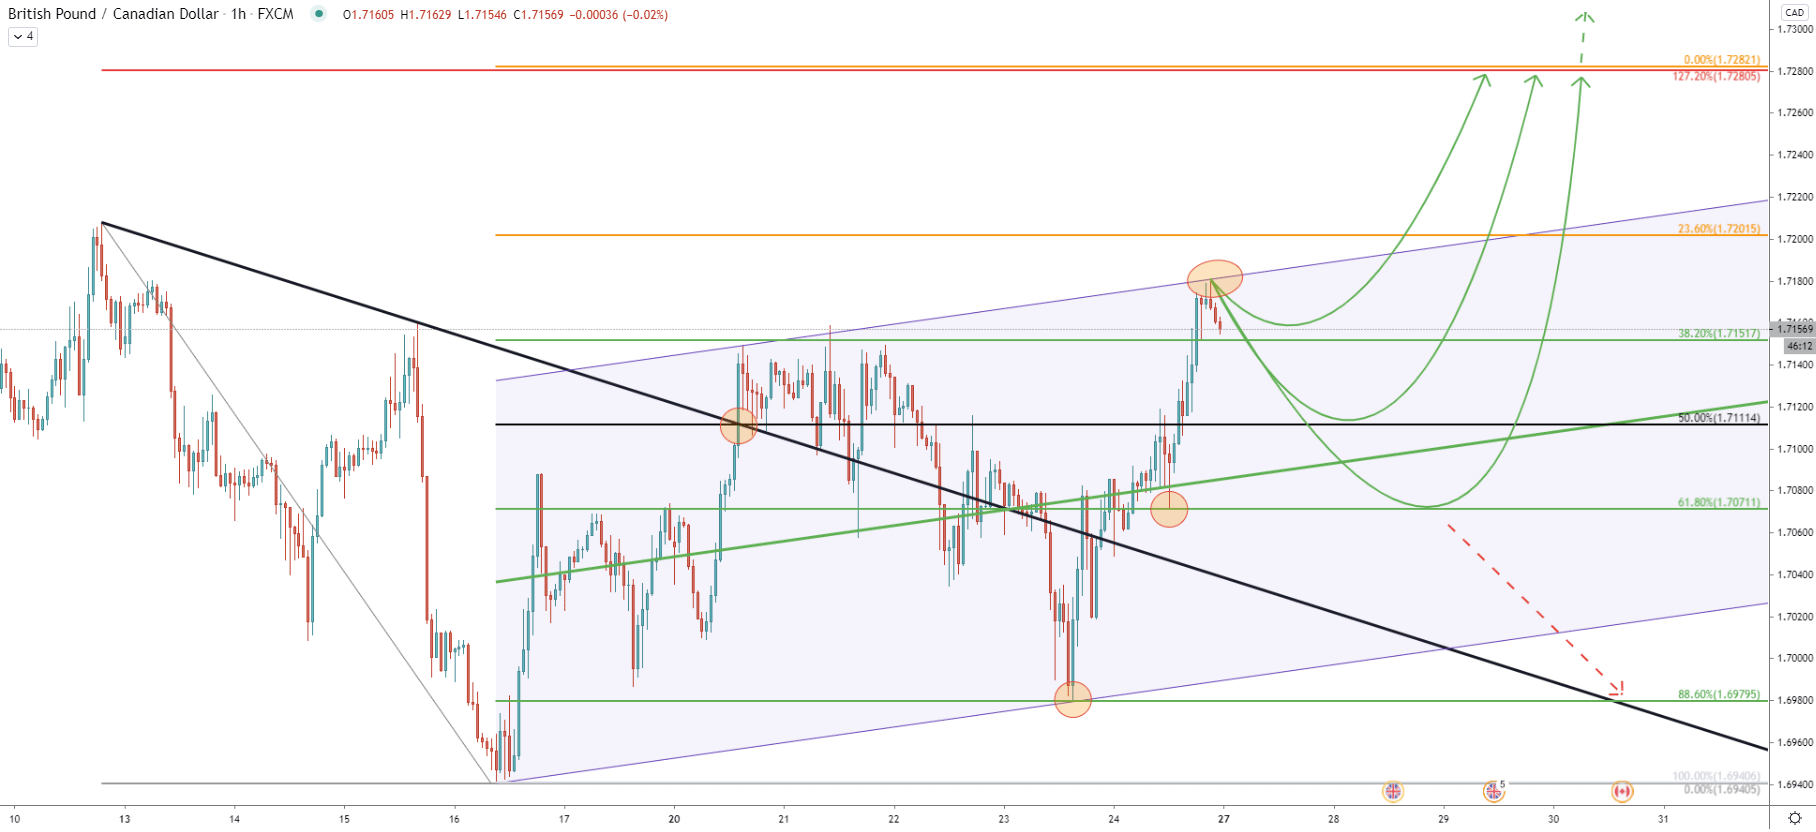
On the hourly chart, we have applied the Fibonacci retracement indicator to the breakout point of the downtrend trendline. Fibs were applied so that the 50% retracement level is placed right at the point of the break. We can see that 88.6% Fibs at 1.6979 was rejected cleanly, followed by a clean bounce off the 61.8% retracement level at 1.7071.
GBP/CAD has approached and rejected the upper trendline of the ascending channel, which might provide a short term selling pressure for the pair. This means that the correction to the downside can be expected at the beginning of the next week. There are 3 support levels to watch for a bounce, with the first being 38.2% Fibs at 1.7150. If the price will break below, the next support at 1.7111 can be tested. And the final support is sen at 1.7070, where the price could also retrace before/if uptrend will continue.
The final point worth mentioning is that 0% Fibonacci level cleanly corresponds to the previously mentioned key resistance near 1.7280 area.
The overall GBP strength should push GBP/CAD pair up. This could be either a beginning of a long term uptrend continuation of at the very least a correctional move up. But on the other hand, pair is facing a strong resistance right now, which most likely will result in some sort of a correctional move down.
As per the 16-hour and 1-hour chart, the strongest resistance is located at 1.7280 which is confirmed by 3 different Fibonacci retracement levels. However, if GBP/CAD will manage to penetrate this level with confidence, the price might reach any of the Fibonacci resistance levels pointed on the 4-hour chart. These are 1.7372, 1.7547, or 1.7640
The downtrend might become valid only upon the daily break and close below 1.7000 physiological support.
Support: 1.7151, 1.7111, 1.7071, 1.6979
Resistance: 1.7280, 1.7372, 1.7547, 1.7640