
Published: October 8th, 2020
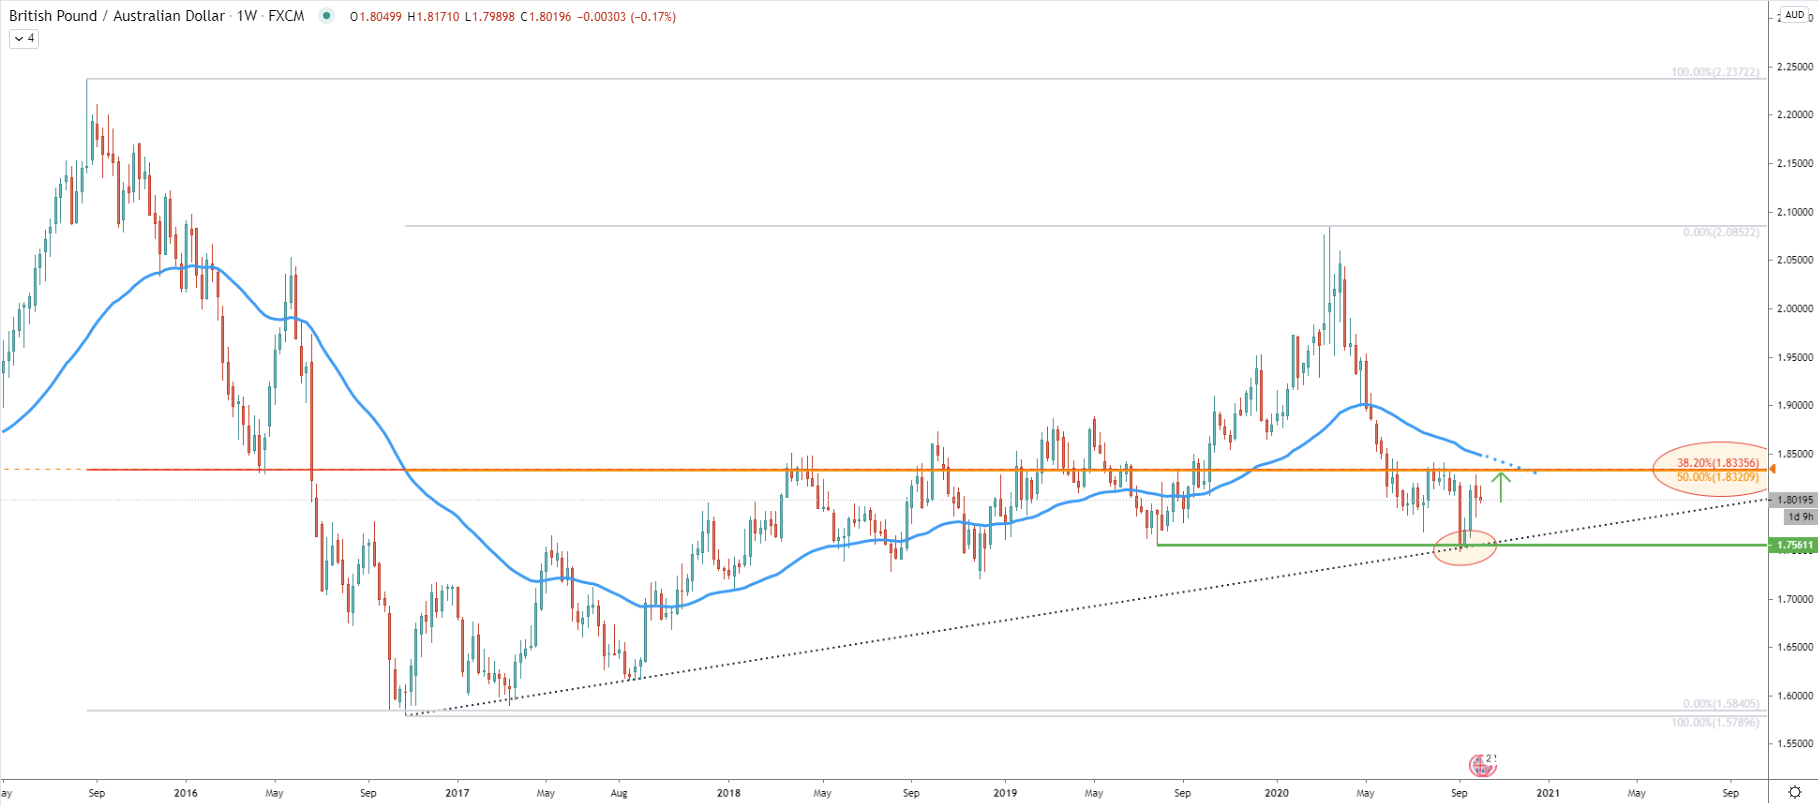
On the weekly timeframe, the GBP/AUD trend remains bullish, while higher highs and higher lows pattern validating the uptrend. A month ago, the pair has rejected the simple uptrend trendline while forming a double bottom near 1.7560 support. Previously, GBP/AUD already established a low at this price, back in June 2019. Therefore, the long term support has been respected, which might imply further long-term growth.
The nearest and perhaps the key resistance is located near 1.8340 area, which is confirmed by two Fibonacci retracement levels. Frist is the 38.2% Fibs applied to the 2015 - 2017 lown term downtrend. And the second is the 50% Fibs applied to the last wave to the upside, where price topped out at 2.0852. Besides, this resistance area also goes in line with the 50 Exponential Moving Average, which might be re-tested in the days or weeks to come.
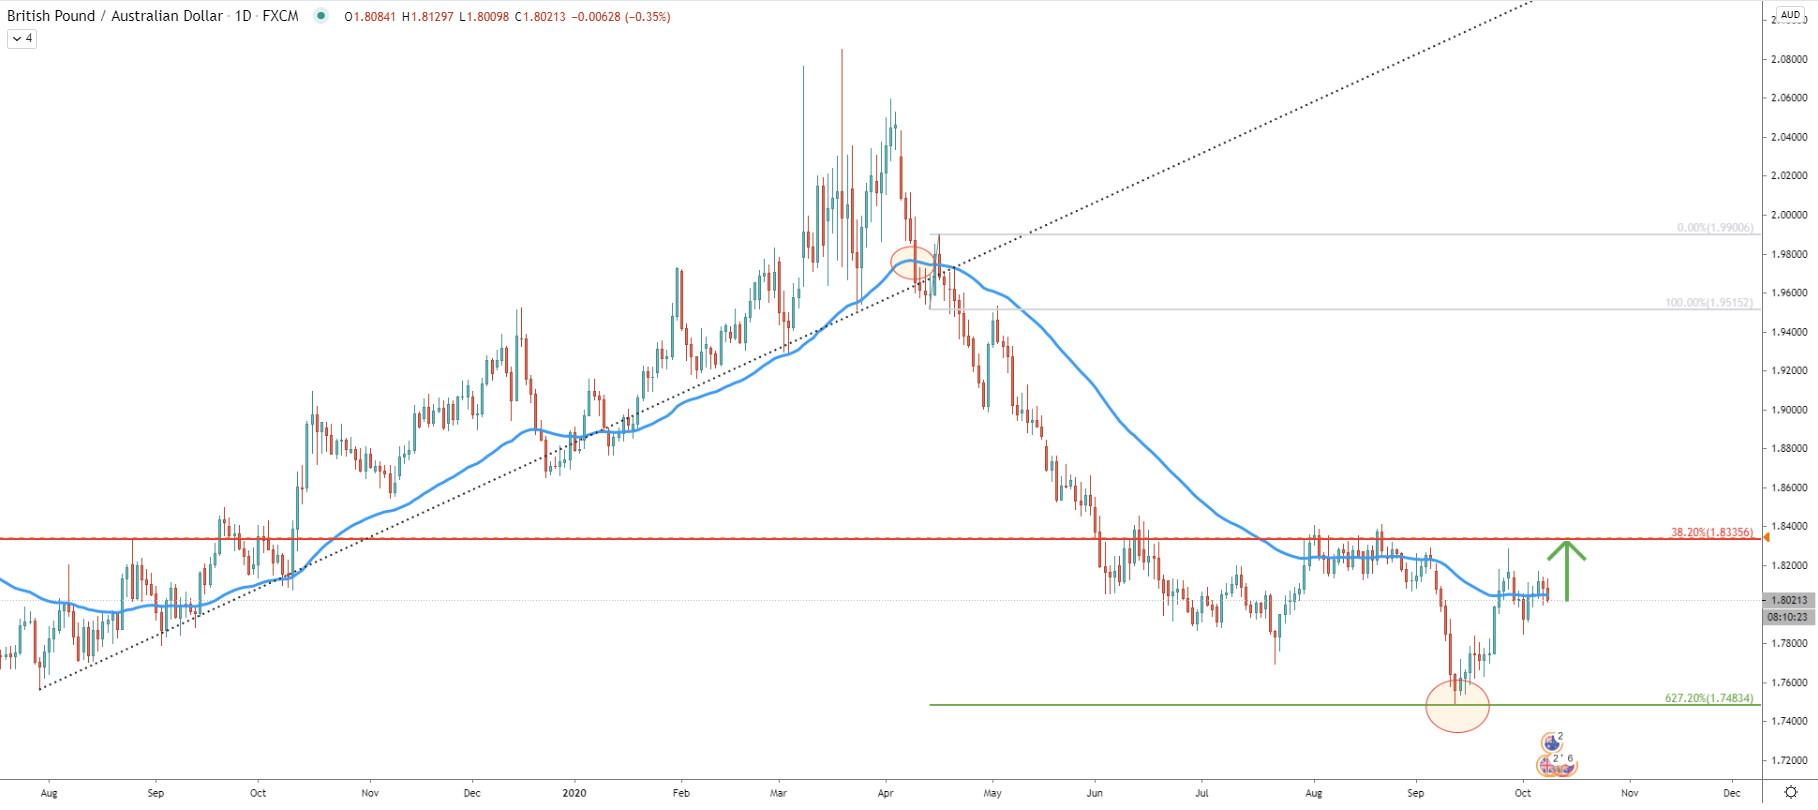
In September GBP/AUD bottomed out while testing 1.7483 low. This price corresponded exactly to the 627.2% Fibonacci retracement level applied to the corrective wave up after price broke below the uptrend trendline as well as 50 Exponential Moving Average. While the Fibonacci support level has been rejected precisely, this could mean that trend could have reversed to the upside. Currently, GBP/AUD has rejected the 50 EMA, which is acting as the support, and as long as daily closing prices remain above 1.7996, which is yesterday’s low, the trend should remain bullish, in the short to medium and potentially even long term.
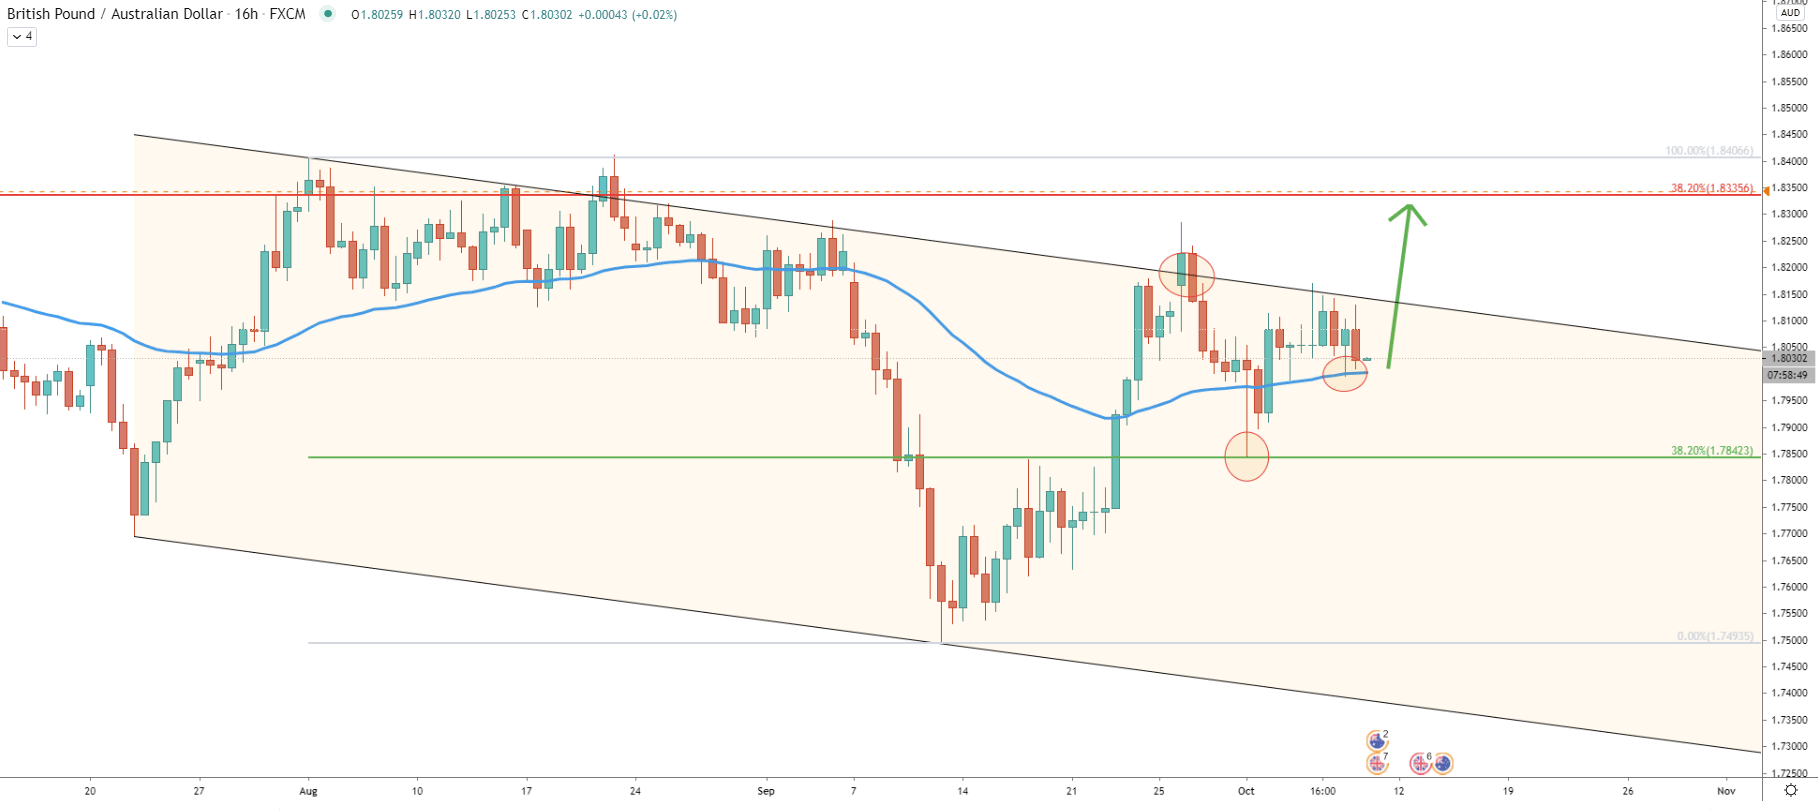
At the end of October, GBP/AUD broke above the upper trendline of the descending channel suggesting strong buying pressure, but then the price has corrected down. The corrective downside move was stopped by 38.2% Fibs at 1.7842, which was rejected precisely, along with the 50 Exponential Moving Average. Yesterday, the pair has rejected cleanly the 50 EMA for the second time, and this might result at the beginning of the uptrend. Obviously, this scenario is expected as long as 1.7842 support holds.
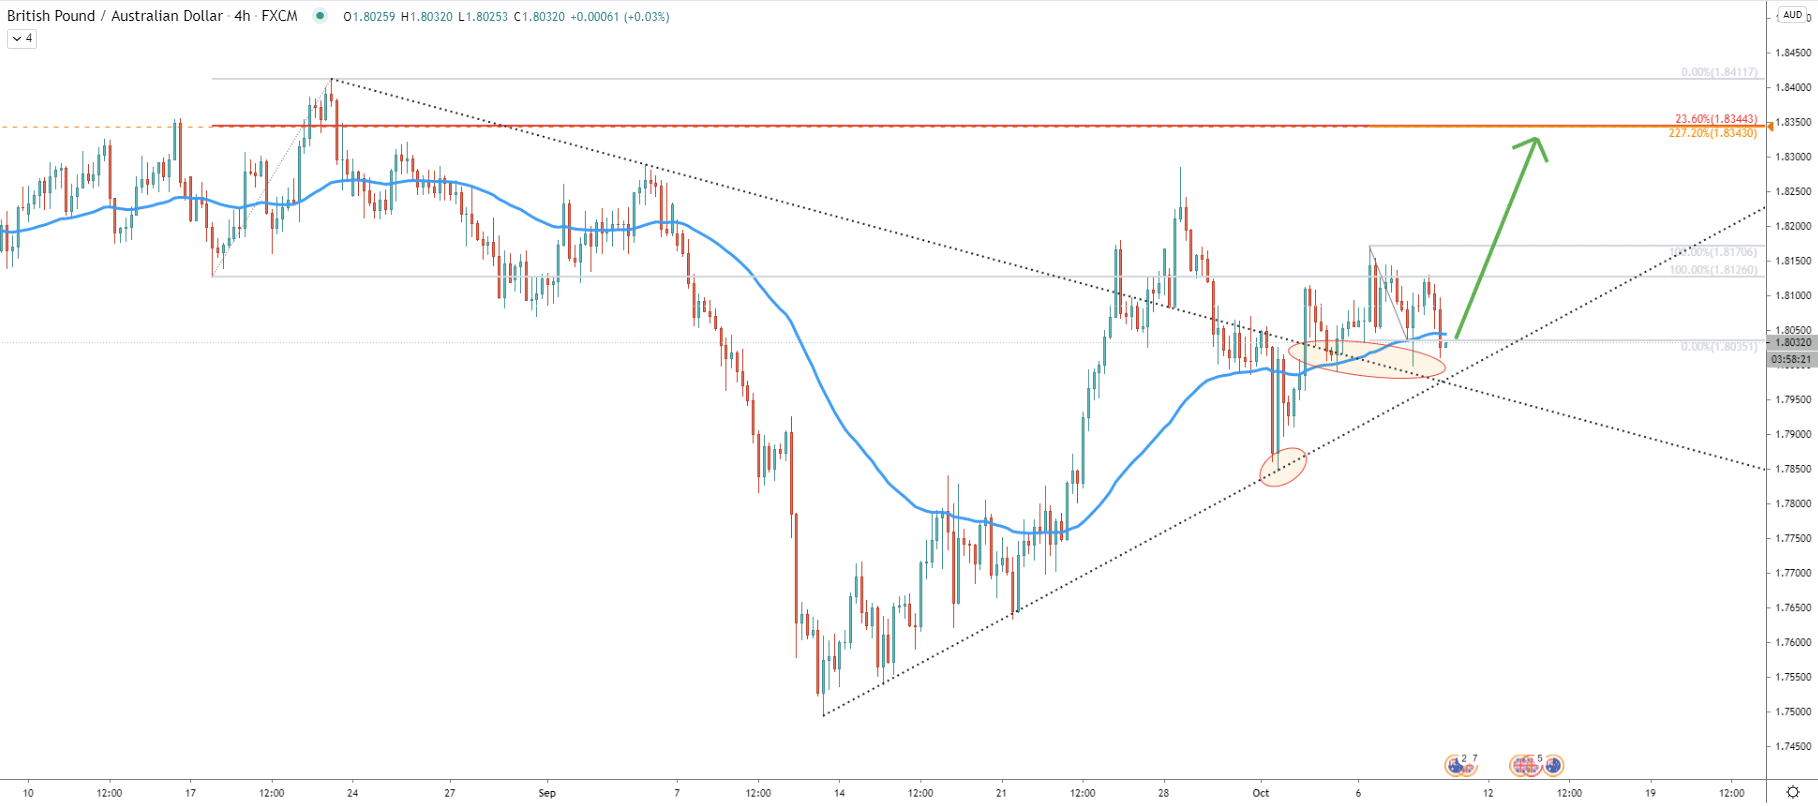
On the 4-hour chart, price rejected the uptrend trendline while broke above the downtrend trendline. The probability is certainly in favor of an uptrend continuation because 50 EMA was also rejected on 4h and other timeframes. Two Fibonacci retracement indicators were used on this chart to spot the potential resistance. First is the Fibs applied o the last wave up, where price found the top in September. The second is the Fibs applied to the current corrective wave down, where 50 EMA was rejected cleanly. It can be seen that 23.6% Fibs and 227.2% Fibs are located at 1.8343 making it a potential strong supply zone.
Based on the previous analysis, where the key resistance area was near 1.8335, the conclusion can be made that 1.8330 - 1.8350 could be the profit-taking area if the uptrend will take place.
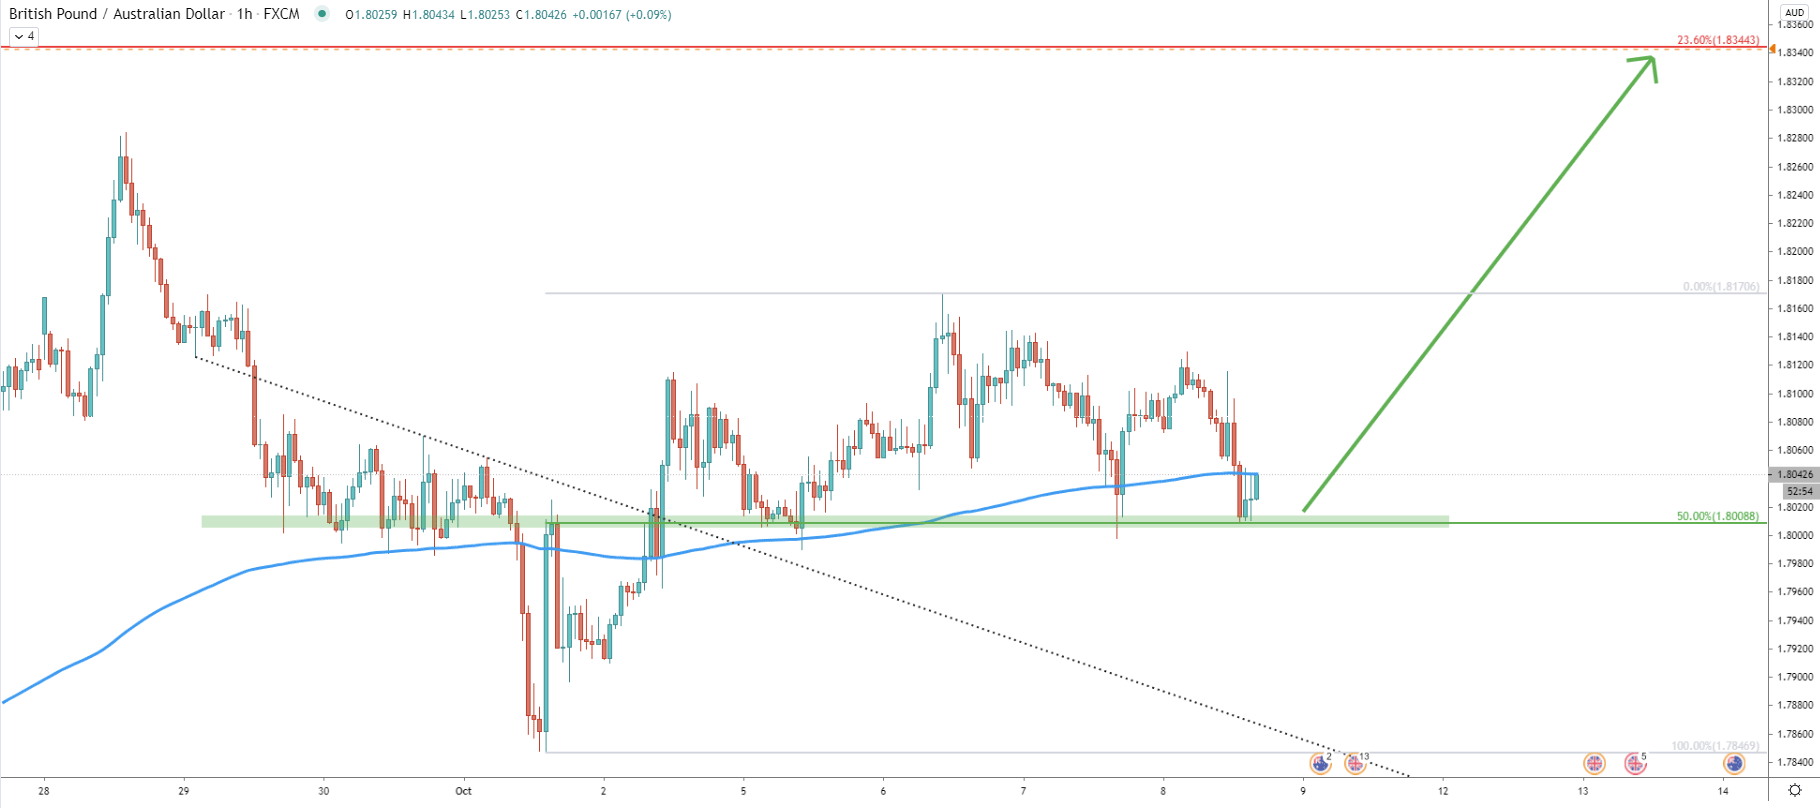
The support has been formed near 1.8000, which is a strong psychological level corresponding to the 50% Fibonacci retracement level as well as the breakout point of the average-price downtrend trendline. Today this support level has been rejected cleanly and the price could be starting to move up from this point onwards.
GBP/AUD keeps on rejecting the Moving Average indicator on multiple timeframes, suggesting the incoming move to the upside. The long-term trend also remains bullish and the key resistance is 250 pips away from the current price. If/when it will get broken, the uptrend is likely to be confirmed once again.
As per the weekly and 4-hour charts, the key resistance area is located between 1.8320-1.8345. This resistance area is confirmed by 4 different Fibonacci retracement levels and corresponds to the Moving Average resistance as per the weekly chart.
As per the 16-hour chart, it can be seen that the key support is located at 1.7842. Obviously, a daily break and close below this support level will invalidate the bullish forecast and might result in a strong downtrend.
Support: 1.8000, 1.7842, 1.7483
Resistance: 1.8100, 1.8170, 1.8320