
Published: March 10th, 2021
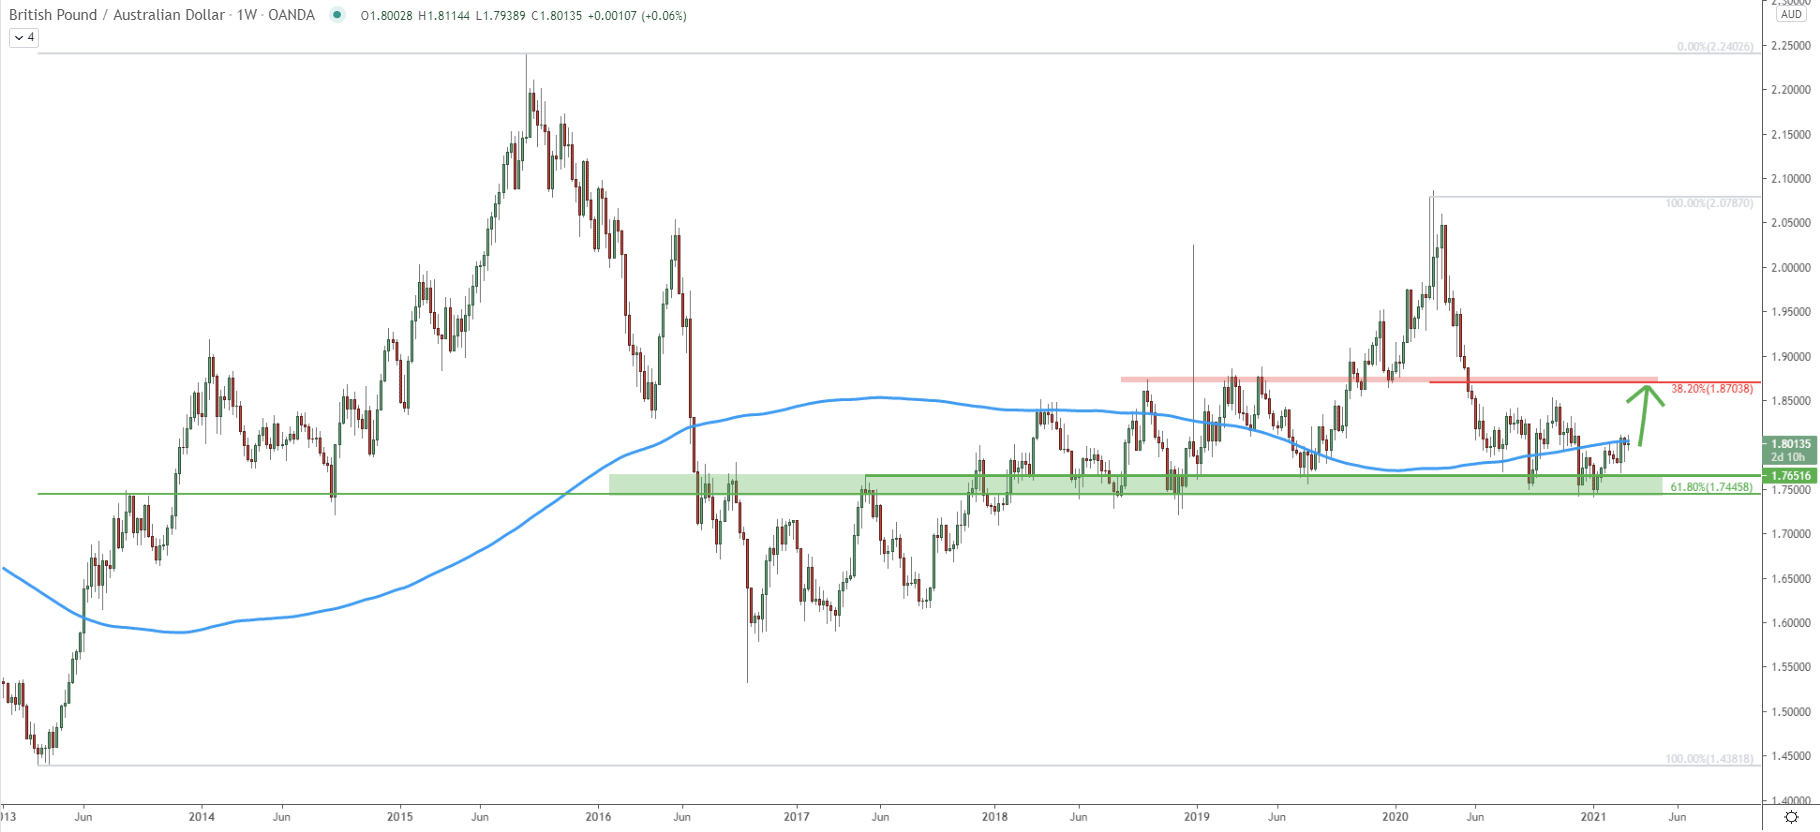
The weekly chart, as usual, shows the big picture. And it is very clear that the key support area is located between 1.7445 and 1.7650. At the end of 2021 and beginning for 2021, GBP/AUD has entered this demand zone and failed to break lower. In fact, the price bounced off, after which it broke above the 200 Simple Moving Average. This goes to show, that bulls are still in control, which might result in a price increase towards the key resistance area.
The resistance area is also clearly visible and located near 1.8700, which is a strong psychological level. Previously, this area already acted as the strong resistance as well as the support, making it a potentially strong supply zone. Besides, it also corresponds to the 38.2% Fibonacci retracement level, applied to the overall downtrend which took place throughout 2020. All-in-all, current price action favors an upside move, which is likely to result in a 700 pip growth over the coming weeks.
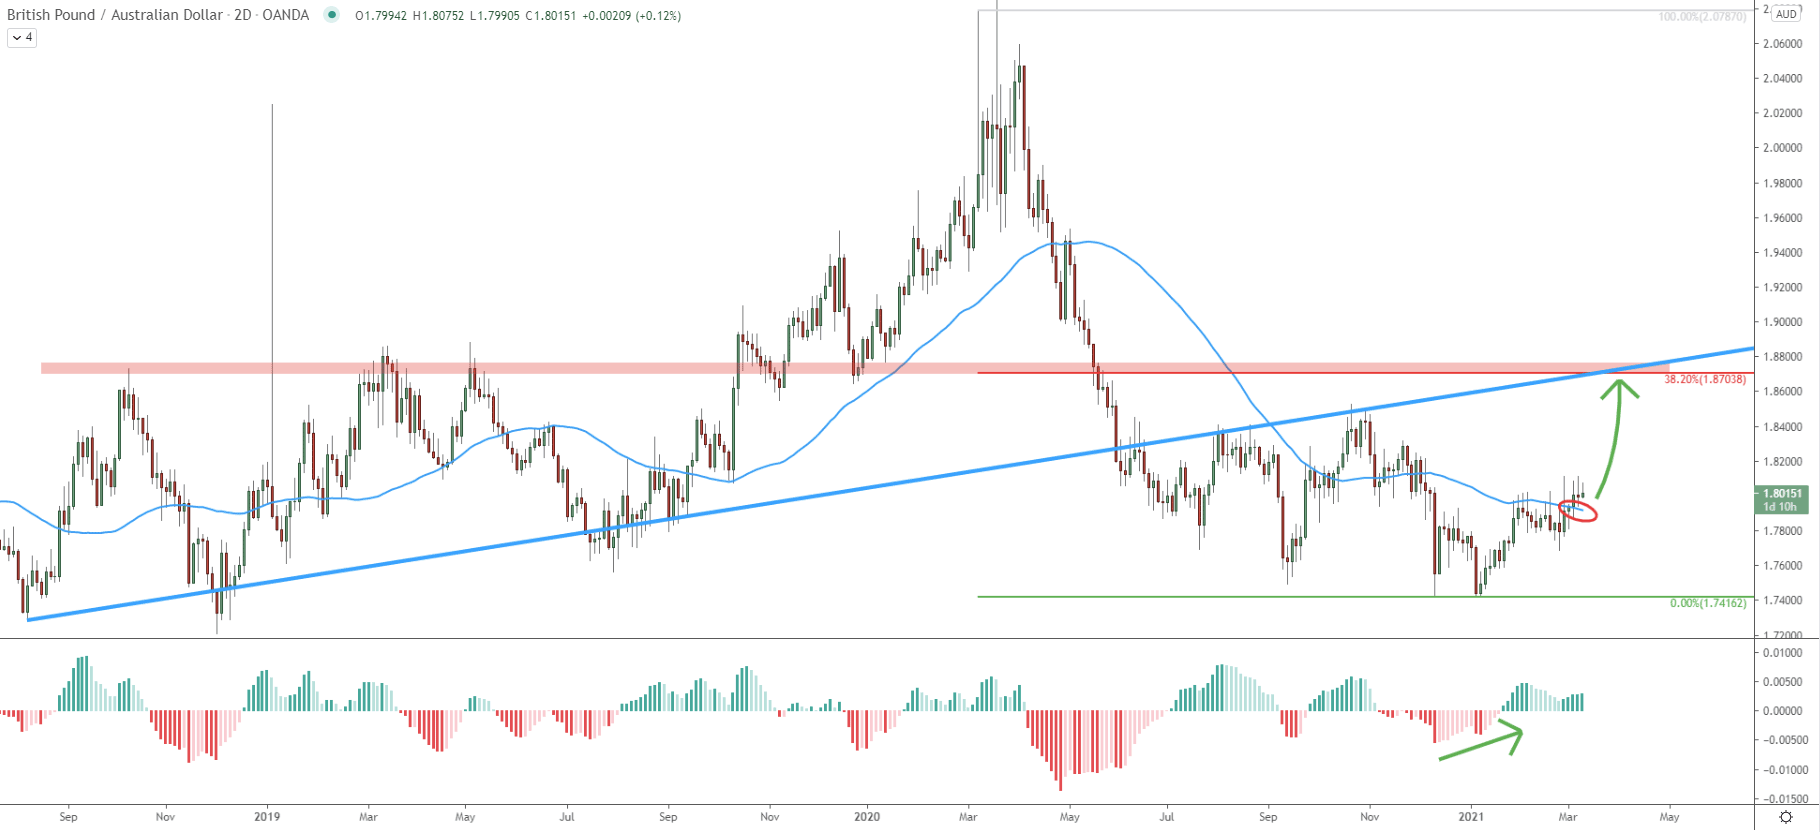
When GBP/AUD produced a double bottom at 1.7416 at the beginning of the year, the MACD oscillator formed a bullish divergence, suggesting a trend reversal to the upside. Since then the price has been slowly rising and the most recent price action shows, that pair managed to break above the 50 SMA on the 2-day chart. This could have been yet another bullish confirmation. Considering that price has been consolidating near 1.8000 phycological level for nearly two weeks, the uptrend could be starting any moment, even from this point onwards or sometimes this week.
Based on the uptrend trendline crossing with the 38.2% Fibs at 1.8700, the uptrend is expected to be fast. The 700 pip rise could be completed within several weeks, before the end of this month.
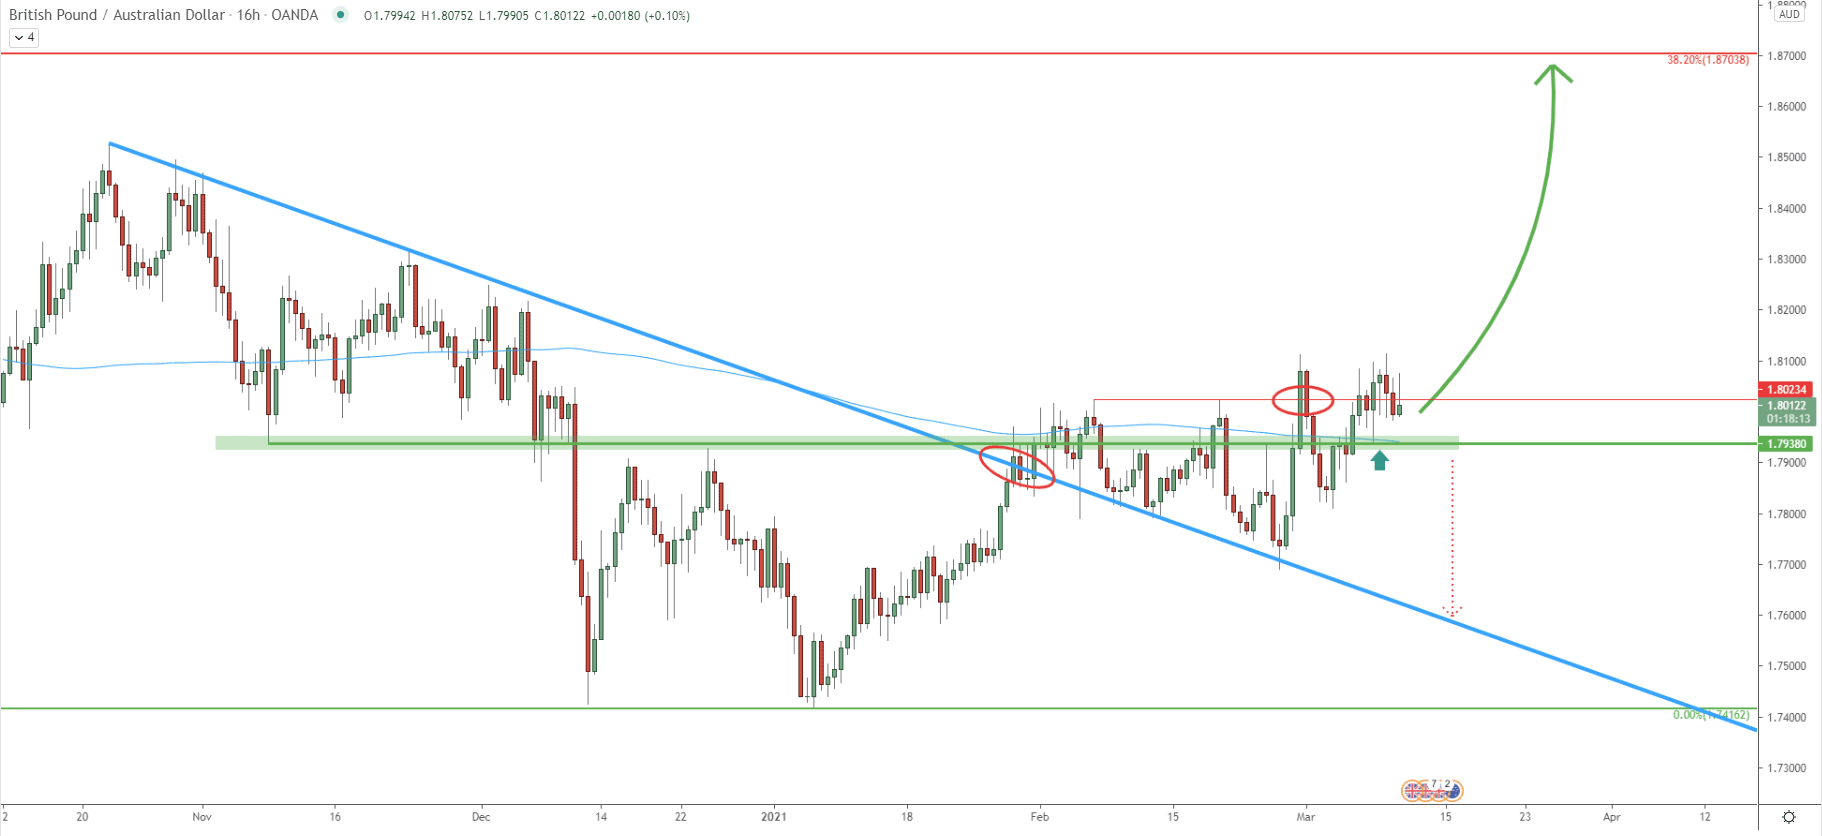
On the 16-hour GBP/AUD broke above the simple downtrend trendline, although straight afterwards it bounced off the 200 EMA as well as the strong resistance. The resistance is based on the previously supply/demand area and located near 1.7938. Therefore, the supply area between 1.7938 and 1.8023 has been respected throughout the entire month of February. Although at the beginning of March, GBP/AUD broke above 1.8023 resistance, with the daily close above. And again, this is a bullish confirmation, which can and should result in increasing upside momentum.
After breaking above the resistance, GBP/AUD pulled back and cleanly rejected the 1.7938 support along with the 200 EMA. This makes 1.7938 a very important demand area and as long as the daily closing price remains above, bulls will have complete control over the price of GBP/AUD/
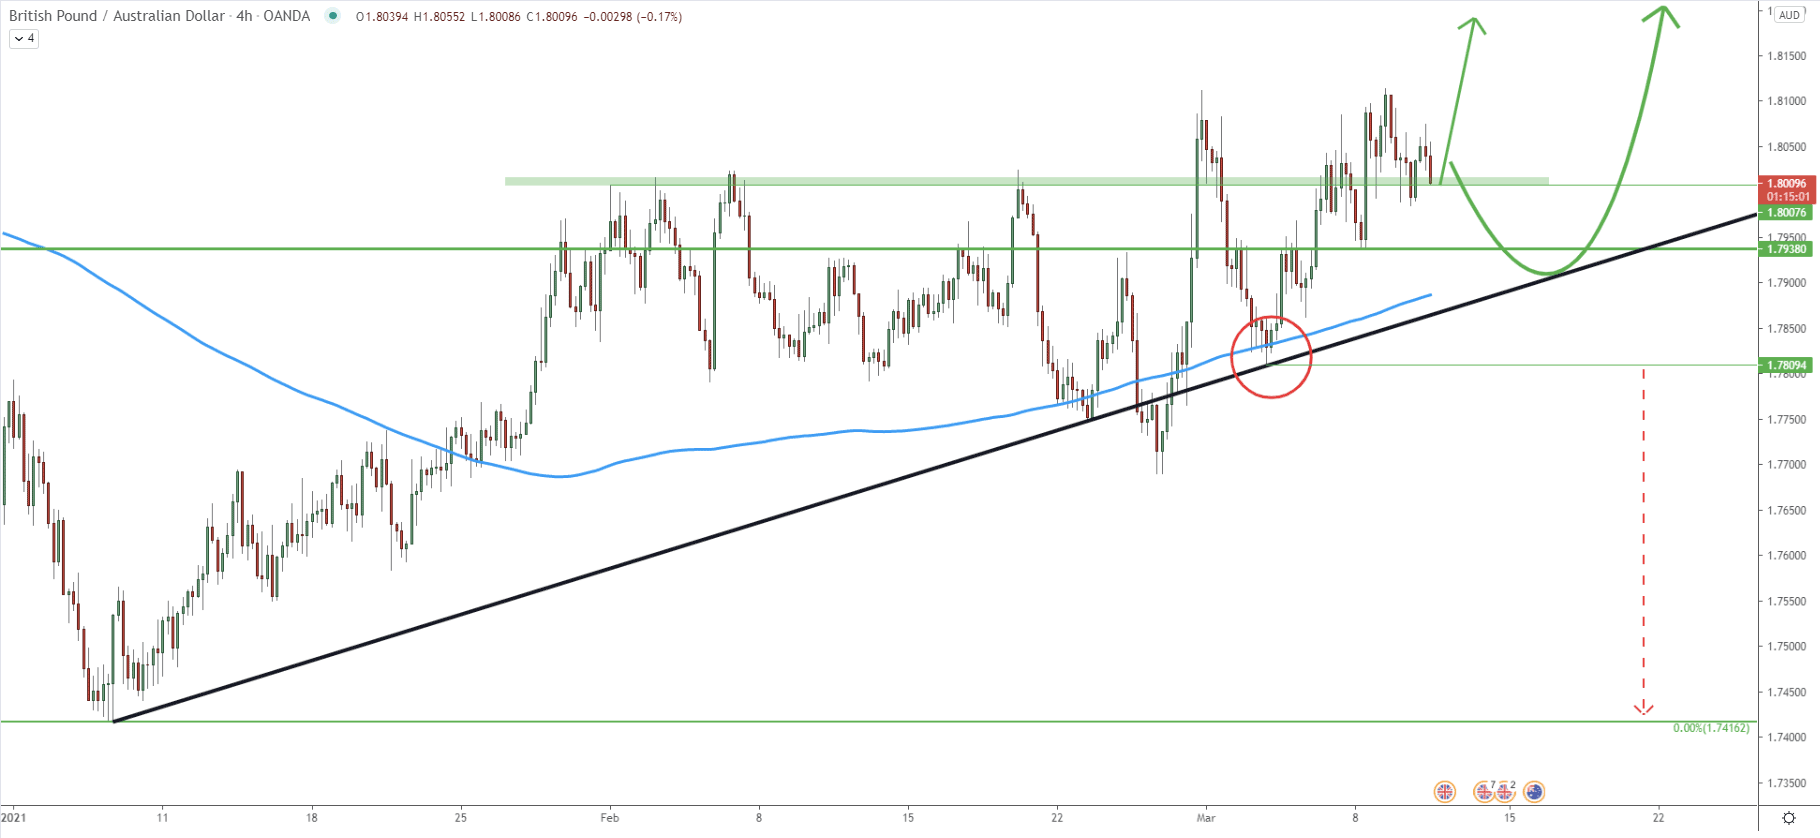
Recently price has bounced off the simple uptrend trendline along with the 200 Simple Moving Average. This has occurred when the price has tested the 1.7809 low, making it the most important support level to watch. Prior to the bounce, the price broke above the 1.8000 psychosocial resistance, and right now it is acting as the support. Overall, there are no several support levels where the price can potentially retrace. Right now, the pair is trading at the nearest support, which is 1.8000. If broken, the next support is located at 1.7938 and still can be re-tested along with the 200 SMA as well as the uptrend trendline. Most importantly is that the daily close must remain above 1.7809 for the uptrend to continue.
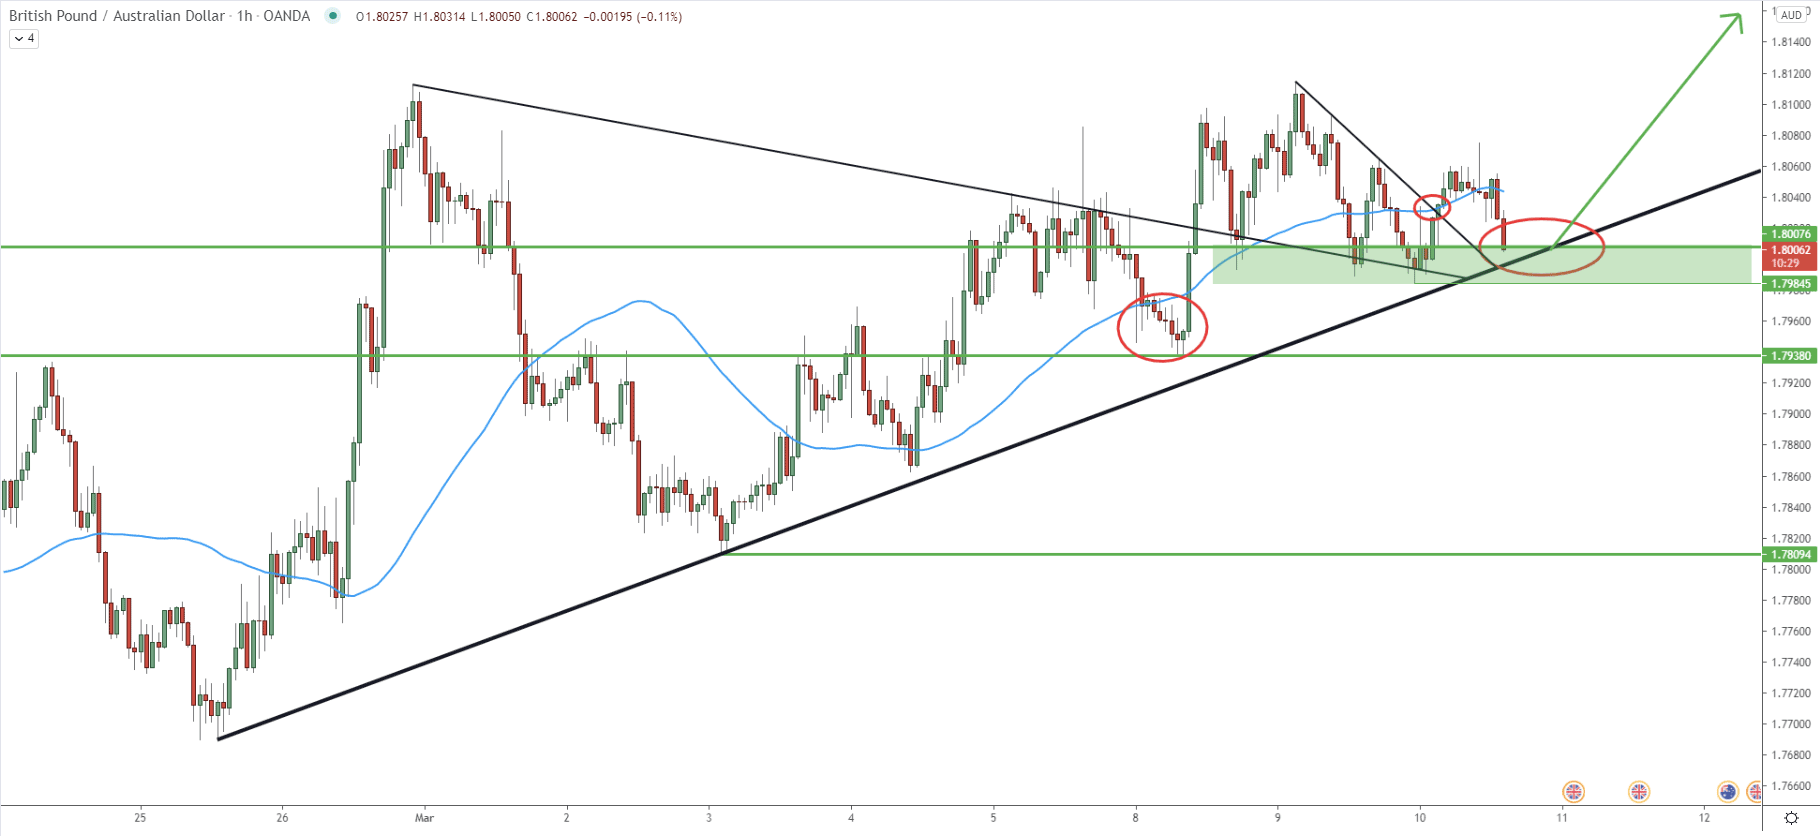
Prior to the breakout of the triangle pattern, GBP/AUD bounced off the 1.7938 support and 50 SMA. Then it went up and broke the triangle resulting in a new higher high. But drawing the past week price has been range trading between 1.8000 and 1.8100, while multiple times entering the demand area. Currently, the price is yet again in the demand zone, and considering that the triangle was broken along with the minor downtrend trenldine, this price can be very attractive for buyers.
In the worst-case scenario of an uptrend, there can be yet another attempt to push the price down, and the price spike below the 1.7938 support can be expected. But overall, buyers are likely to be seeking the perfect opportunity starting from this point onwards.
On the weekly chart, the trend remains very bullish. On lower timeframes, there are first signs that the trend is about to reverse to the upside, with a huge 700 pip growth potential. Obviously, this scenario can become the reality as long as 1.7938 support is being respected.
As per the weekly chart, the nearest resistance, which is also a supply area, is located at 1.8700 psychological level and is confirmed by 38.2% Fibonacci retracement.
As per the 4-hour chart, daily break and close below 1.7809 will immediately invalidate the bullish outlook. In this case, the downtrend is highly likely to continue, potentially towards the 1.7416 support.
Support: 1.8000, 1.7938, 1.7809
Resistance: 1.81000, 1.83000, 1.85000, 1.87000