
Published: November 26th, 2020
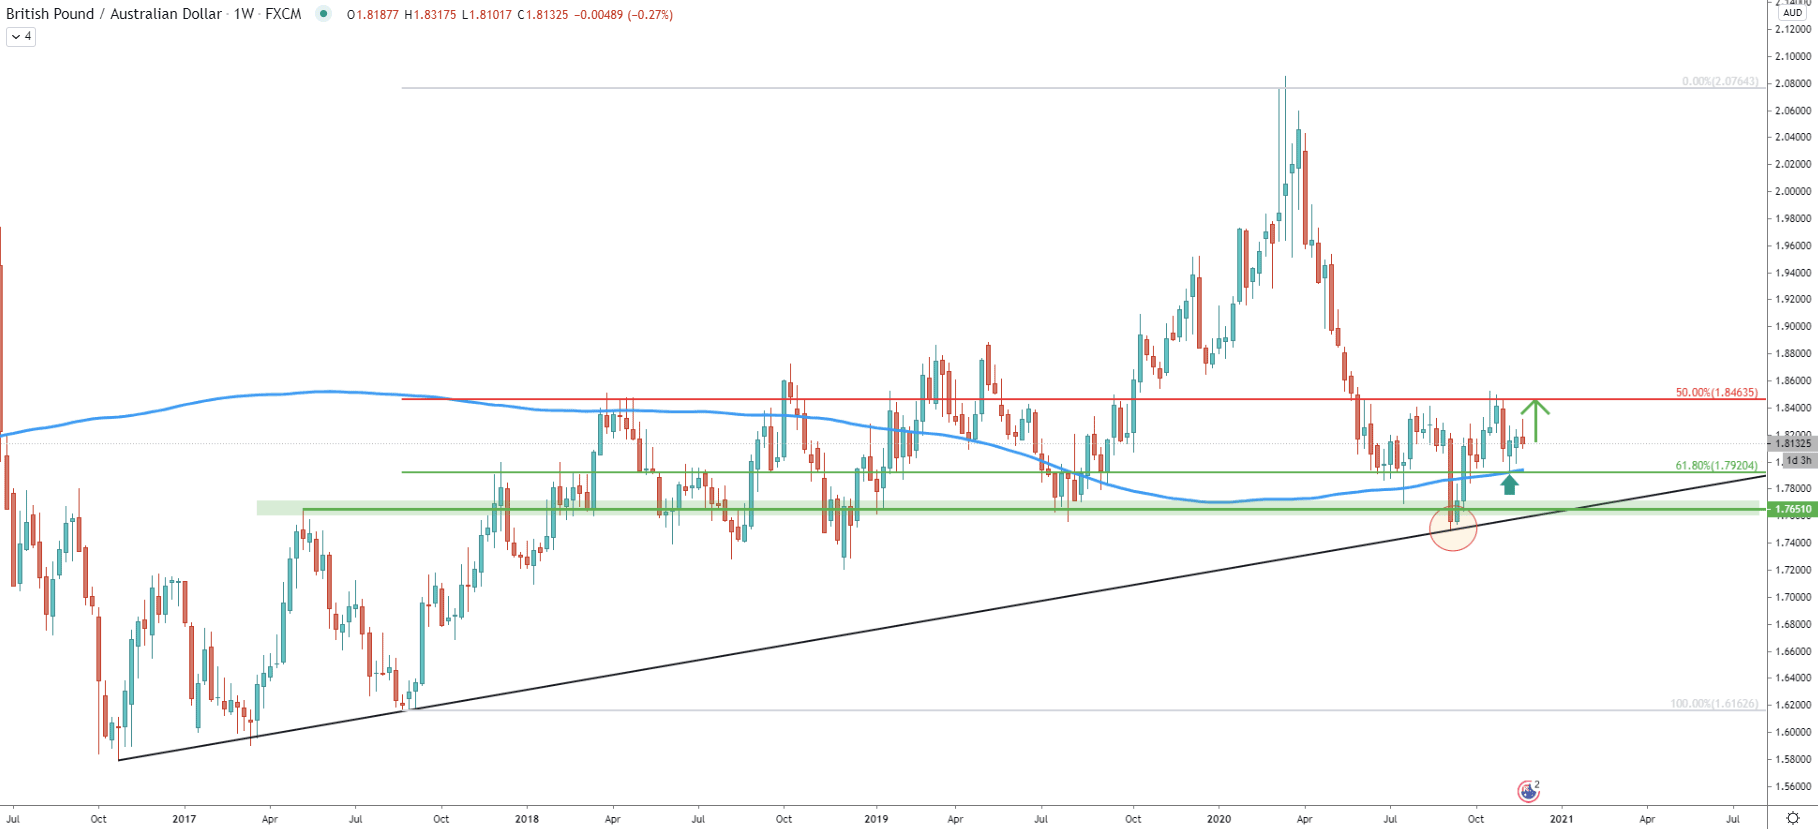
On the weekly chart, the GBP/AUD trend remains bullish as early September price rejected the simple uptrend trendline. A strong upside move followed, resulting in a break and close above 200 Exponential Moving Average. Just a few weeks ago price has pulled back down once again and clearly bounced off the 61.8% Fibonacci retracement level at 1.7920. Simultaneously GBP/AUD has rejected the 200 EMA, which acted as the support.
This goes to show, that 1.7920 support has been defended by the bulls, suggesting the validity of an uptrend. The closest resistance could be located at 1.8463, which is a 50% Fibonacci retracement level. Although this is only the nearest resistance, while the price could be traveling much higher in the coming weeks. Let’s see what other resistance levels there are to watch.
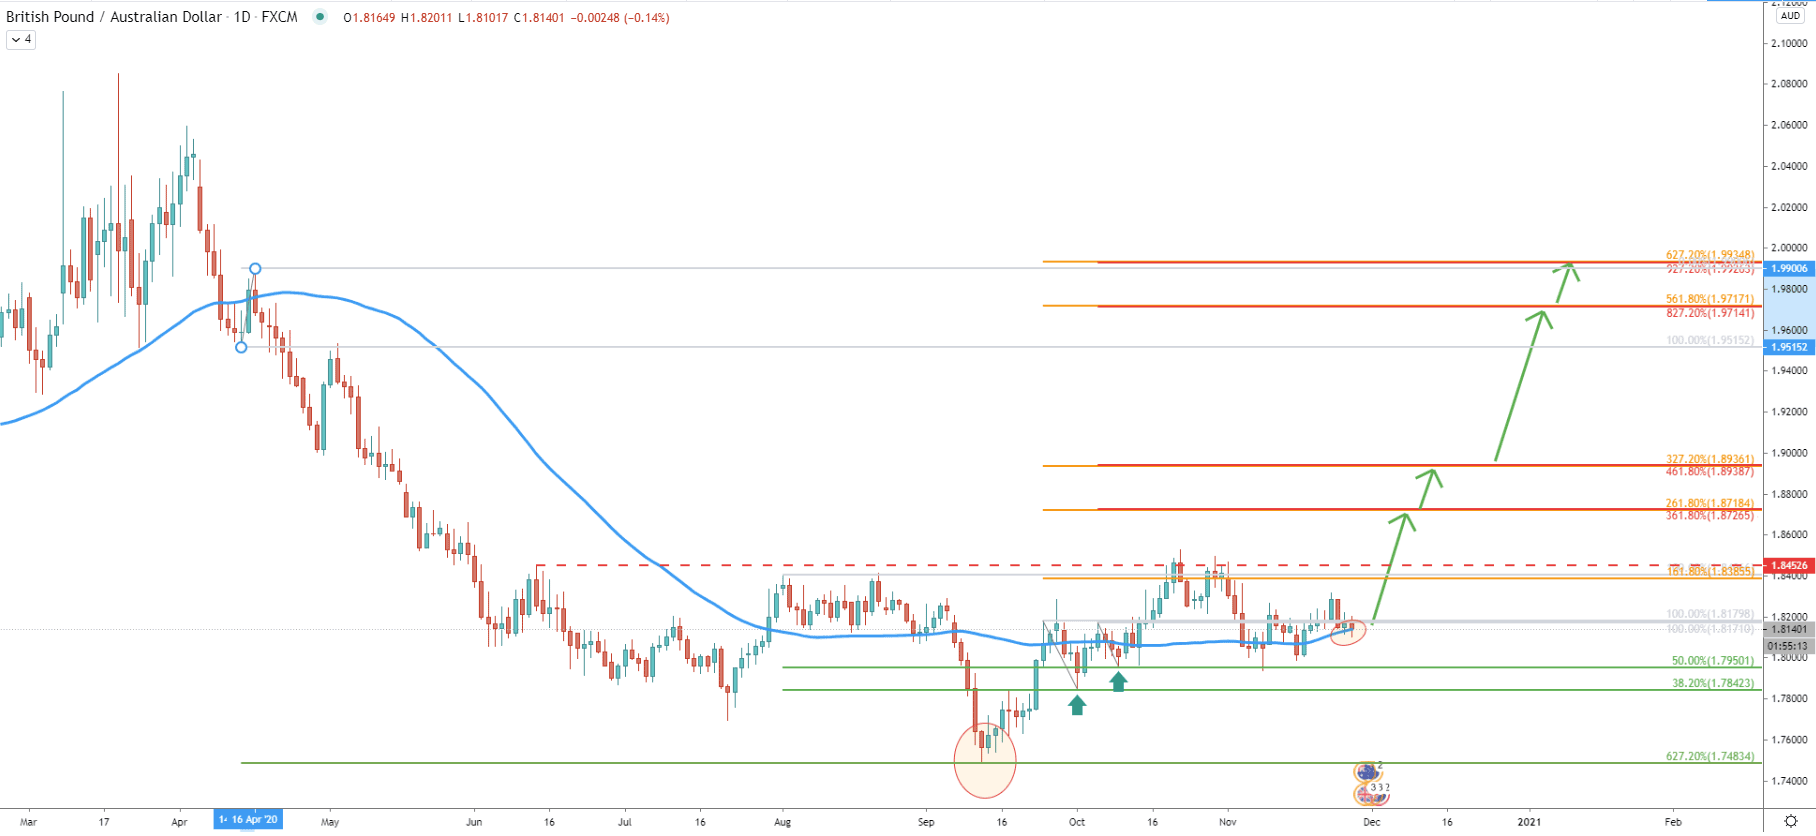
The very first and most important thing on the daily chart is a clear rejection of the 627.2% Fibs at 1.7483. This Fib was applied to the corrective move up after the price broke below the 50 Exponential Moving Average. Such rejection might imply, that the long-term bottom could have been tested and the major trend has changed from bearish to bullish.
Based on the Fibonacci, applied to the last wave down, it can be seen, that 38.2% Fibs at 1.7842 and then 50% Fibs at 1.7650 were rejected. Yet other Fibs were applied to each of these rejections, to see the key resistance levels. And new resistance levels were discovered, each of which is confirmed by two Fibonacci retracement levels. Based on them, the nearest resistance could be as high as 1.8720 area, which is nearly 600 pips away from the current price. Considering that during the past few days GBP/AUD price has been rejecting the 500 EMA, the uptrend continuation could be just around the corner and can start this week.
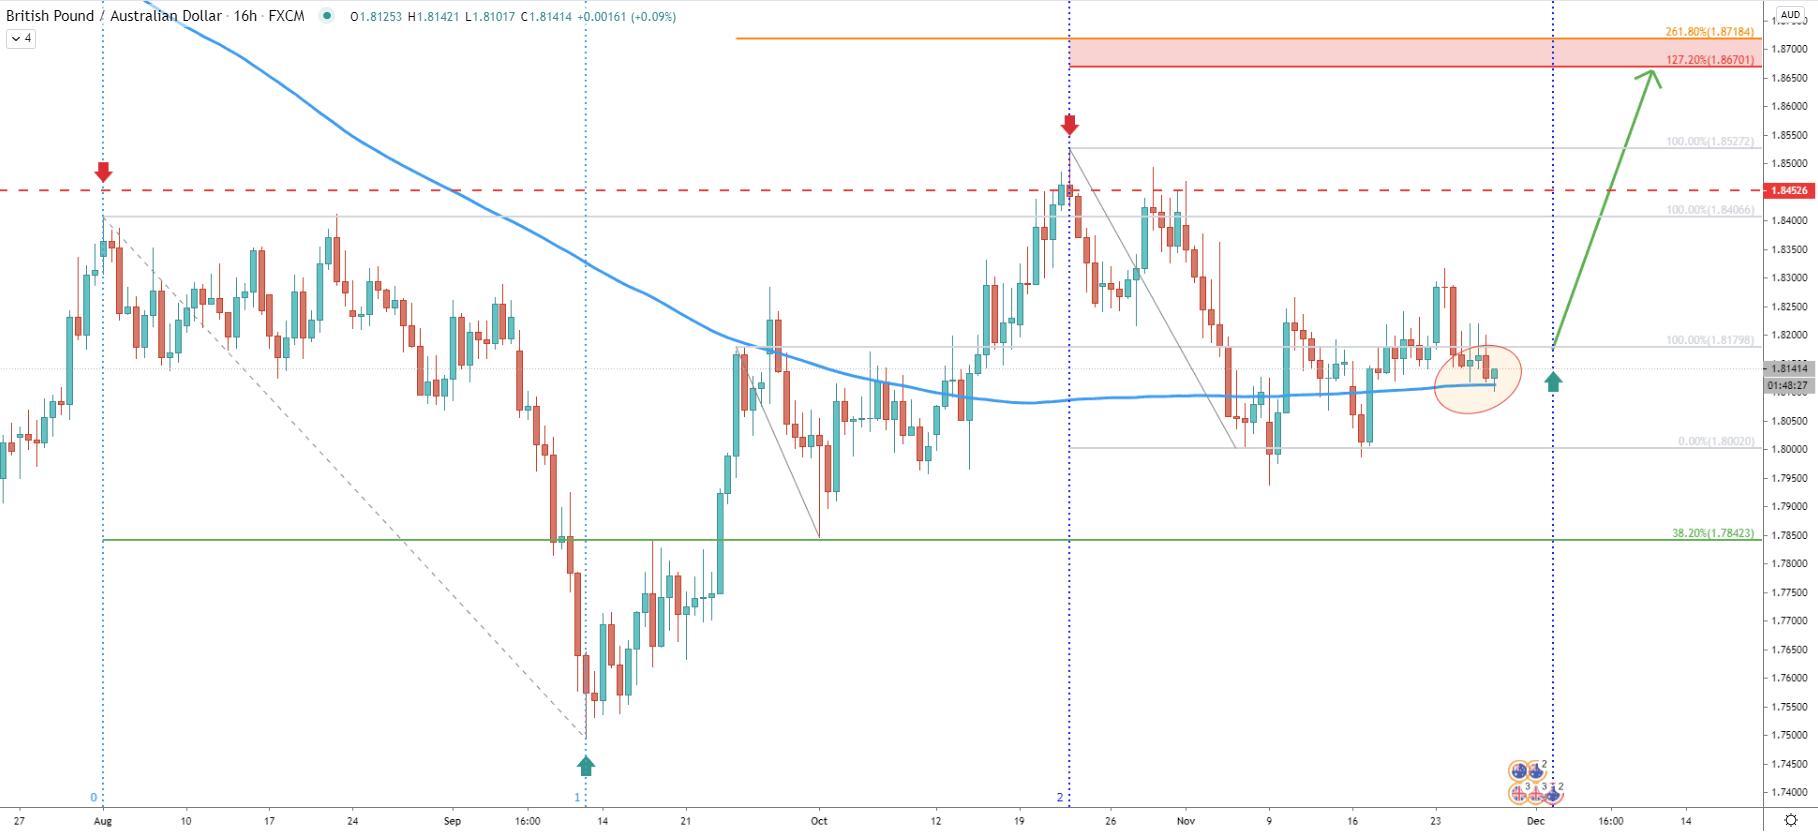
On the 16-hour chart, GBP/AUD yet again rejecting the Moving Average, this time it is 200 EMA. Besides, the Fibonacci cycles indicator shows that the next market cycle could be starting early next week, and this is when the volume might increase for GBP/AUD.
Based on the most recent downside correction, the nearest upside target is 127.2% Fibs at 1.8670. This makes a price area between 1.8670-1.8718 a potential strong supply zone, which definitely must be monitored either for a rejection or a breakout. Because if it breaks to the upside, with the daily close above, the price is likely to move up towards one of the next resistance levels as per the daily chart.
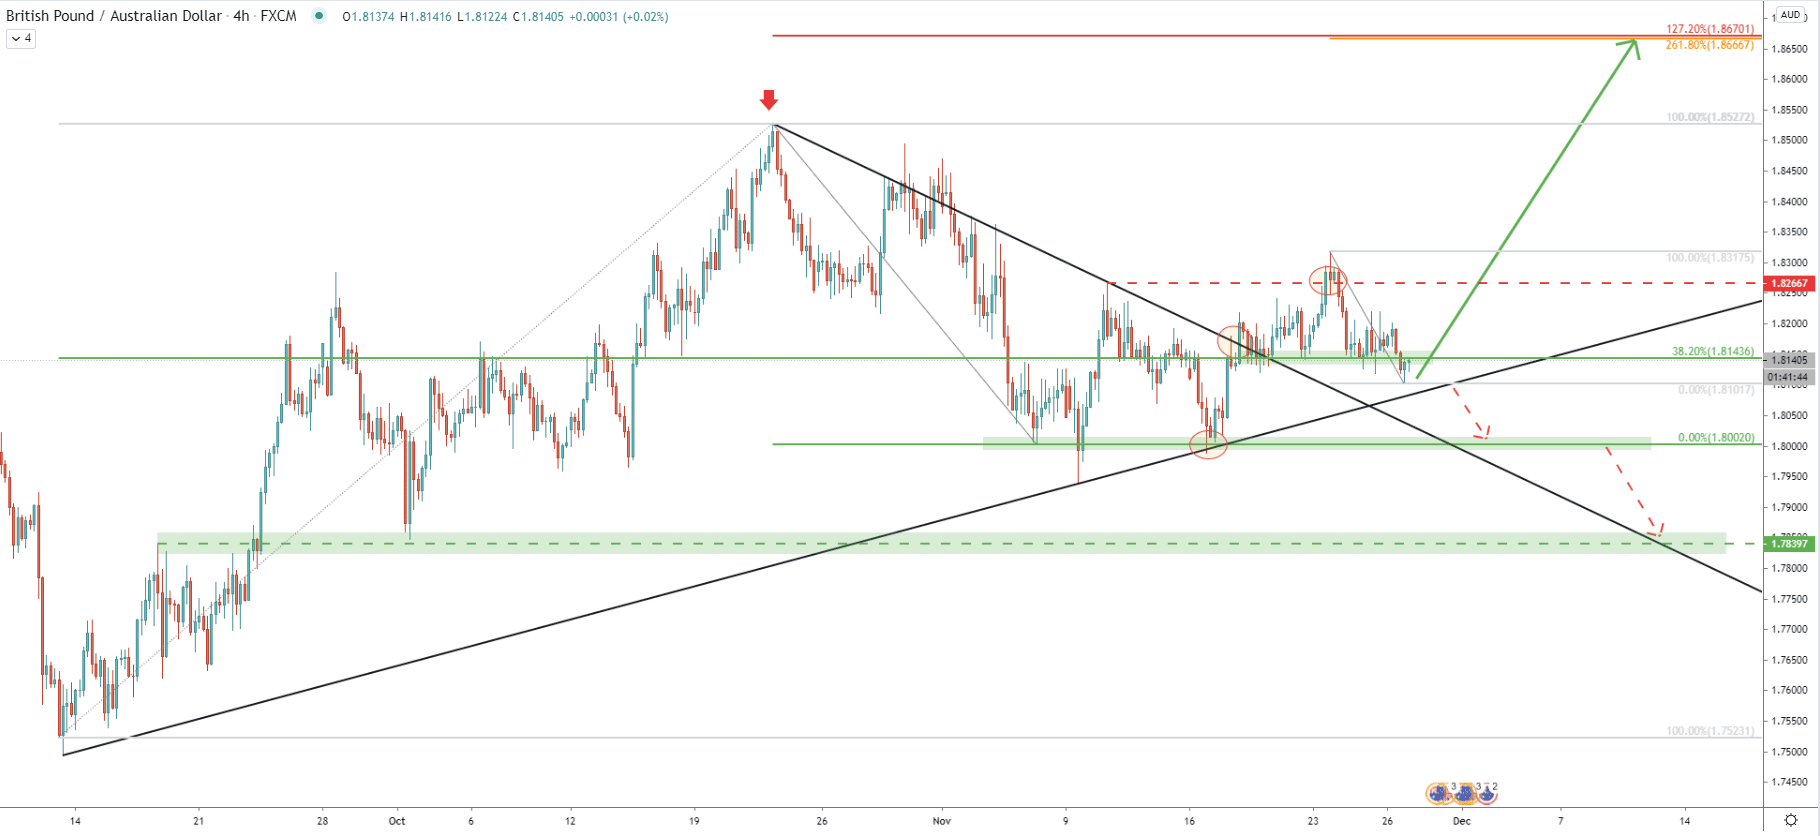
Another uptrend trendline has been rejected, after which the price broke above the downtrend trendline and the previous resistance level at 1.8266. The correction down followed, and right now GBP/AUD is rejecting the 38.2% Fibonacci support at 1.8143. But still, the price spiked down and has reached the 1.8100 psychological level, while bouncing off cleanly. Therefore, 1.8100 could be playing a key role in further price defelopment. And as long as the 4h closing price remains above, uptrend continuation will hold a very high probability. On this chart, the 1.8670 resistance is now confirmed by 2 Fibs, 127.2% and 261.8% Fibs applied to the current downside correction.
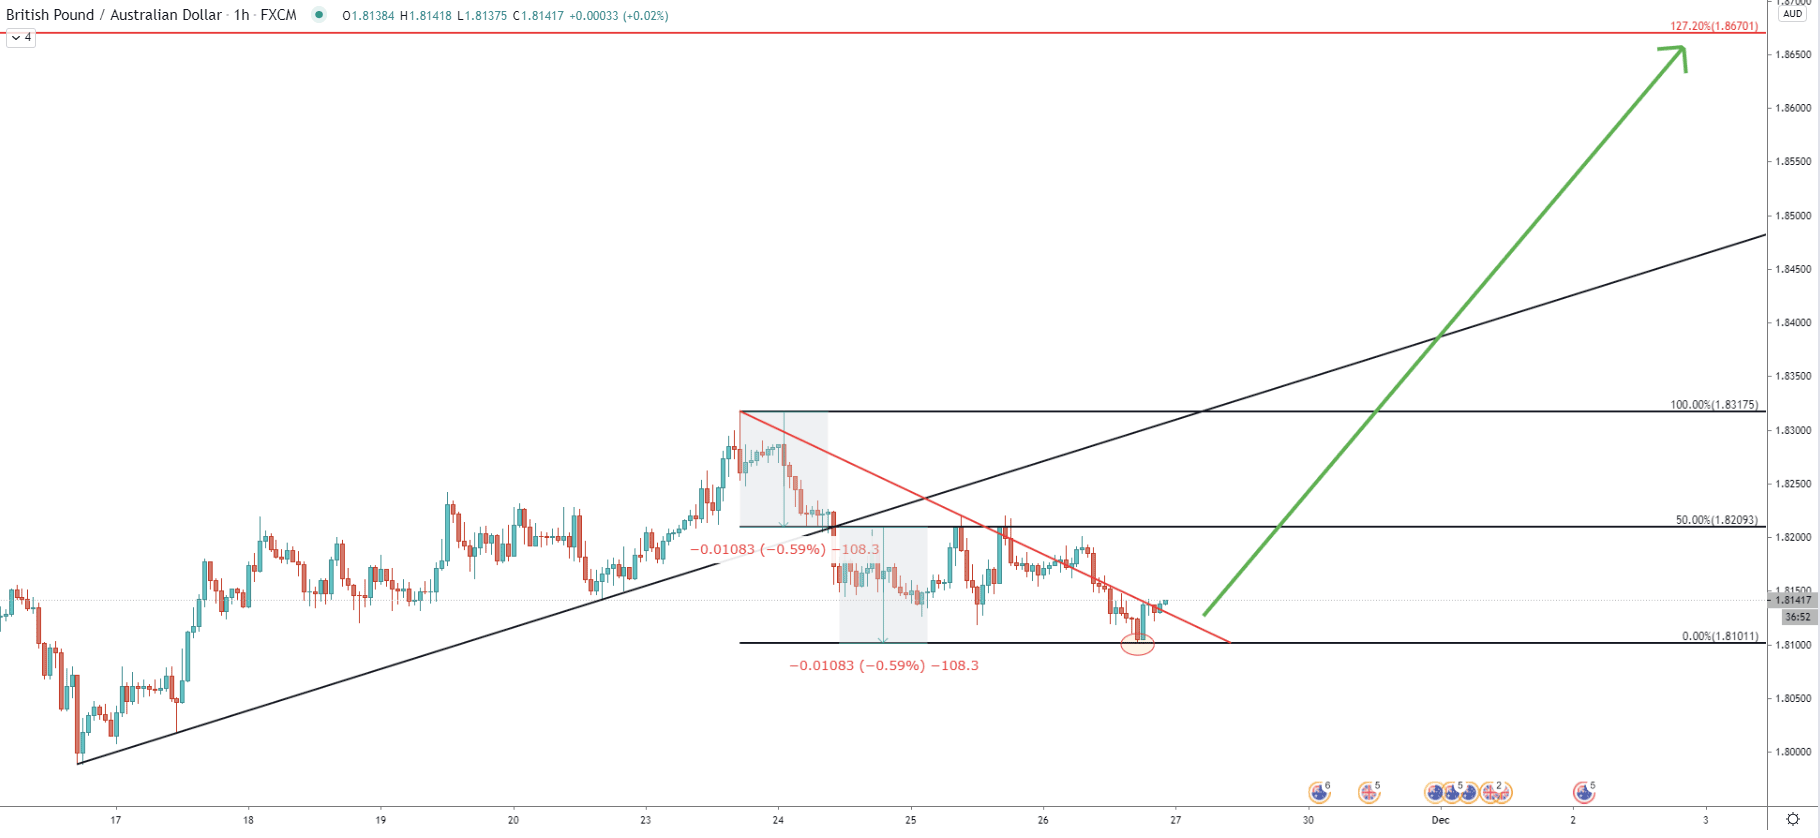
On November 24, GBP/AUD broke below the simple uptrend trendline and went down to the 1.8100 psychological level. It can be seen, that the price distance from the top to the trendline breakout point, equals the distance traveled from the breakout point down to 1.8100 support. This implies, that the correction could have ended and now it is the time for an uptrend.
But perhaps there is a final touch needed to confirm the uptrend, which is broken and close above the simple downtrend trendline. It seems like GBP/AUD is attempting to accomplish this right now. And if/when it breaks above, buyers are likely to start paying attention.
Today GBP/AUD rejected a very important technical as well as psychological support at 1.8100. This could have been the bottom of the current downside correction. If that is the case and current support holds, there is over 600 pip growth potential which might take place in the next 2-3 weeks.
As per the daily and 4-hour charts, there are at least 5 upside targets to watch in the long run. However, the most important could be located at 1.8670, providing a 600+ pip upside potential in the medium term.
As per the 4-hour chart, 1.8100 could be acting as the key support level. Therefore, a 4h break and close below this level will invalidate the bullish forecast and in this scenario, GBP/AUD is highly likely to continue trending down. Next support could be right at the 1.8000, which is an even more important psychological level.
Support: 1.8100, 1.8000
Resistance: 1.8670, 1.8720, 1.8935, 1.9715, 1.9925