
Published: July 1st, 2020
Throughout the past three weeks, we have covered all major Australian Dollar currency pairs and today time has come for the GBP/AUD. Across the board, AUD is still feeling very strong and is likely to outperform all if not all other major fiat currencies. But this might not last for long as it seems that if the GBP/AUD downtrend will continue, it will be the last and final wave down.
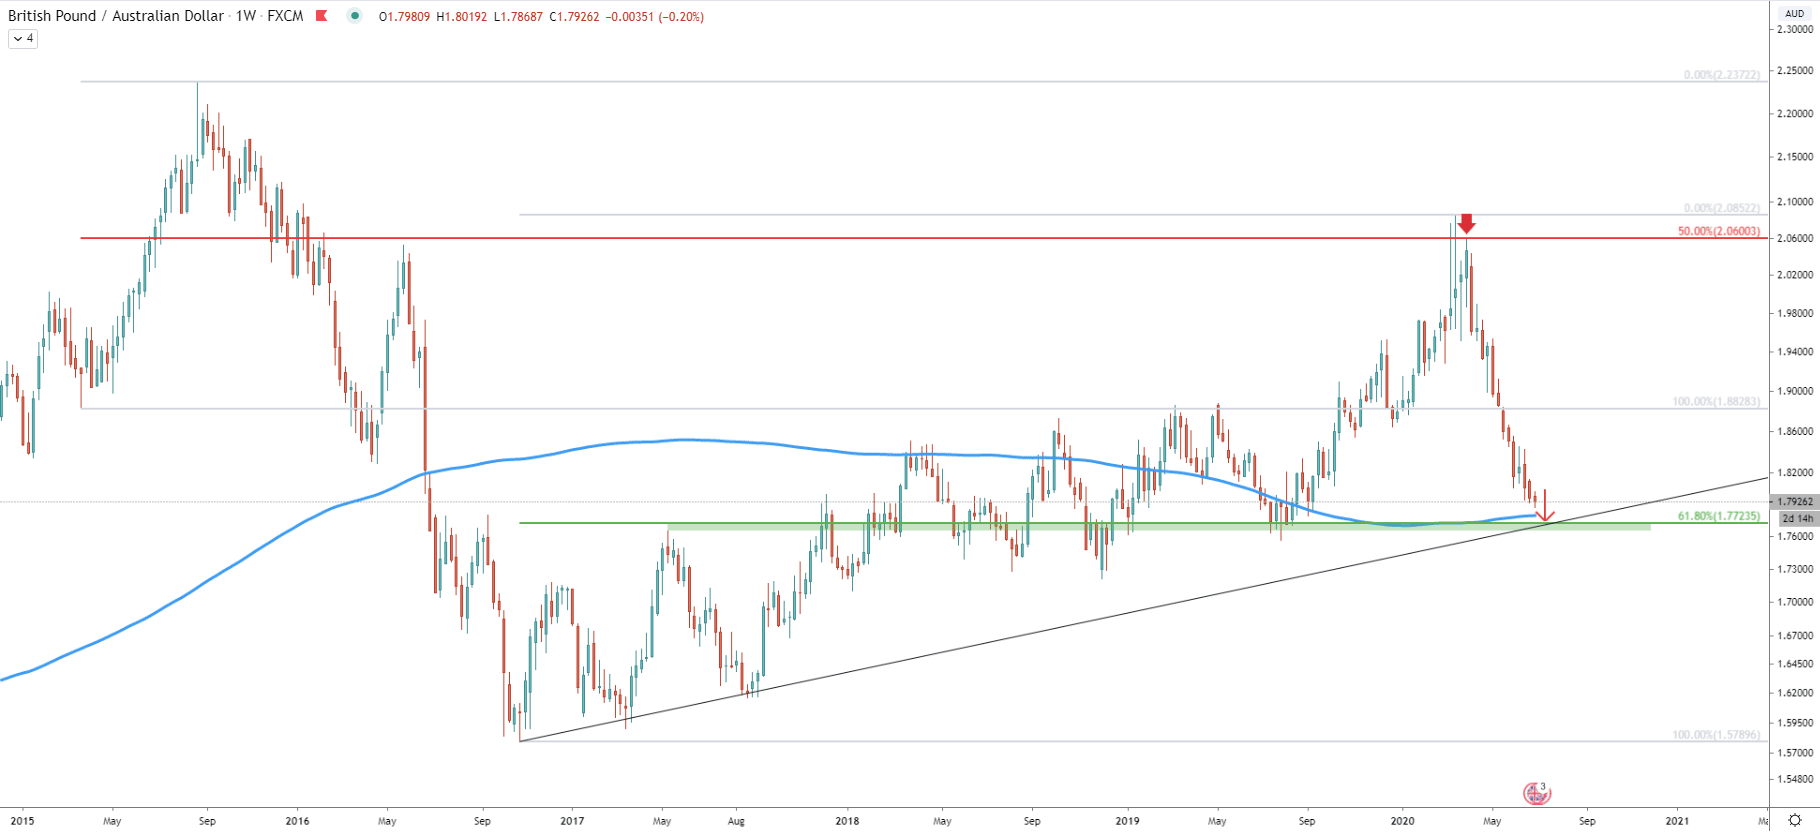
On the Weekly chart, we have applied two Fibonacci retracement indicators. First to the last wave up, where GBP/AUD tested 2.2372 high back in September 2015. The second Fibs applied to the overall uptrend, which has been going on throughout 2017- 2020.
First Fibs shows us the level of major resistance, located at a 50% retracement level, which is 2.0600. This was a very strong technical as well as psychological resistance and after rejection price started to move down sharply. Since then GBP/AUD lost 13.24%, which took exactly 90 trading days. Clearly the downtrend was very strong and currently the price is approaching key support. The support is confirmed by the second Fibonacci indicator which shows the 61.8% retracement level located at 1.7723. This means that price might still drop by another 200 pips and this could be a very fast decline.
Besides, during the past few years, this support was a huge supply/demand zone and will definitely play a very important role in further price development. And finally, if the support will be reached, it will test the long term uptrend trendline, which goes perfectly in line with the downside target.
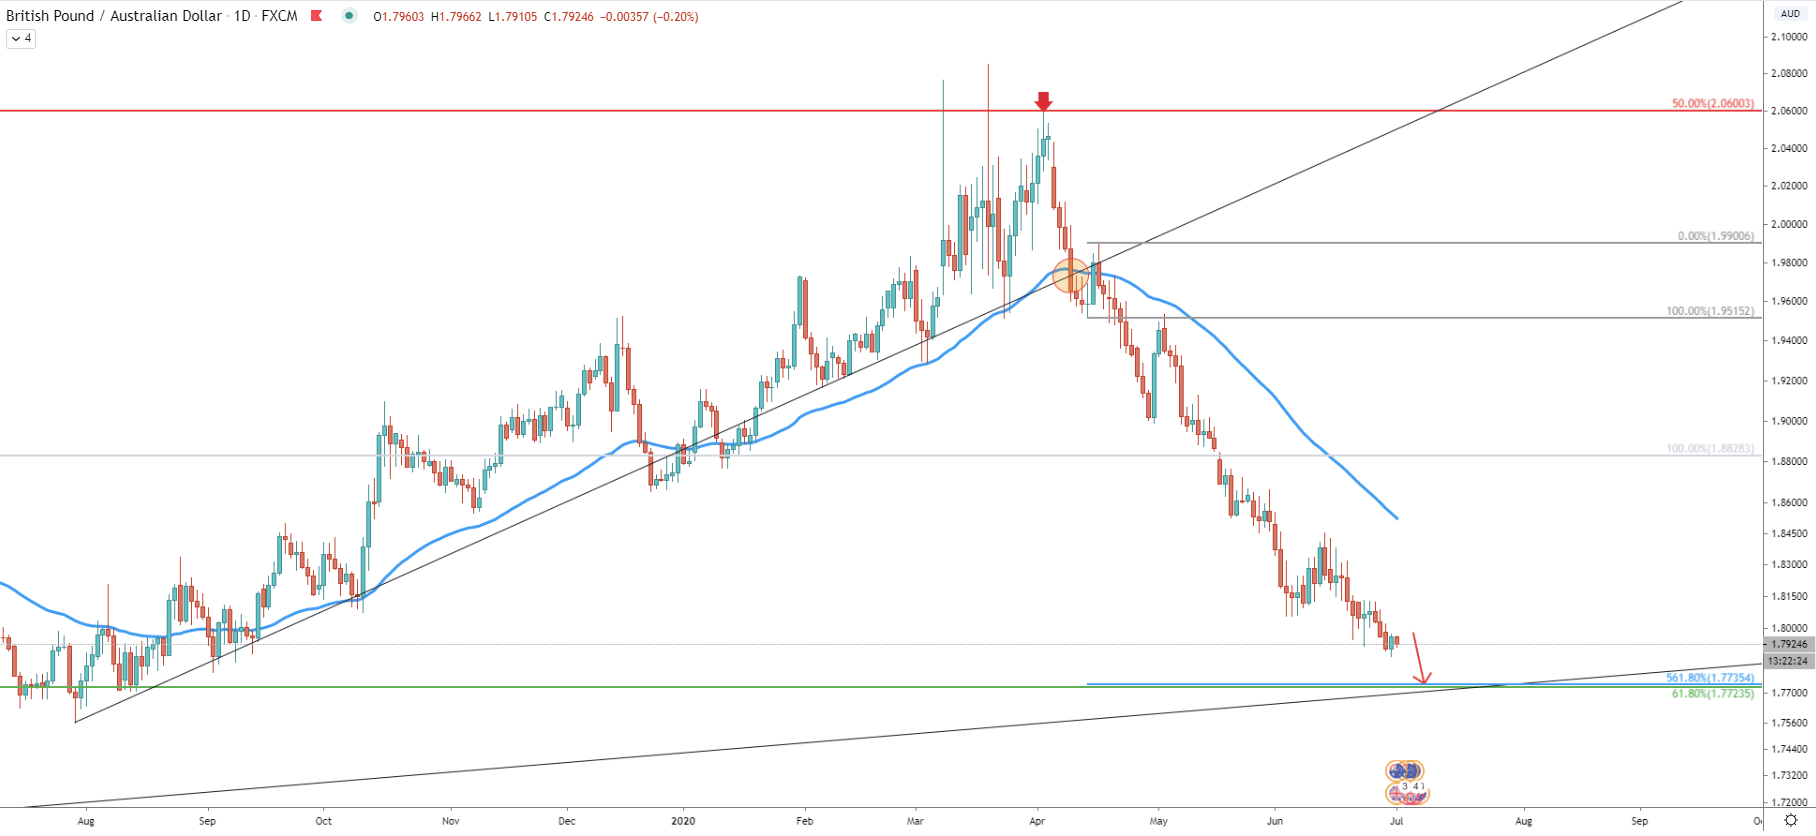
On the daily chart, we can see the point of the break below the uptrend trendline as well as 50 Simple Moving Average. Fibonacci applied to the corrective wave up after the breakout shows that 561.8% Fibs is located at 1.7735, which almost exactly corresponds to the previously mentioned support level and the uptrend trendline.
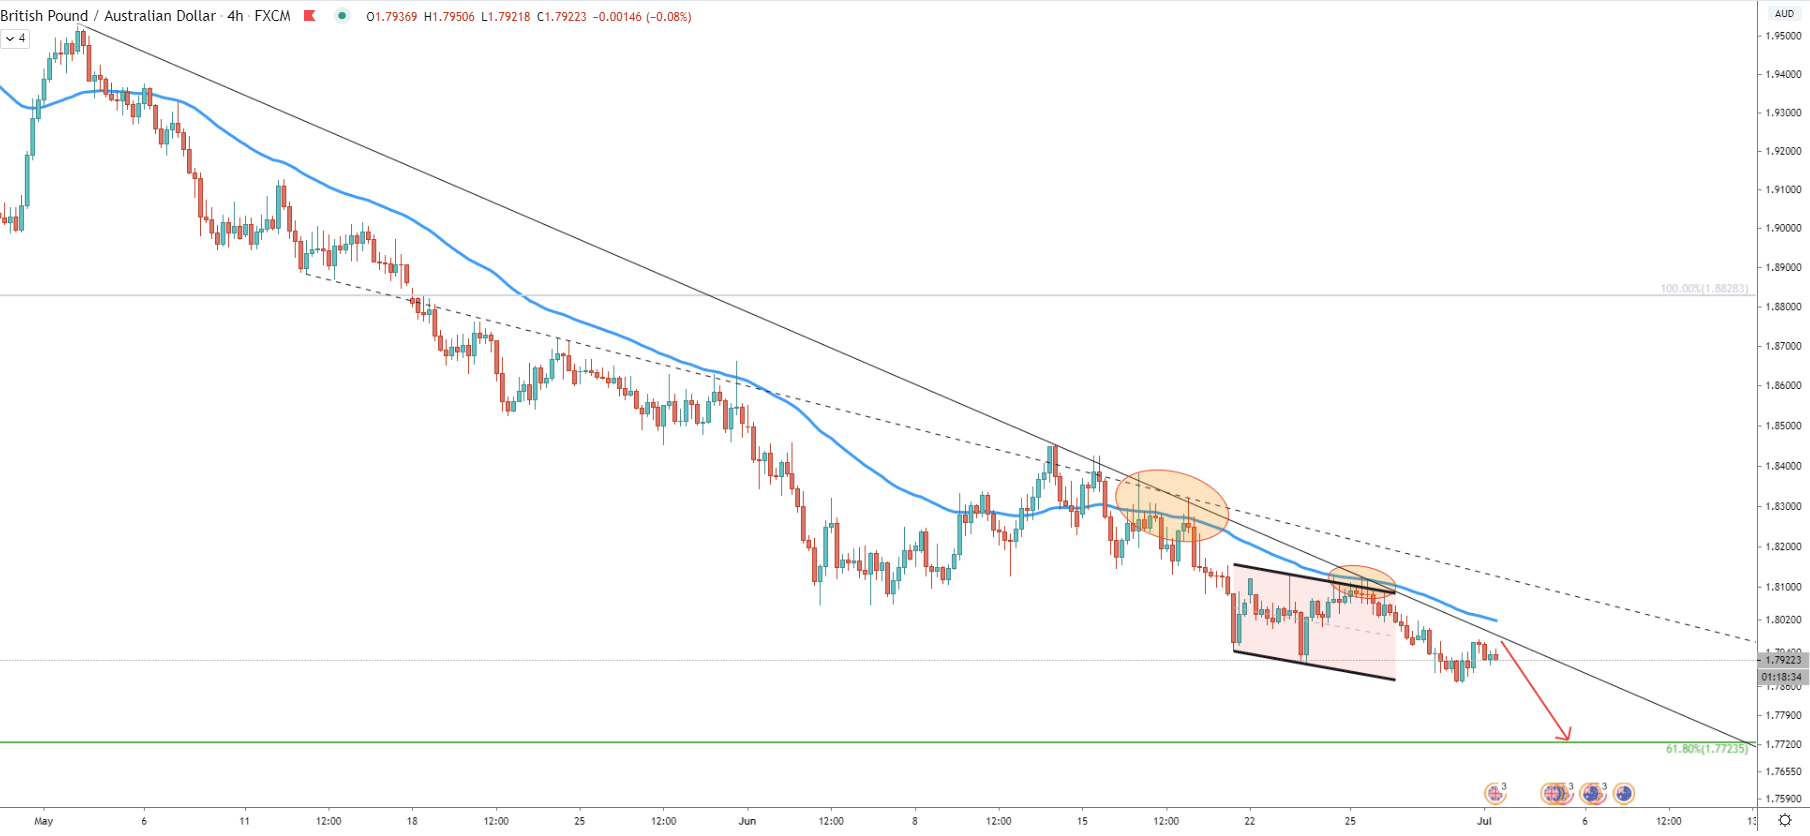
On the 4-hour chart price clearly producing lower lows and lower highs while rejecting the simple and the average-price downtrend trendlines. The last rejection occurred on June 25, where price also bounced cleanly off the 50 Exponential Moving Average. Along with the EMA, the price has reached and rejected the upper trendline of the descending channel, yet again confirming strong bearish dominance. The next move resulted in the GBP/AUD moving lower and printing yet another lower low. Seems that the selloff continues and this week there might be a final strong downside wave.
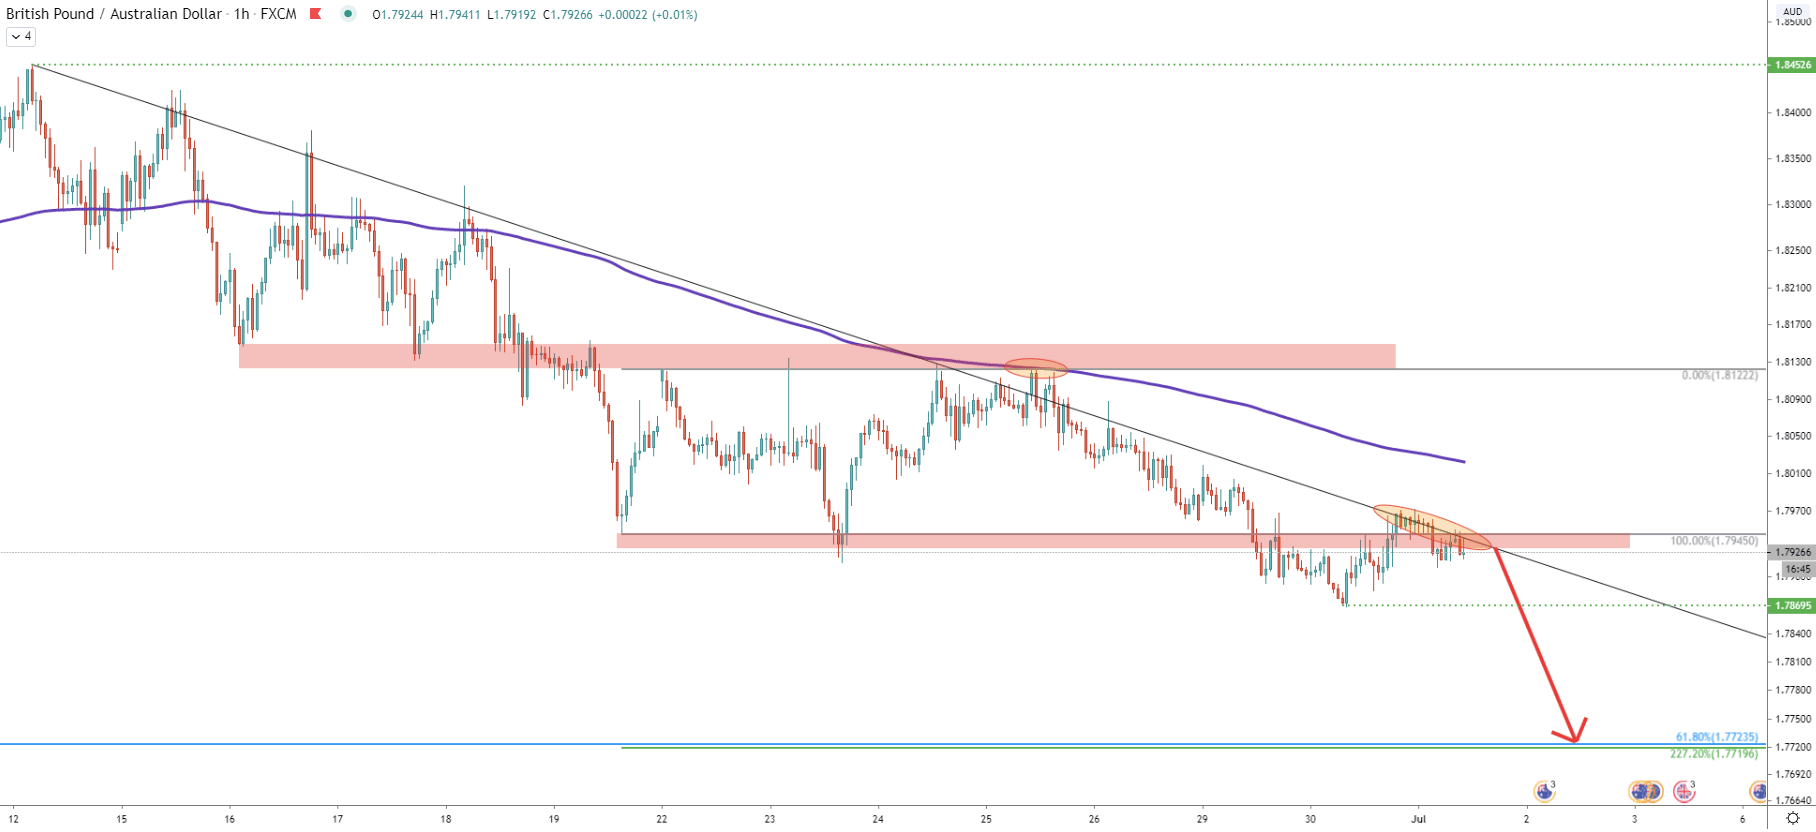
On the 1-hour chart, another downtrend trendline was applied. And here also we see a rejection of the trendline for two consecutive times. Currently, GBP/AUD is trading right in the area of supply, which previously was a strong support zone. This could mean that the downtrend will continue at any moment, perhaps starting from today.
We have applied the Fibonacci retracement level to the corrective wave up, where the trendline and the 200 EMA were rejected. It shows that 227.2% Fibs also corresponds to the downside target at 1.7723 as per the weekly chart.
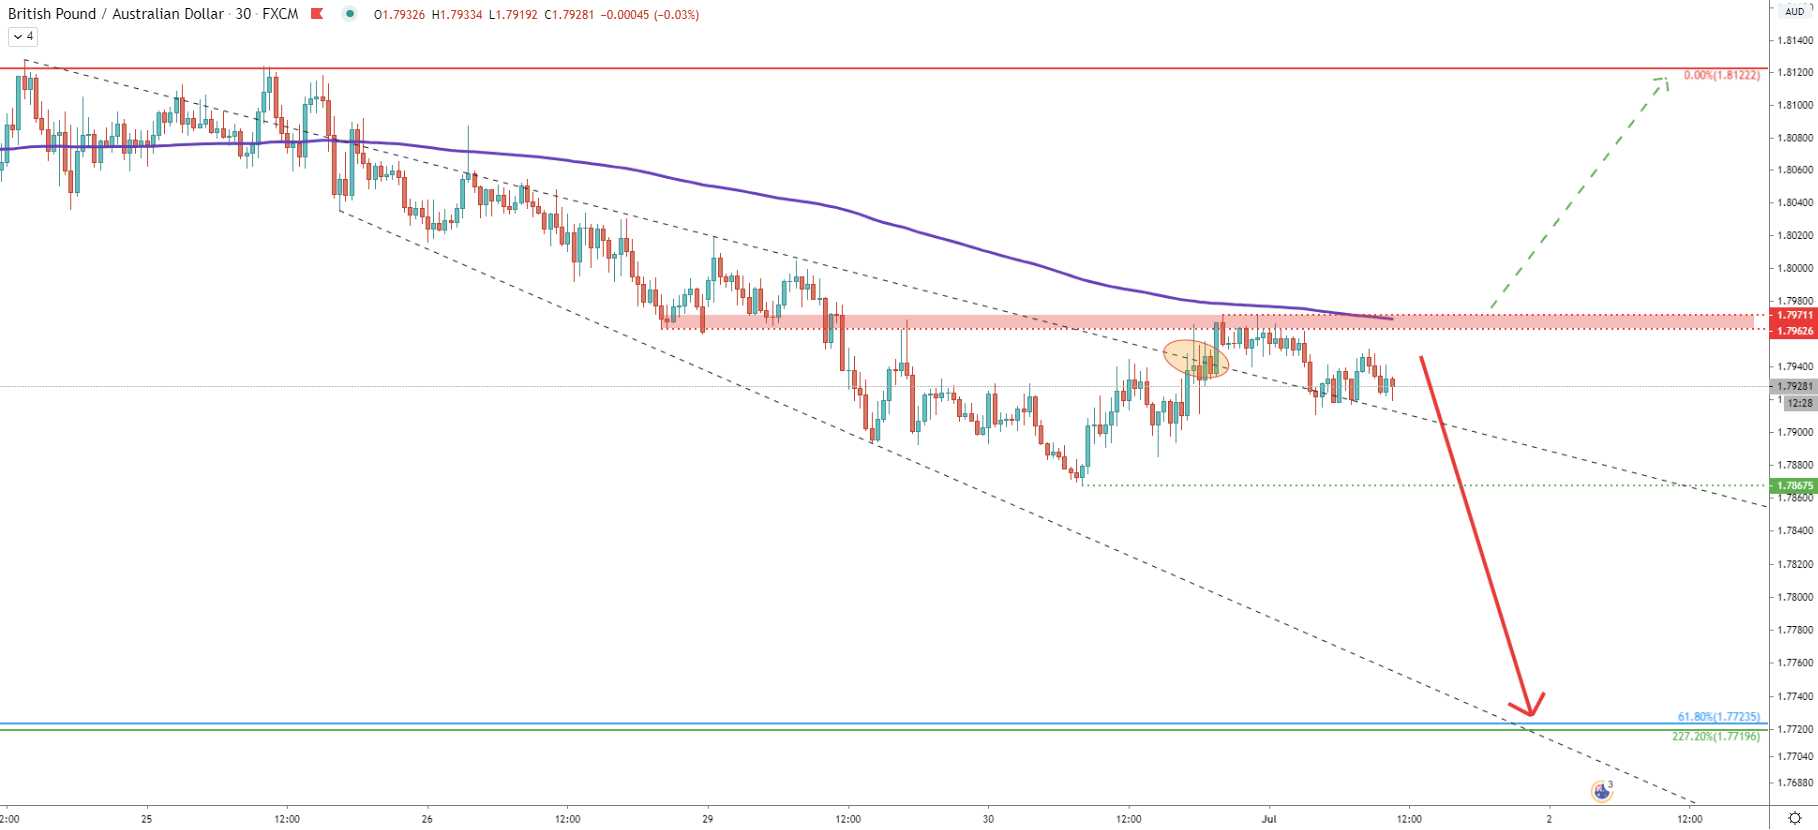
Finally comes the 30-minute chart were two trendlines were applied. First is a simple downtrend and second is the support downtrend trendline. The simple trendline was rejected, as the price managed to produce only a spike higher, although there was no closing price above the spike.
Today GBP/AUD has approached the key resistance area near 1.7970 and as long as 1h and 4h closing price remain below, pair should be expected to continue trending down. The downside target on this chart is confirmed by the support downtrend trendline and it shows that price might reach the target within the next 24 hours.
Based on multiple chart GBP/AUD continues to reject all possible resistance levels and currently remains at the strong supply zone. Bears are strongly defending the resistance and if they will continue to succeed, the price will move down again.
As per the Weekly, Daily, and 1-hour chart, based on 3 different Fibonacci retracement levels, the key downside target is located between 1.7215 - 1.7225. If this support area will be tested, it will be important to watch either for a rejection or a break below. Break below might push the price even father down, potentially as low as 1.7000, which is an extremely strong psychological support. But if rejected, the GBP/AUD trend reversal phase might begin.
As per the 30-minute chart, the key resistance is seen at 1.7971. 1h and/or 4h break and close above this level will most likely invalidate bearish outlook and GBP/AUD could start a slow reversal to the upside.
Support: 1.7867, 1.7223
Resistance: 1.7971, 1.8133