Published: June 8th, 2021
FTSE 100 started the week with the bearish sentiment, which came from Chinese export data with a weaker-than-expected result. However, the market sentiment was changed the next day, and the price reached 7100 levels again in June.
The FTSE 100 price remained stable above the 7000 level, but the pending decision of the lockdown closure is keeping the market uncertain. UK prime minister Boris Johnson was supposed to make a formal announcement on Monday regarding the social distance review, while the current plan is to end lockdowns and social distance within 21 June.
Despite the uncertainty, the price moved higher today with bullish sentiment from the Insurance sector. The asset management business moved higher by 6.26% to 2291p as soon as the full-year profit was published with an increase in annual dividends.
The market participants ignored bearish possibilities and took the price above the 7100 levels with strong bullish momentum. Can buyers hold the bullish momentum in the coming days?
Let’s see the future price direction from the FTSE 100 technical analysis:
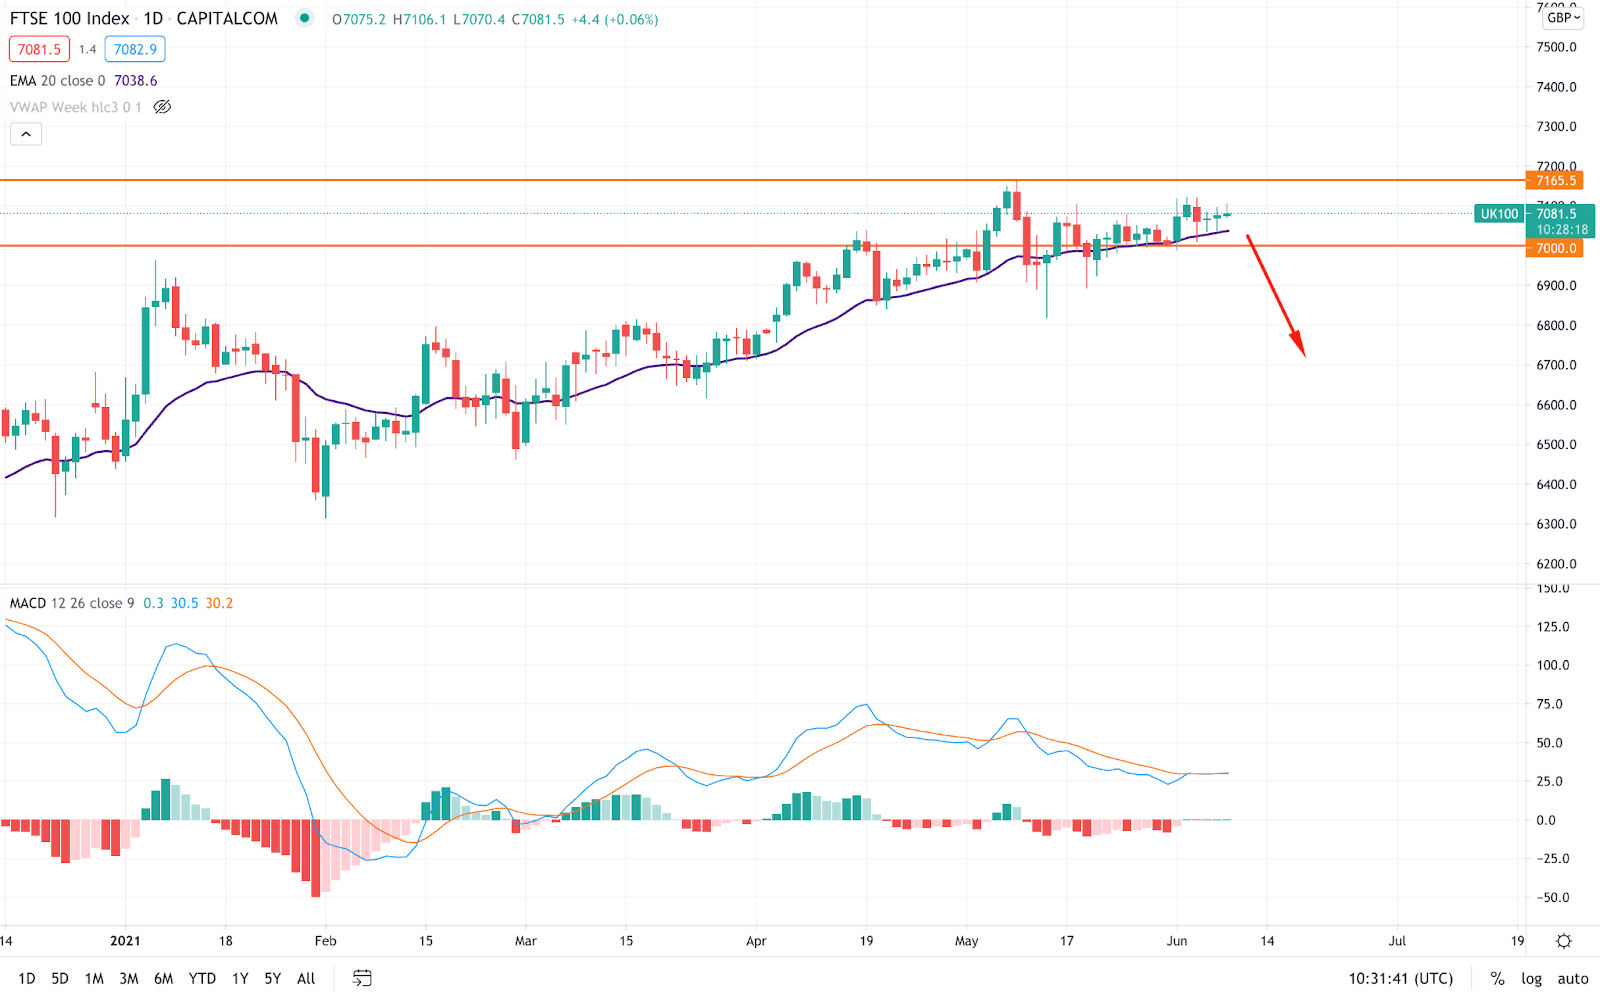
FTSE 100 started the year with a bullish momentum where the price shifted its direction after the COVID-19 pandemic that crashed the price towards the 4759.10 level. Later on, the price started to recover and gained more than it lost in 2020.
However, the price became volatile as soon as it tested the 7165.50 level in May 2021. After that, the price remained within the range between 7000.00 to 7165.50 level with a lot of volatility in the intraday chart.
In the above image, we can see the daily chart of FTSE 100, where the price is getting support from both static 7000.00 and dynamic 20 EMA, backed by a strong bullish trend. Therefore, as long as the price is trading above the dynamic 20 EMA on the daily chart, it has a higher possibility of testing the 2021 high of 7165.50 level.
On the other hand, MACD Histogram has squeezed to zero levels, pointing out less activity to the price. Moreover, MA lines in MACD are above the zero levels and moving down, indicating buyers’ weakness in the price.
In this situation, a strong bearish daily close below the 7000.00 level may create a bearish pressure on the price where the primary target would be 6800.02 support.
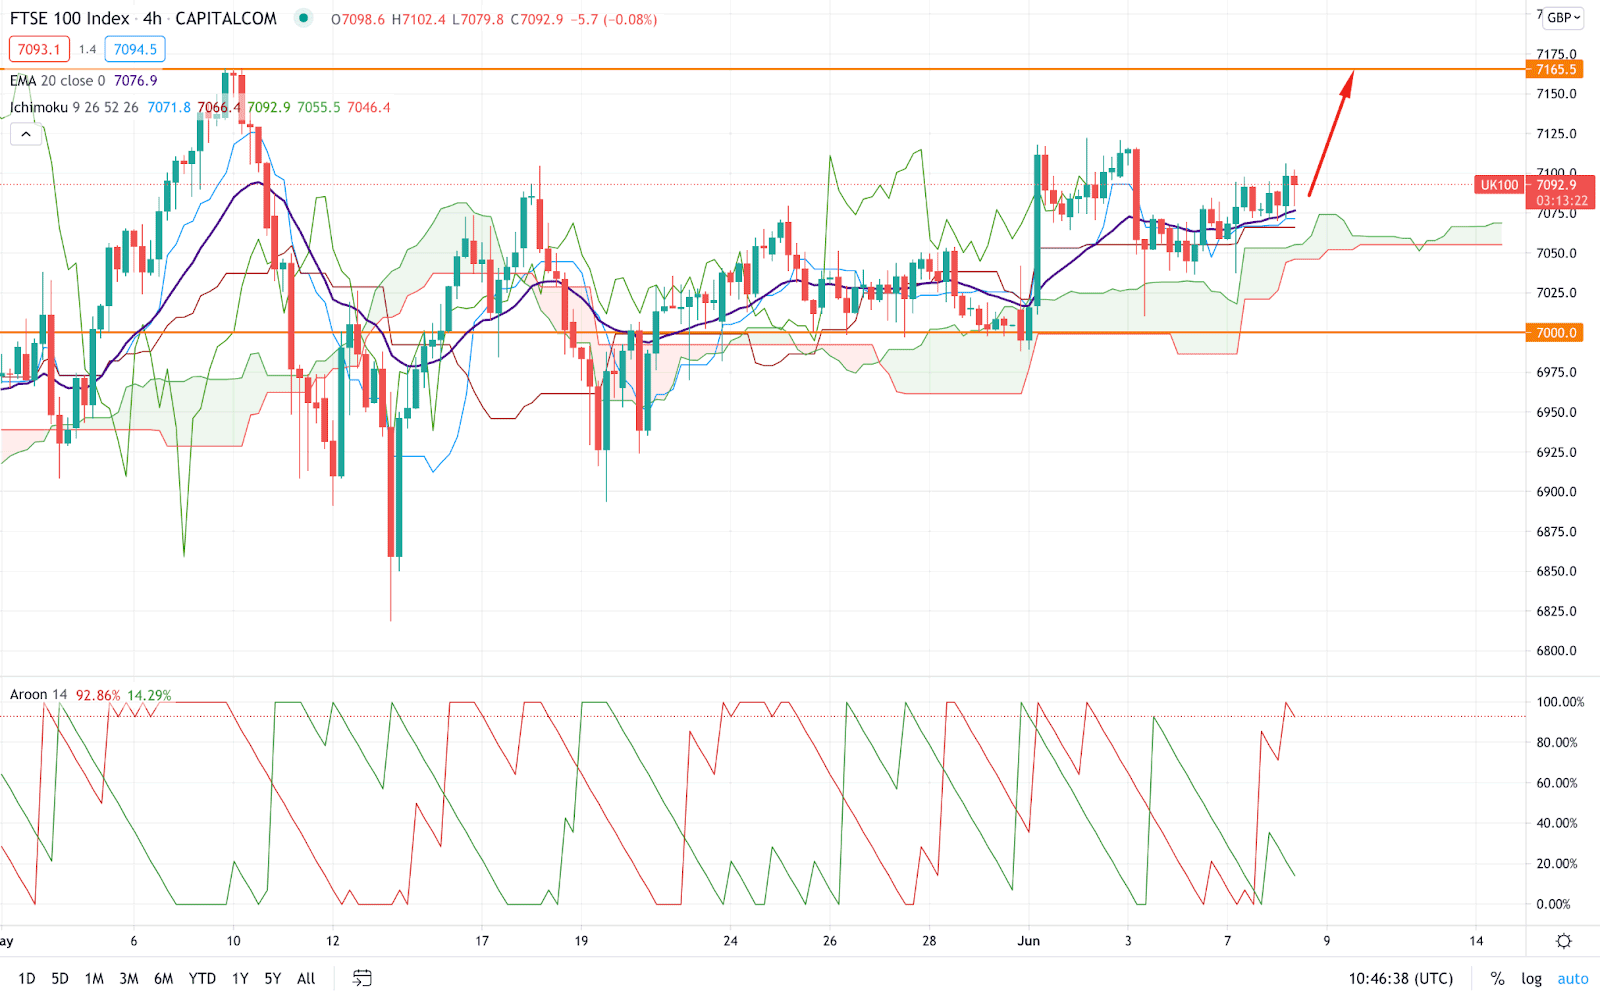
If we plot the Ichimoku Kinko Hyo in the H4 chart, we would see that the price is stable above the Kumo Cloud after a strong bullish breakout on Jun 1. Later on, the price corrected lower and rejected the Kumo Resistance again.
Moreover, in the future cloud, the Senkou Span A is above the Senkou Span B and aiming higher, which signifies an upcoming bullish pressure in the price.
In the most recent candles, we can see that the price is above the dynamic Tenkan Sen and Kijun Sen with a strong bullish H4 close. Moreover, the dynamic 20 EMA is below the price and aiming higher.
In this context, the price has a higher possibility of testing the 7165.50 level as long as it trades above the dynamic Kijun Sen. On the other hand, Aroon Up is above the Aroon Down in the indicator window, while Chikou Span is within the price. So any strong bearish close below the Cloud Support of 7060.00 level may invalidate the current bullish possibility.
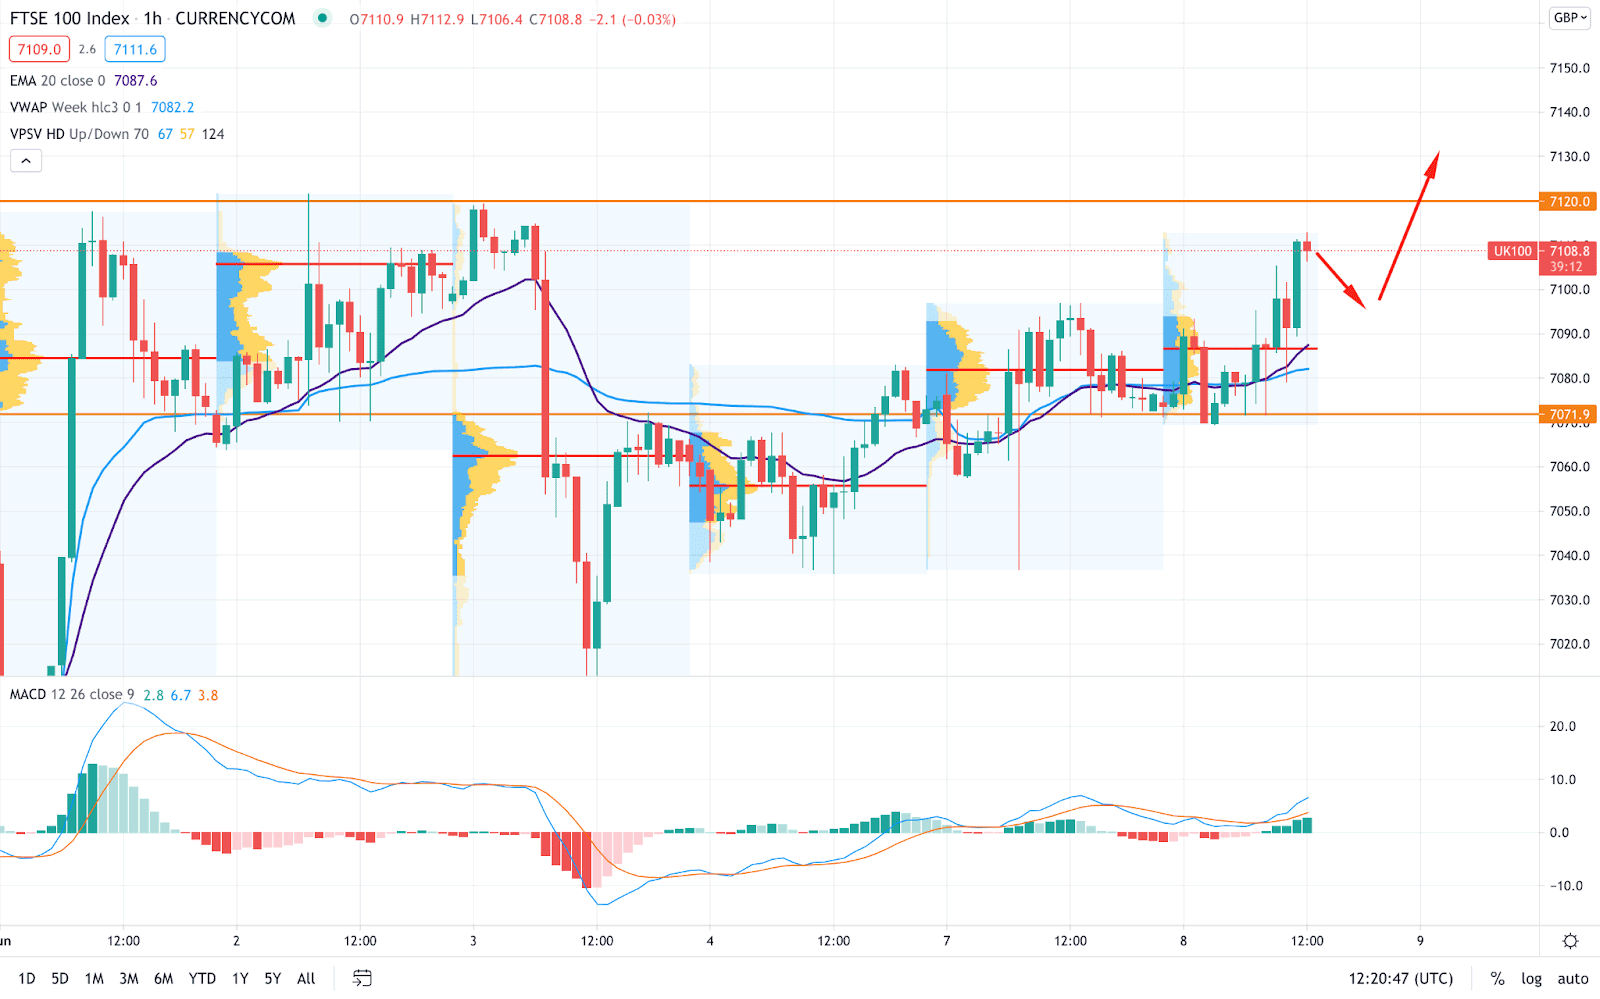
In the intraday chart, the price is trading with a lot of volatility, where the major event level is at the 7071.80 level. Therefore, as long as the price is trading above the 7071.80 level, it may move higher in the coming session.
In the above image, we can see the H1 chart of FTSE 100, where the most recent high volume level is at 7087.20. The current price is above the intraday high volume level, while dynamic 20 EMA and vwap provide support to the price. Therefore, the price has a higher possibility of moving upside from the current high volume level where the primary target would be 7120.20 level.
On the other hand, a regular divergence has formed with MACD while a stable H1 close below the 7071.80 level may create a bearish pressure on the price.
As of the above discussion, we can say that FTSE 100 has a higher possibility of continuing the current bullish trend above the 2021 high as long as it is above the Kumo Cloud in H4 and getting multiple support in the H1 chart.
However, the intraday price is very volatile, where a strong bearish H4 close below the Cloud Support 7060.00 may create a new swing low. In that case, any dovish tone from the UK prime minister or a weaker-than-expected US CPI may work as a major trend changer.