
Published: September 16th, 2021
Filecoin (FIL) is a data storage service provider that works in a decentralised manner. If you know companies like Amazon Web Services or Cloudflare, you know how data service providers work. Filecoin introduced the decentralised nature in the web service industries where it would be easy for users to protect their data’s location and accessibility.
In the last 24 hours, Filecoin price achieved 1.7% price appreciation with a sign of corrective price action. Moreover, the trading volume/market cap is at a 0.16 level with a 669.69% return on investment.
Filecoin focused on security by using proof of spacetime and proof of replication that allow miners to compete serving clients as quickly as they can. As a result, they will be rewarded with FIL fees. Considering the recent price development and possibilities of crypto acceptance from the SEC, we can expect a decent upside pressure in the Filecoin price.
Let’s see the upcoming price direction from the FIL/USDT technical analysis:
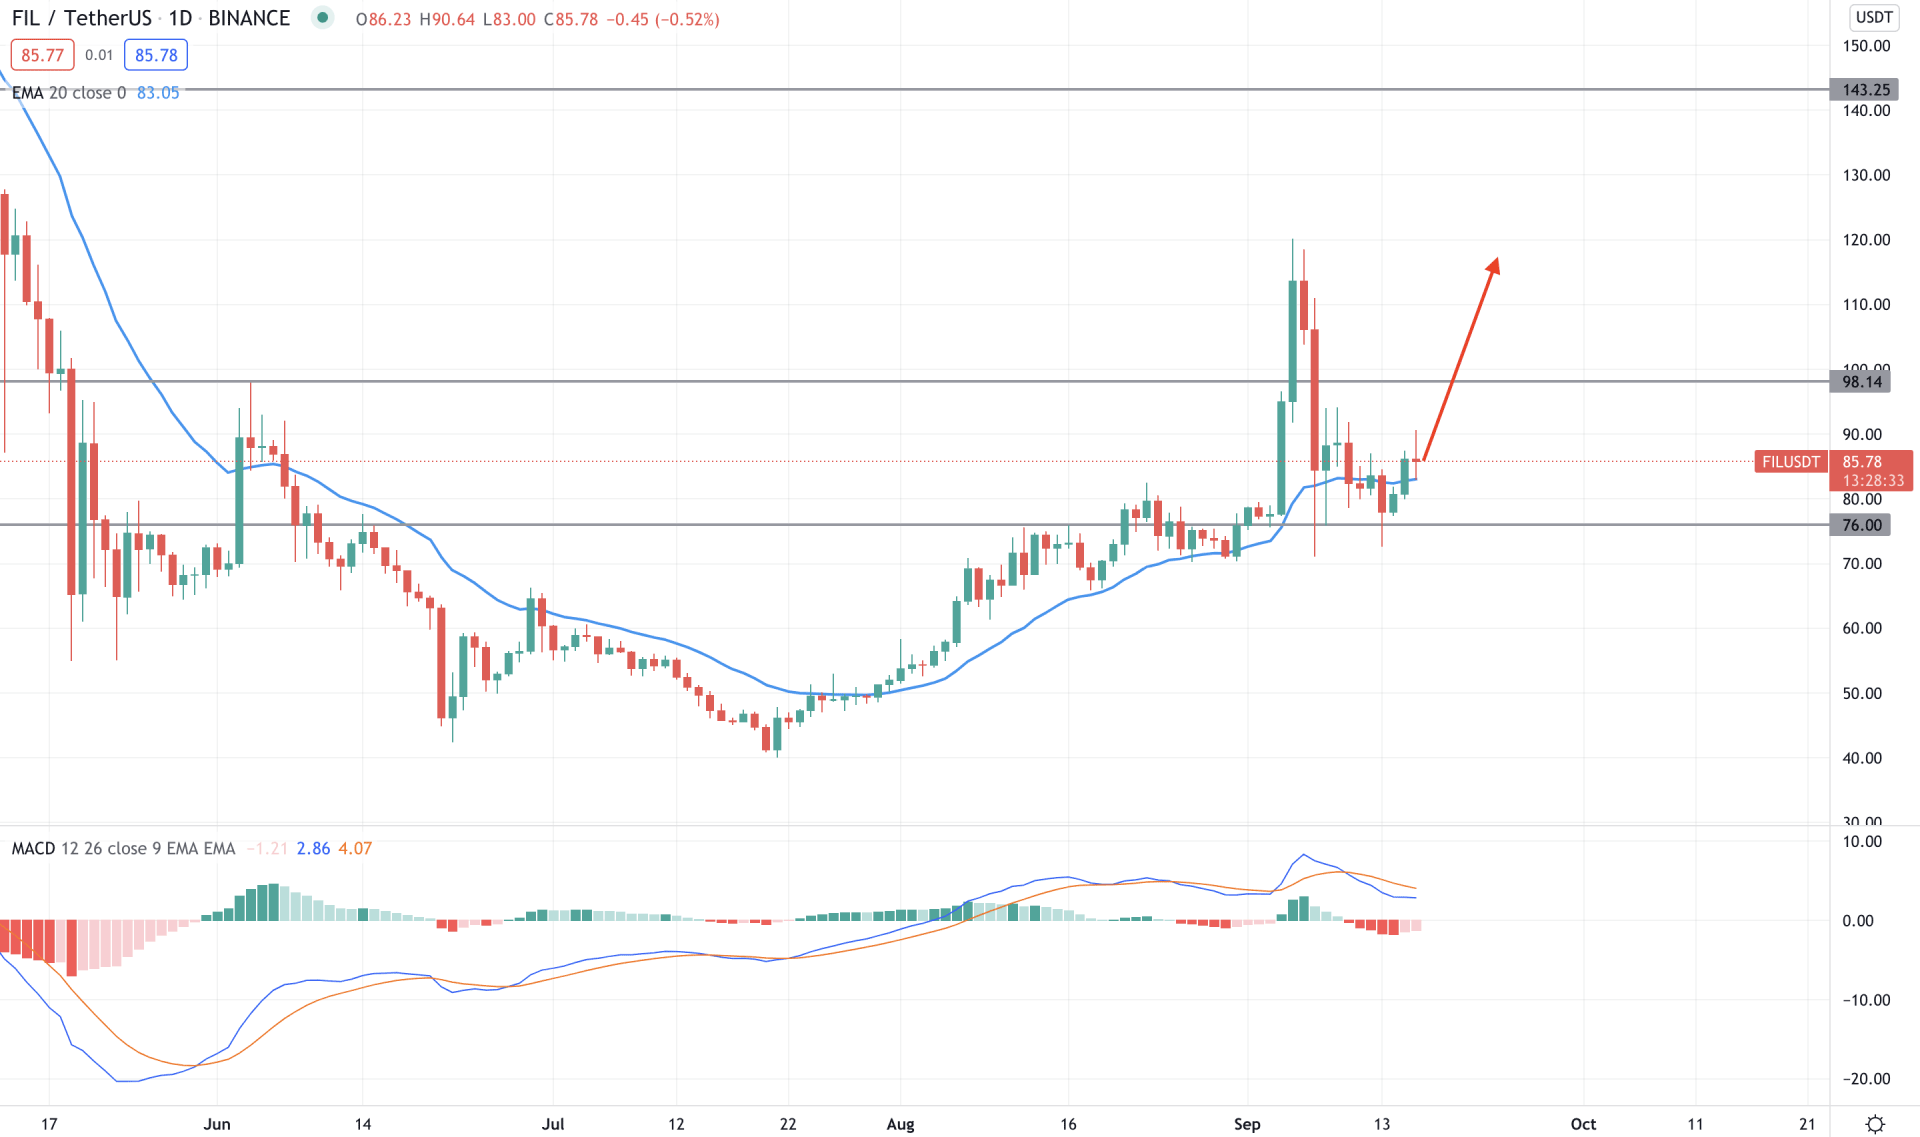
FIL/USDT moved higher above the dynamic 20 EMA on 25 July, pointing out a trend shift from bearish to bullish. However, the probability of extending the bullish pressure came as soon as the price broke the June 4 high of 97.99. The break of the structure was initiated from 70.00 to 76.00 demand zone from where the aggressive bullish movement happened.
However, regulatory concerns affected the broader crypto market where major cryptocurrencies have seen a crash followed by Bitcoin. As a result, FIL/USDT moved down but failed to break below the 76.00 support level. Moreover, the price moved above the dynamic 20 EMA and closed a daily candle while MACD Histograms made higher lows.
In this context, the price is more likely to extend the current bullish pressure as long as bulls hold it above the dynamic 20 EMA. In that case, the bullish pressure may extend towards the 100.00 and even 143.25 area in the coming days.
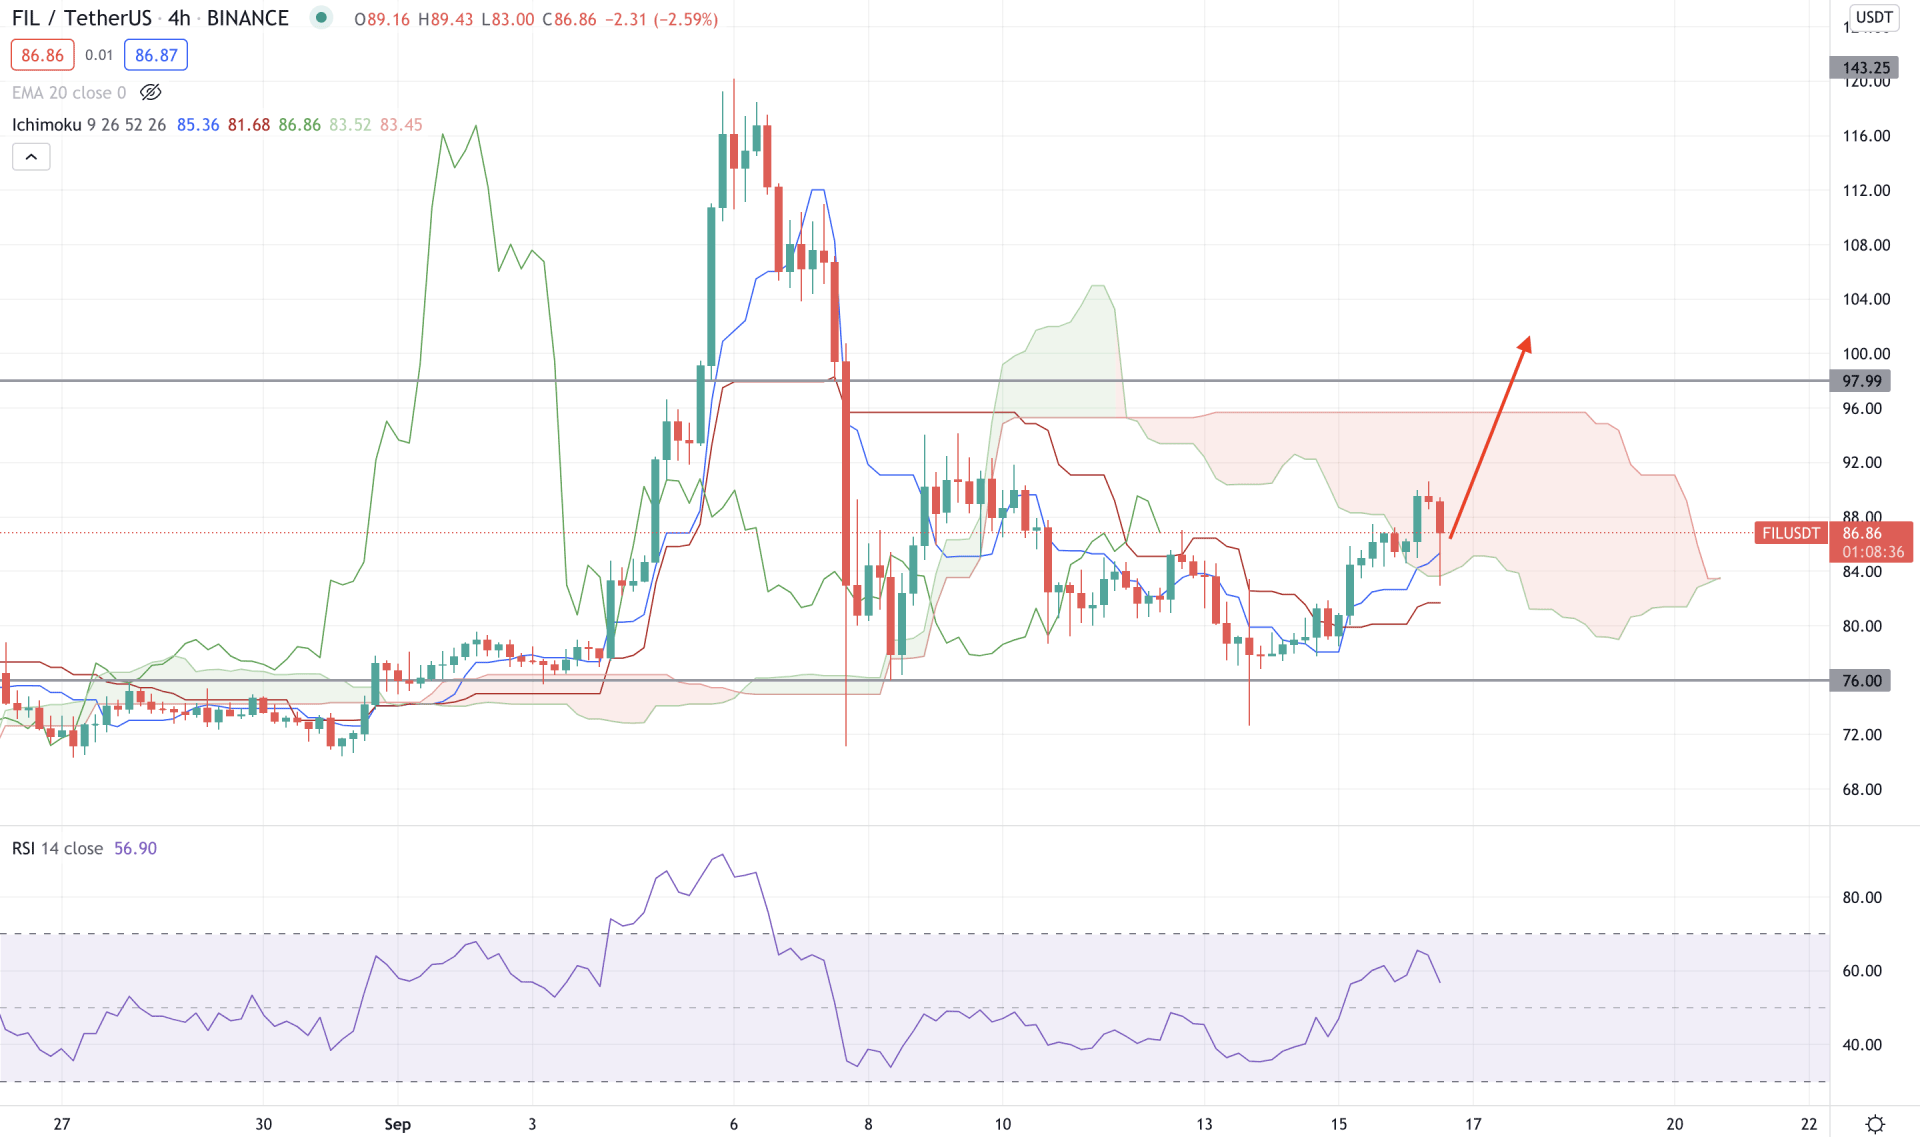
FIL/USDT has shown a bullish possibility as the price failed to break below the 76.00 support level with a long wicked H4 close. As a result, the price moved above the dynamic Tenkan Sen and Kijun Sen, followed by a golden cross. Moreover, the price moved within the Kumo Cloud while the future cloud shifted its direction and Lagging Span moved above the price.
The above image shows how the FIL/USDT trading within the Kumo Cloud where the RSI is above the 50 levels. Therefore, the RSI can reach the overbought 70 levels with a bullish momentum in the price. In that case, the price may reach the 97.99 resistance level in the coming session.
On the other hand, the price is still within the Kumo cloud, where a break below the dynamic Kijun Sen may alter the current market structure and take the price below the 76.00 support level.
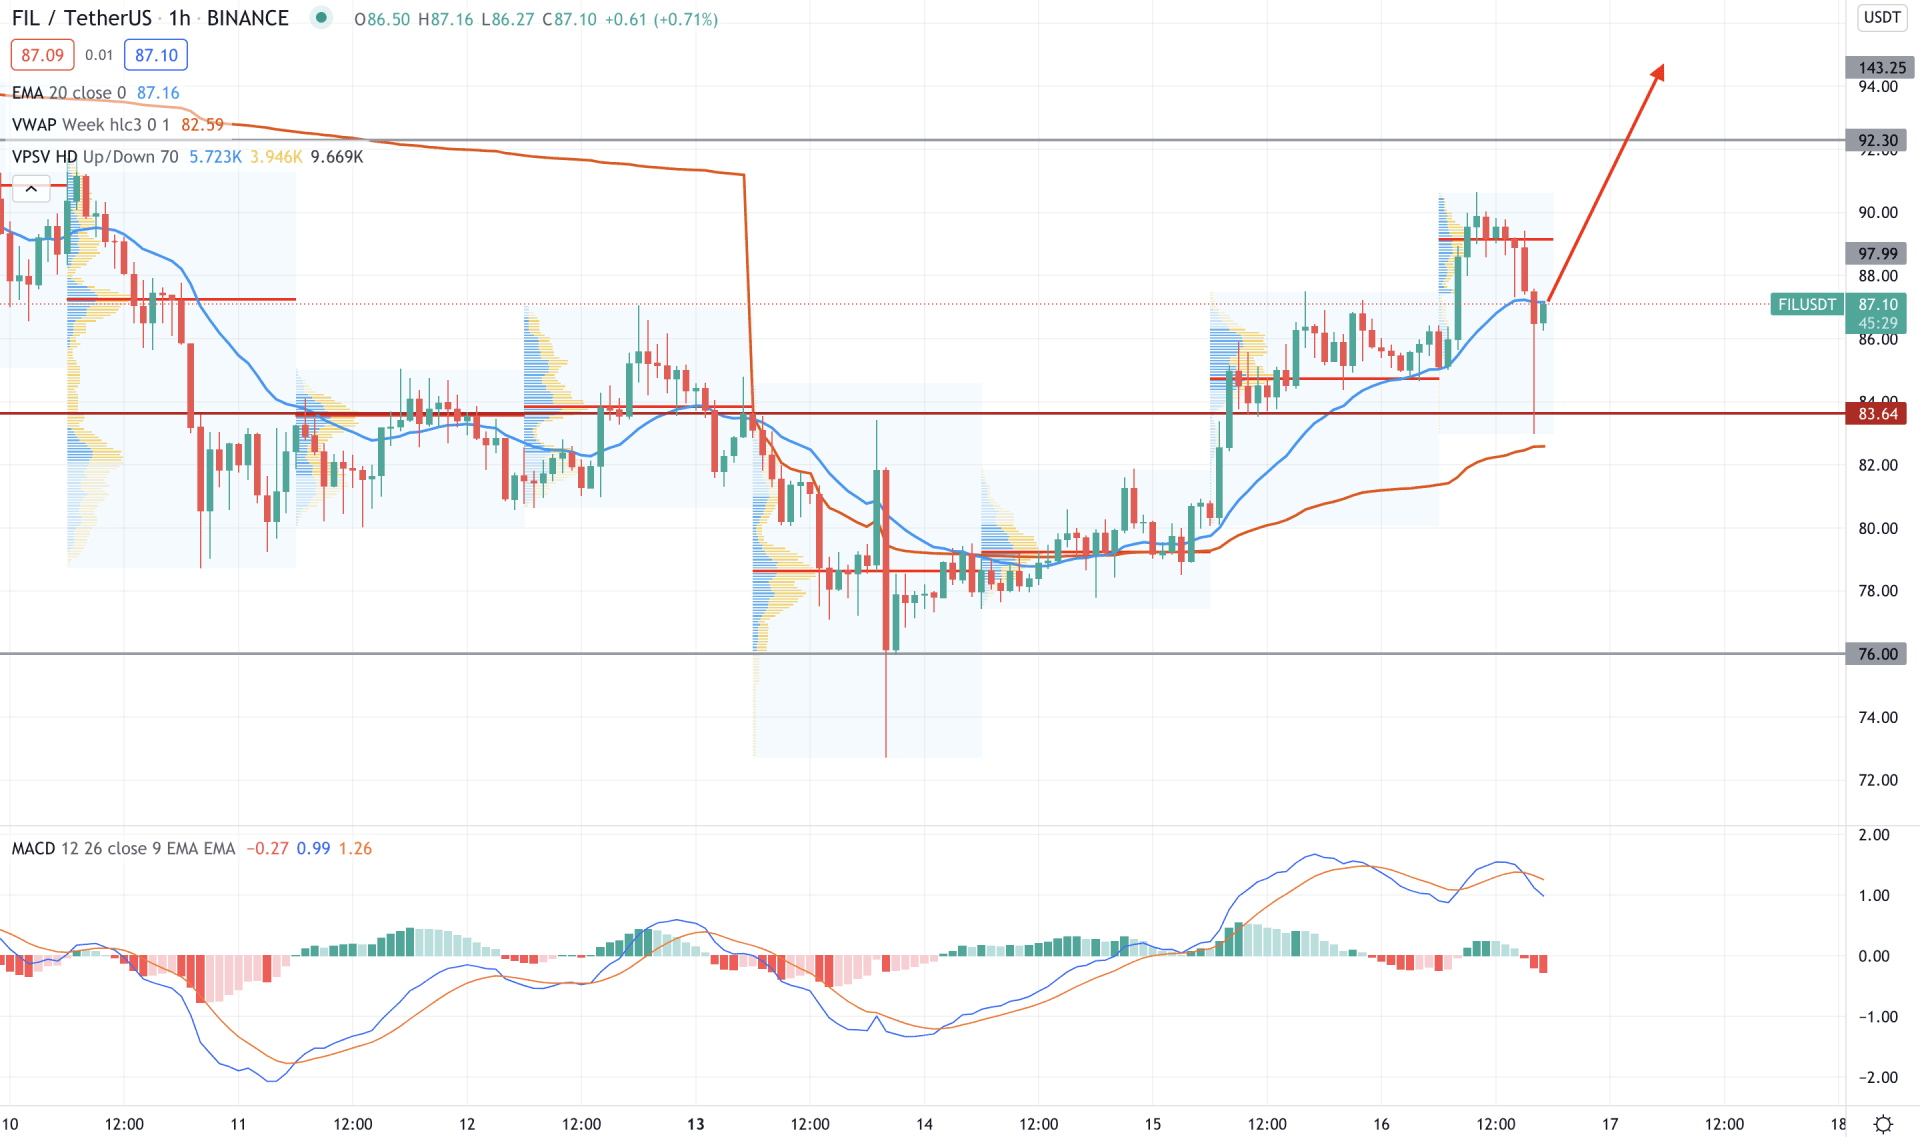
FIL/USDT is trading within a bullish pressure in the intraday chart as the price is exhausted from the 83.64 intraday support level. Moreover, the price is trading above the dynamic support from weekly vwap, which indicates an upcoming bullish pressure.
The above image shows that the price made consecutive highs in the intraday high volume level before moving down below the dynamic 20 EMA with a bearish H1 close. Meanwhile, the MACD Histogram is still bearish with Negative-Positive-negative formation. In that case, if the price moves above the dynamic 20 EMA, we can expect an expansion to the current bullish pressure. On the other hand, the bearish pressure may extend if the price moves below the 76.00 level with a bearish H1 close.
As of the above discussion, we can say that the FIL/USDT has a higher possibility of extending the bullish pressure considering the current price action and the possibility of crypto acceptance by the SEC.
In that case, investors should wait for the price to move above the dynamic 20 EMA on the H1 chart to rely on the possible bullish pressure. Conversely, a sharp bearish H4 close below the dynamic Kijun Sen may take the price lower towards the 68.00 level.