
Published: February 24th, 2022
Exxon Mobil (XOM) tends to follow the rise and fall of crude oil, which is currently trading at the seven years high. Moreover, the recent Q4 earnings report opened a bullish opportunity for this instrument as investors have seen a better earnings report.
On 1 February, Exxon reported the Q4 earnings report here the earnings per share came at $2.05, beating analysts expectation of $1.95 a share. Moreover, the revenue came at $84.97 billion, 82% above the previous quarter but below the consensus view.
During the quarter, the capital spending moved higher to $5.8 billion, which was remained in line while the cash flow hit $48 million, the highest level since 2012. Besides showing the better-than-expected business performance, the management announced reorganizing the business into three units where chemicals and refining divisions combine into a single segment. In addition, as a part of the COVID-19 loss recovery, the business has planned to return up to $10 billion capital to shareholders through a share buyback.
Another sentiment that might work as a bullish factor for XOM stock is the recent surge in oil price. Due to the current uncertainty from Russia and Ukraine, the global financial market has faced volatility where the Oil price reached seven years high, and Exxon Mobil Stock (XOM) may follow the oil sentiment by aiming higher.
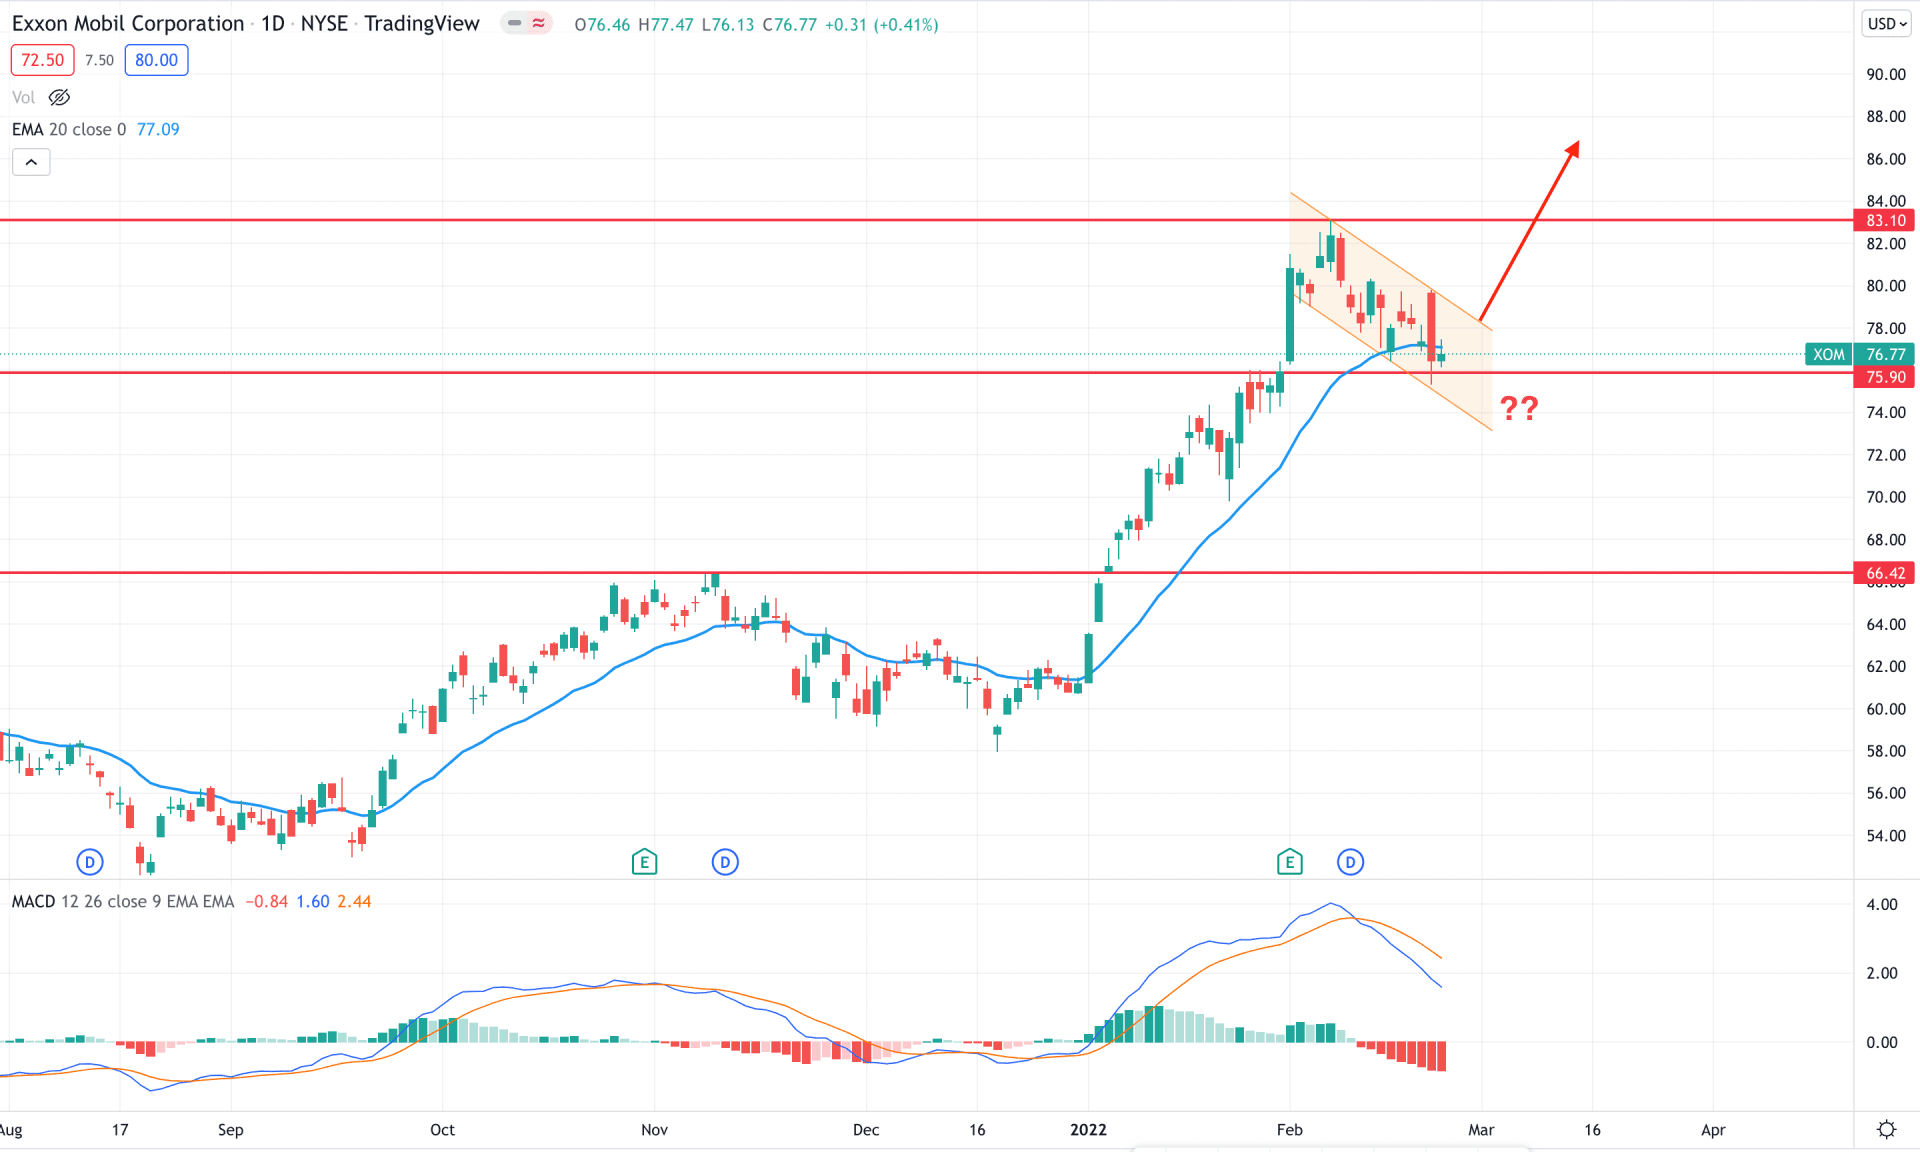
According to the Exxon Mobil Stock (XOM) daily chart, the existing market trend is bullish, where the bull run from the 57.96 level pushed the price up towards the 83.10 level without a considerable correction. The price remained steady adobe the dynamic 20 EMA, where the most recent price charts showed a minor correction from the dynamic level. In that case, investors should closely monitor how the price trades at the dynamic 20 EMA and static 75.90 level, where a bearish channel breakout might open a bullish opportunity.
The above image shows how the price formed a daily candle below the dynamic 20 EMA and rebounded immediately. On the other hand, the MACD Histogram remained steady bearish while the MACD line showed a downside pressure.
In this context, investors should monitor how the daily price trades within the bearish channel. Any bullish daily candle above the channel resistance with a buying pressure is more likely to increase the price towards the 90.00 area. On the other hand, any selling pressure below the 74.00 level would open rooms for testing the 66.42 support level.
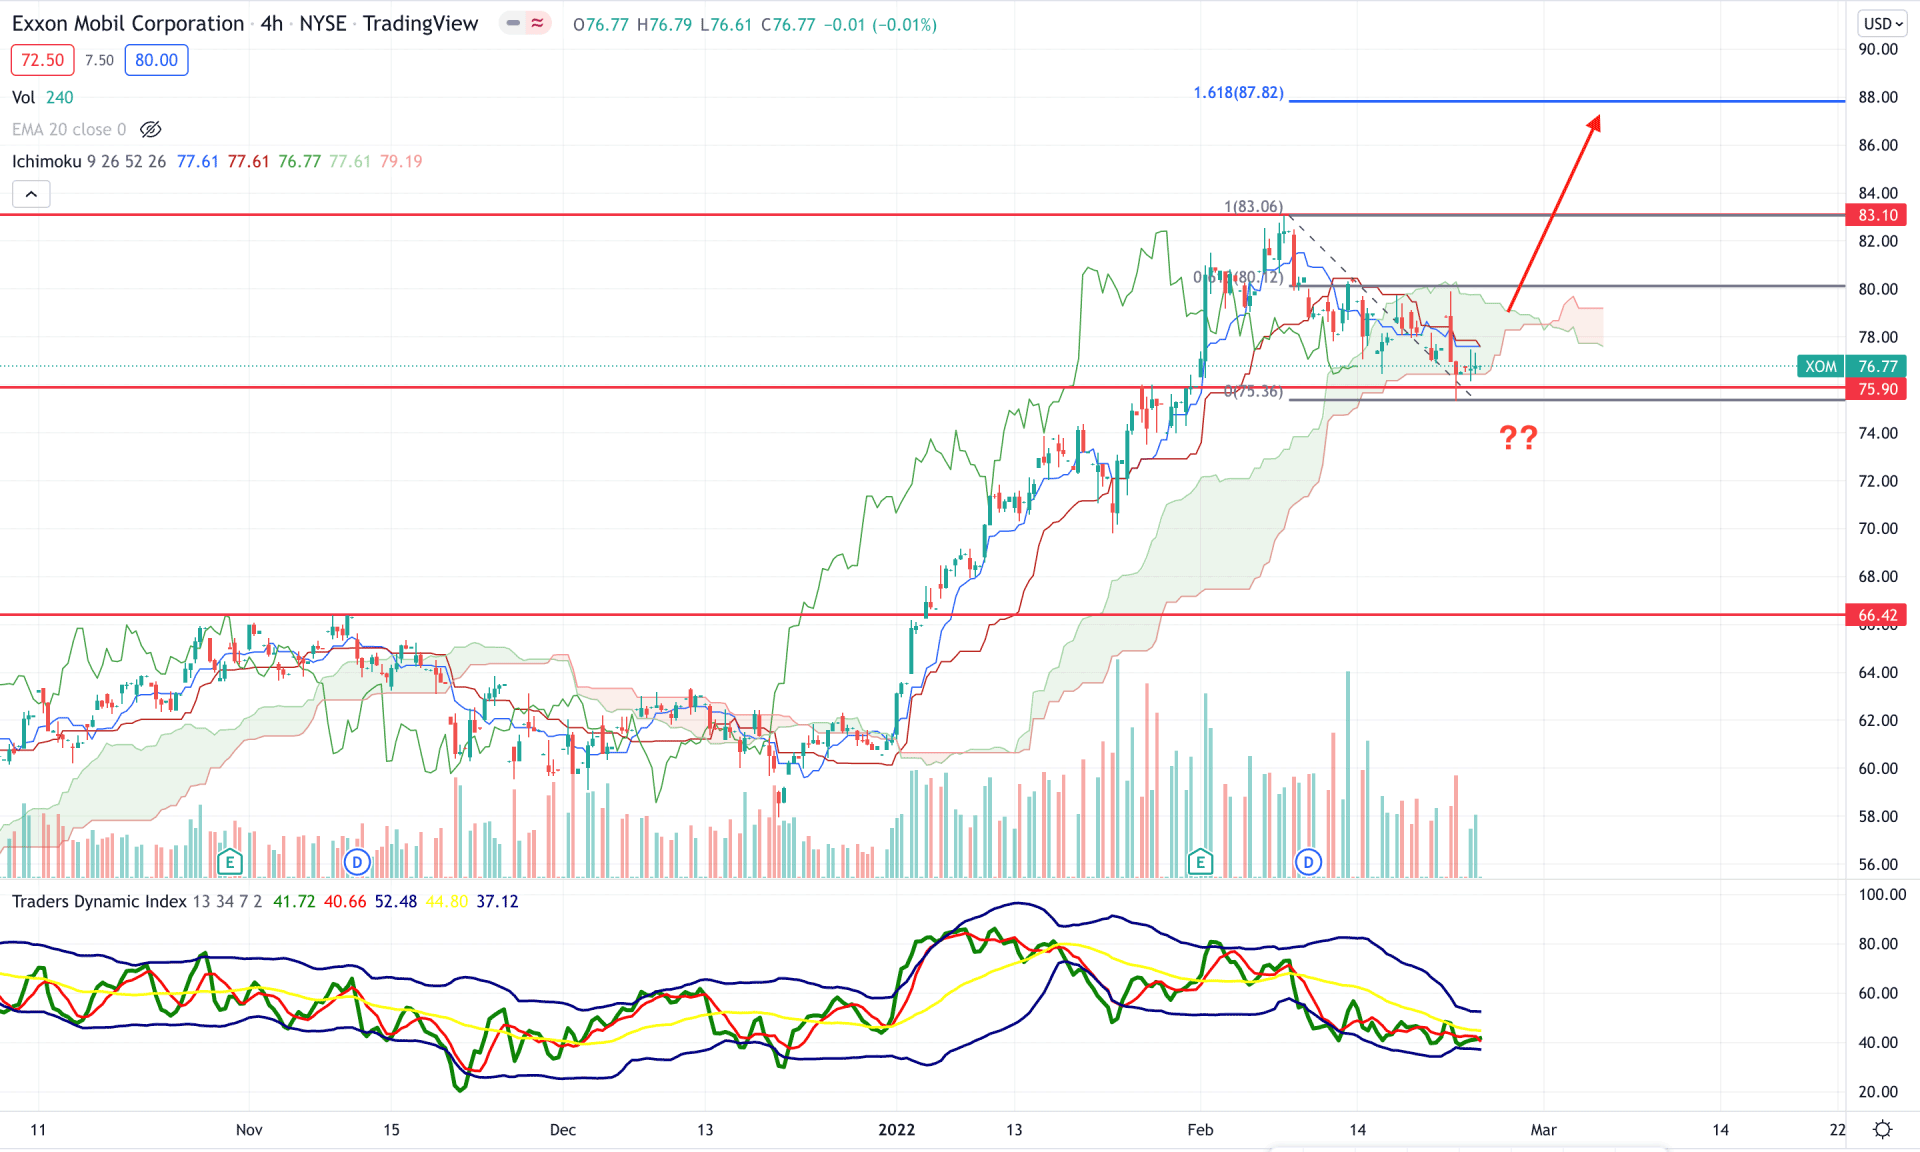
According to the Ichimoku Cloud analysis, XOM is trading within a strong uptrend where the recent bearish correction failed to show a stable momentum below the Kumo Cloud. Although the Senkous Span A is below the Senkou Span B in the future cloud, any rebound in the price above dynamic levels would eliminate the current bearish correction.
The above image shows how the trader's dynamic index is heading within a corrective movement. Therefore, any bullish indication by taking the TDI line above 50 levels would be a buying opportunity for XOM stock.
As per the current price structure, investors should find the price above the dynamic Kijun Sen with a bullish H4 close that would open rooms for testing the 87.80 level, 161.8% Fibonacci extension of the correction bearish pressure. On the other hand, the break below the 74.00 level with a bearish H4 candle would lower the price towards the 66.00 area.
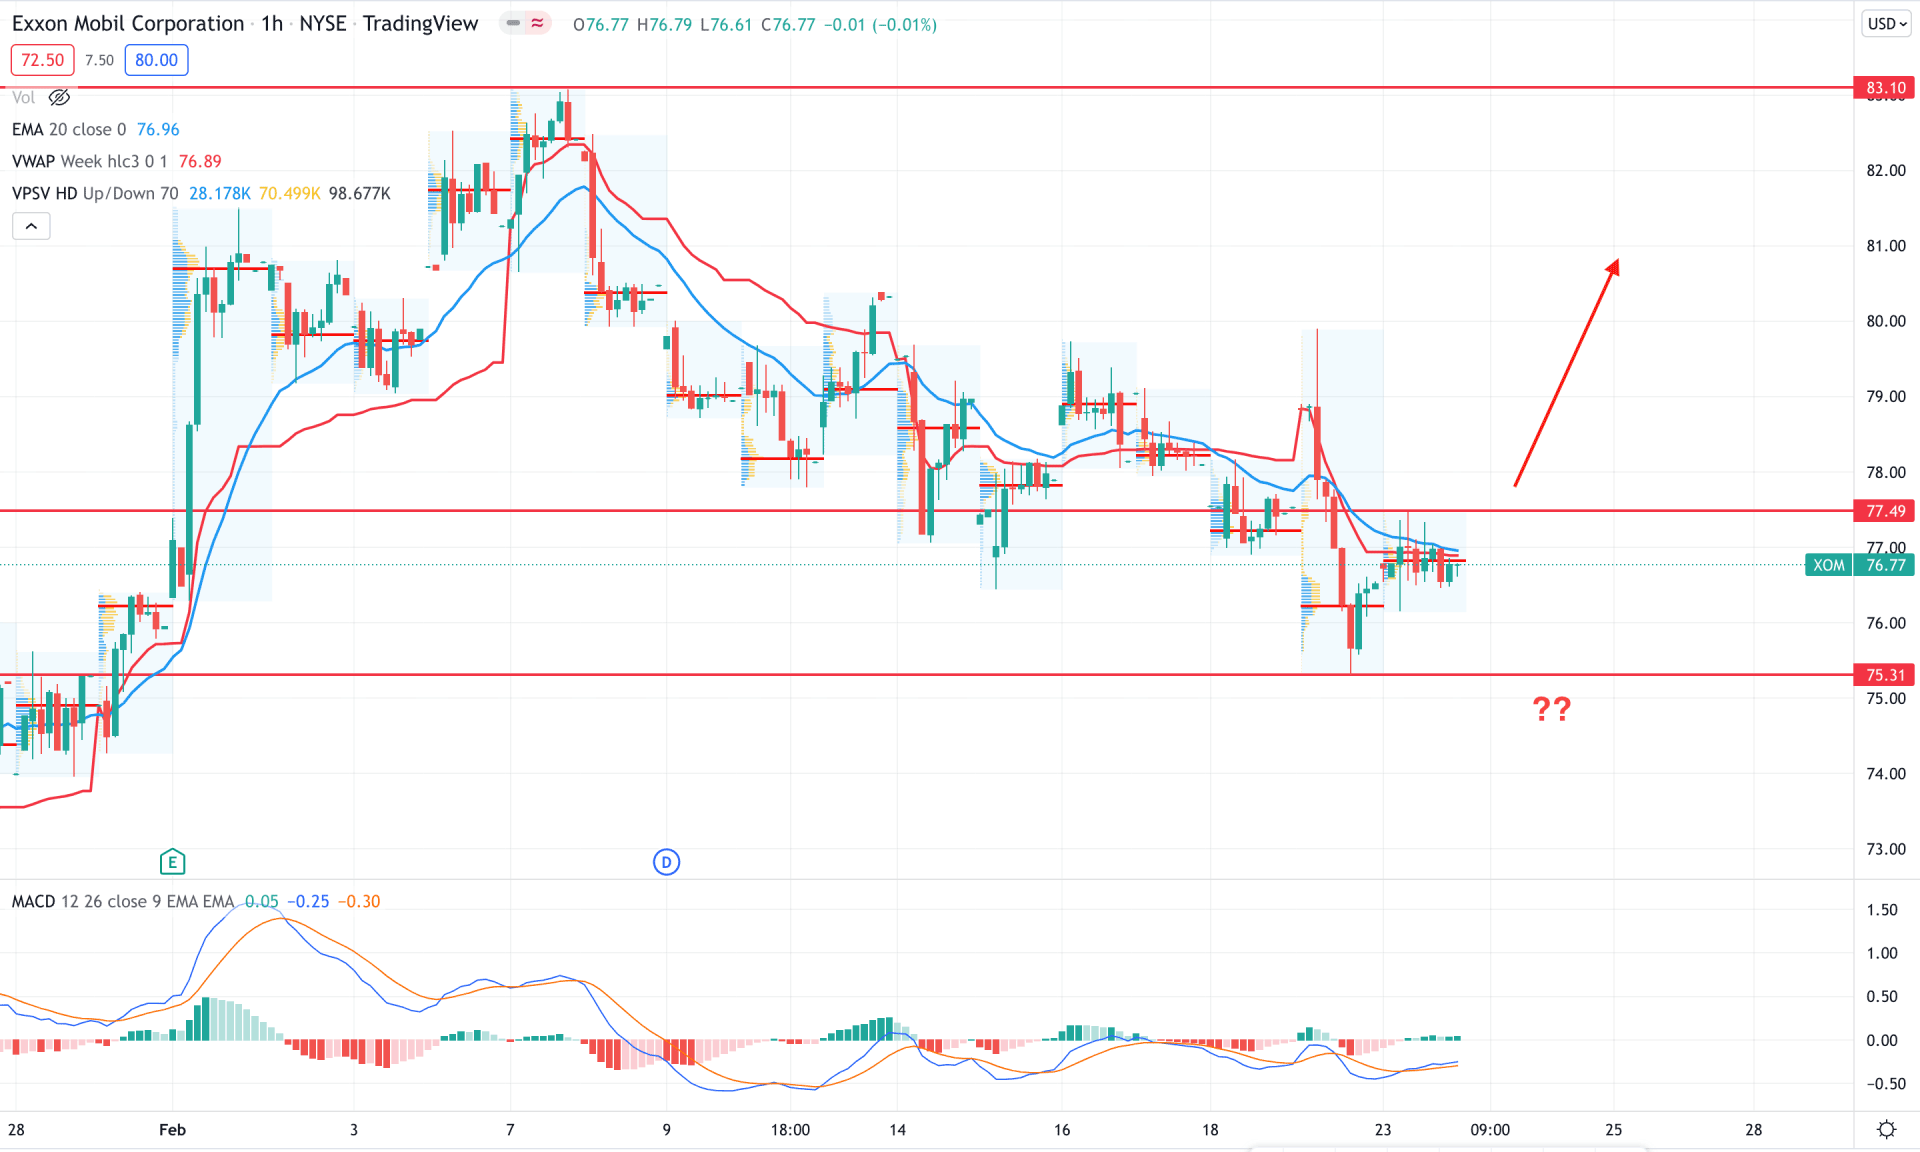
In the intraday chart, Exxon Mobil stock is trading within a corrective selling pressure in the intraday chart, where the most recent price is trading below the dynamic 20 EMA. Moreover, the intraday high volume is above the current price while the near-term resistance is at the 77.49 level.
The above image shows how the price formed a corrective structure at the dynamic 20 EMA level where the MACD histogram is bullish. Therefore, if an H1 candle appears above the 77.49 static level with a bullish momentum, the next target level would be at 83.00 area. On the other hand, the break below the 75.31 level with a bearish H1 close might alter the current market structure and lower the price in the coming hours.
As per the current market context, XOM is more likely to extend the current bullish pressure following the broader market context from the Oil price. In that case, a reliable buying position from dynamic Kijun breakout might provide the most reliable buying opportunity in this instrument.