
Published: December 21st, 2021
Investors are experiencing a muted week due to the upcoming holiday season both for Euro and NZD, while institutional investors are winding up liquidity from the market. As a result, the upcoming trading days may come with less trading activity with higher volatility. Due to this, the EURNZD price may move rangebound, where the 1.6912 is the ultimate barrier for bears.
Main indexes from Wall Street have seen a negative sentiment on Monday, where Asian indexes recovered the early loss on Tuesday. On the other hand, the Omicron sentiment is driving the forex market with uncertainty. The US has reported the first Omicron-related death on Monday, where the new variant has been in the world for the last three months. On the other hand, Prime Minister Boris Johnson said they are taking all actions to keep the infection rate down in the UK. Based on the current sentiment, investors should apply a sound risk management system to avoid unexpected stops due to the absence of enough liquidity.
In the Eurozone, the volatility came as soon as the ECB policymaker Peter Kazimir said that the risk of inflation might stay longer than expected. In that case, the Euro might need more time to get a stable position against the basket of currencies.
Let’s see the upcoming price direction from the EURNZD technical analysis:
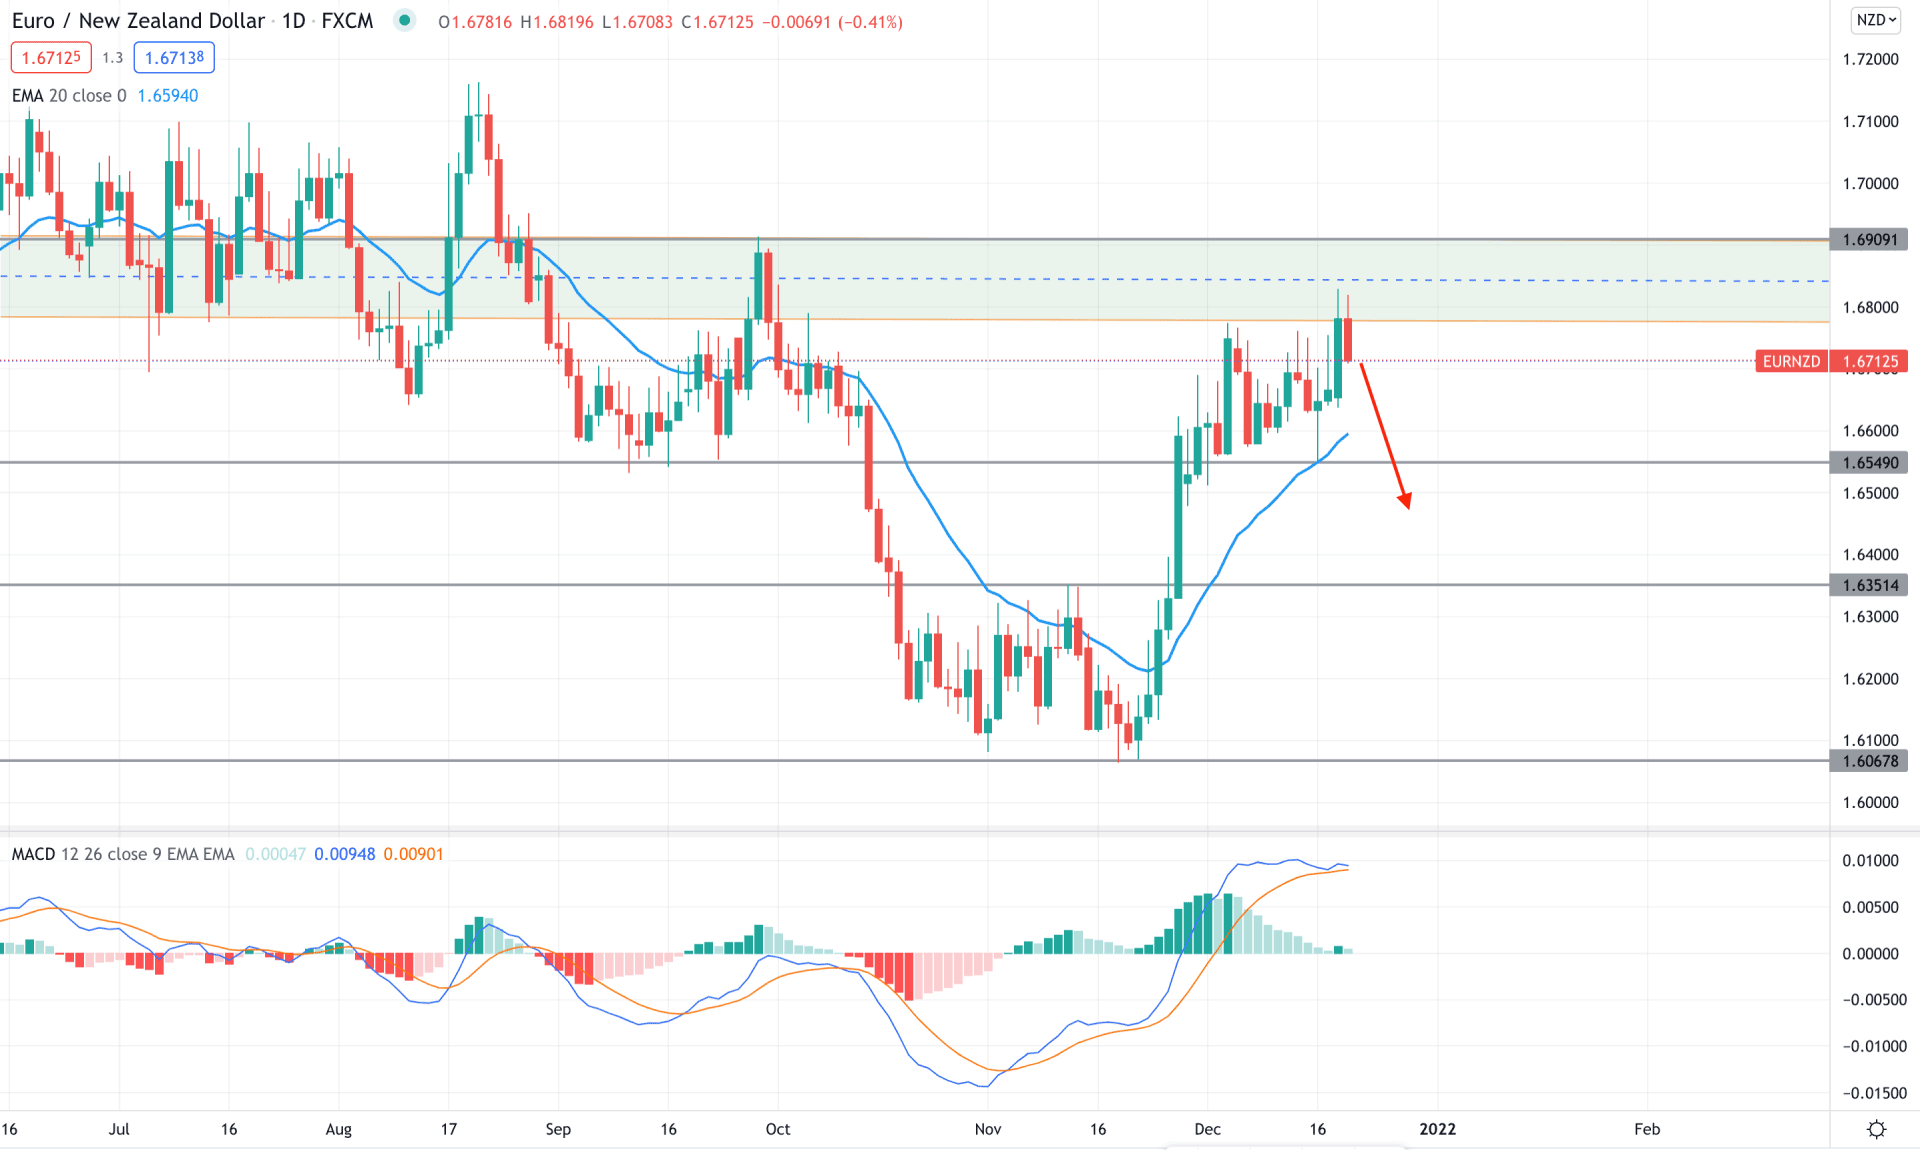
EURNZD is trading within a broader bearish trend where the last 2-3 months price action showed a consecutive lower low, pointing out that bears are active. However, the massive selling pressure from 1.6909 was very aggressive and made 900 pips of gain to bears. However, after consolidation at the 1.6067 swing low, the price tried to move up and found a barrier at the 1.6780 to 1.6900 area as a vital supply zone. The bearish break of structure from the supply zone with a corrective rebound signifies that bears may reopen their positions to fill their orders before taking the price down.
The above image shows how the price trades above the dynamic 20 EMA. Meanwhile, the MACD Histogram is bullish but losing momentum. Therefore, any Negative Histogram below the neutral line with a bearish price action would be a selling opportunity in this pair. The primary target of the possible bearish pressure would be the 1.6351 support level. On the other hand, a bullish break above the 1.6910 with a daily candle would eliminate the current market structure and extend the price towards the 1.7100 area.
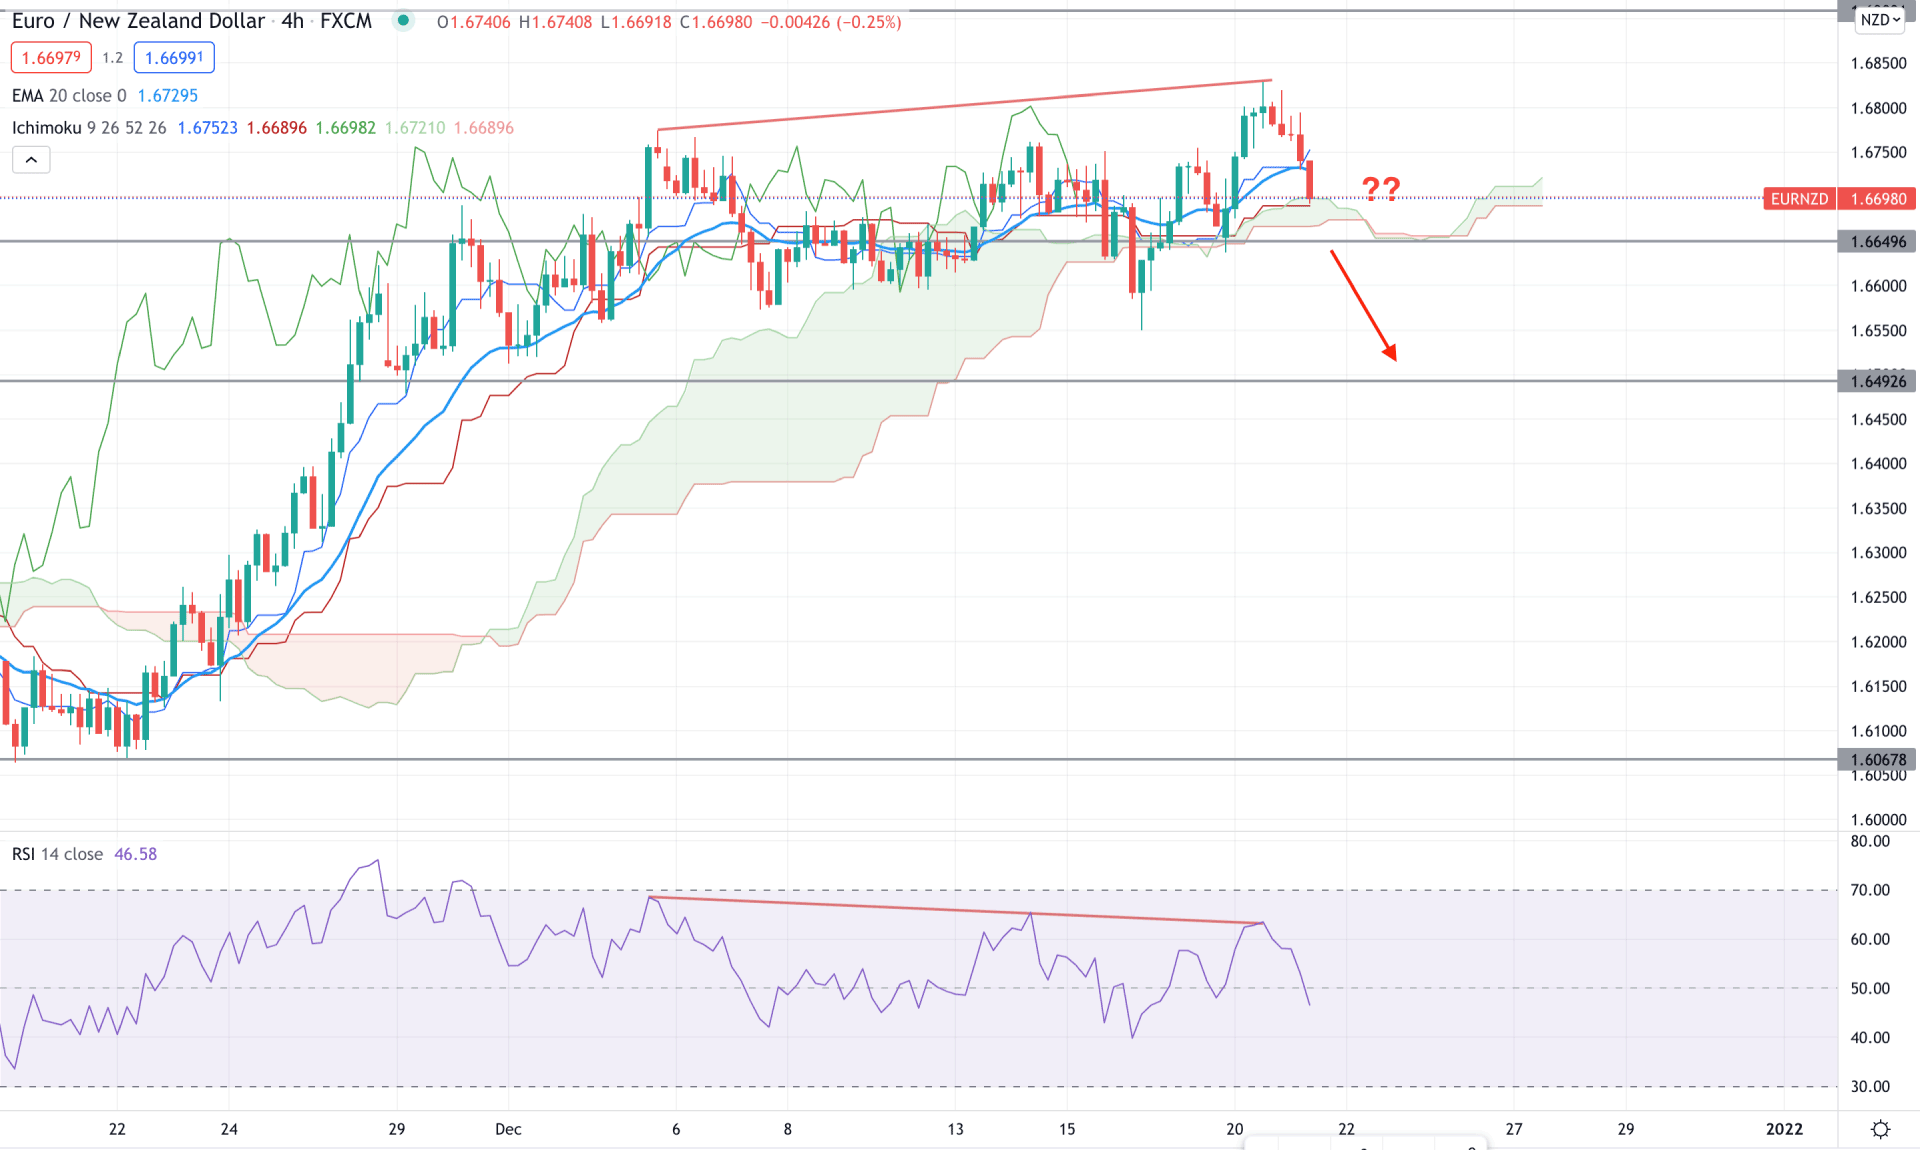
According to the Ichimoku cloud, the EURNZD price is trading within the Cloud support with bullish momentum. However, the price became corrective after moving above the 1.6649 event level. Moreover, the Senkou Span A is above the Senkou Span B with a narrow spread in the future cloud. Therefore, a bearish breakdown from cloud support is more likely to take the price down for the coming hours.
The above image shows how the price formed a divergence with the RSI line where the current RSI line is below 50 lines and approaching to 30 level. Based on this price structure, an H4 candle below the 1.6649 event level is more likely to take the price lower towards the 1.6492 level. On the other hand, any rebound from the 1.6649 with a bullish H4 rejection would be a buying opportunity in this pair, where the primary aim is to test the 1.7100 resistance level.
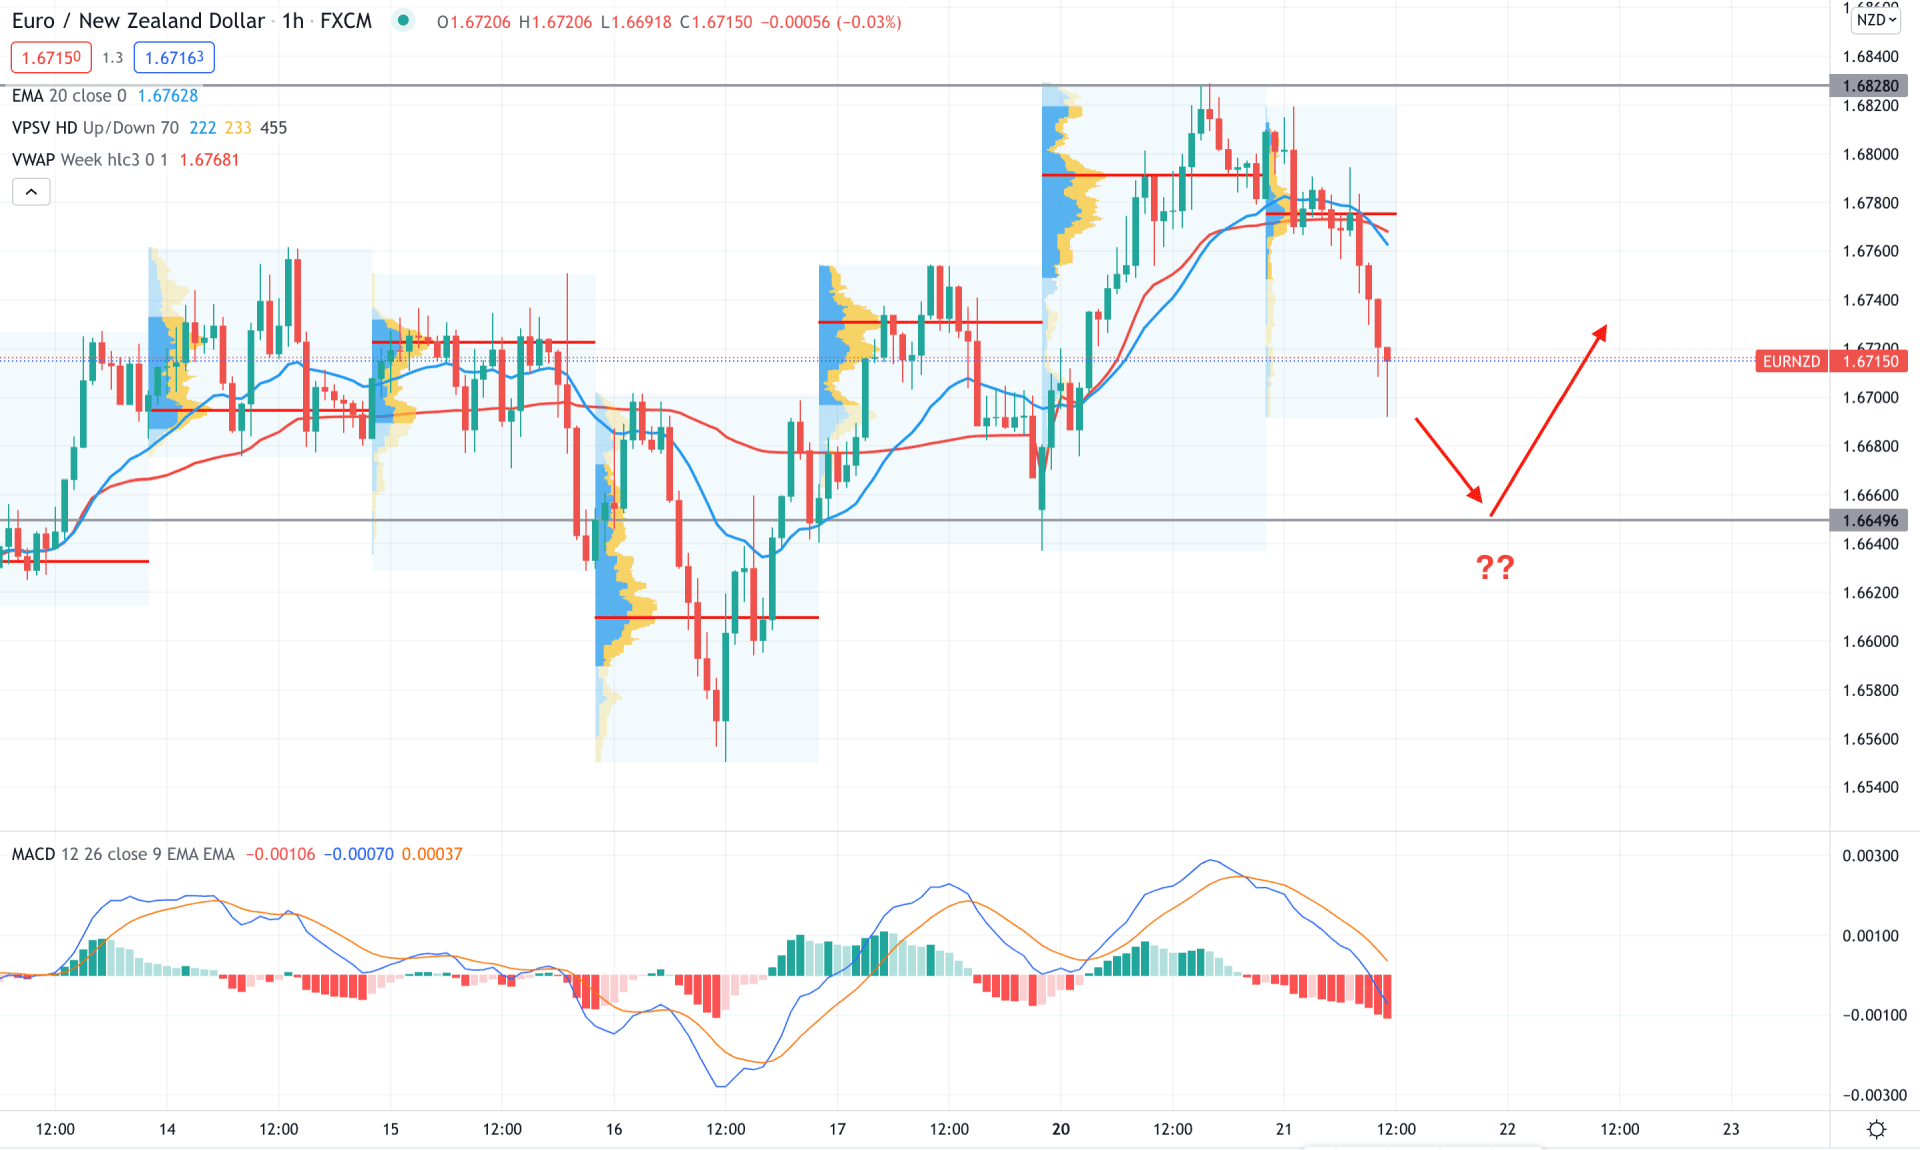
In the intraday chart, EURNZD price made a swing high at 1.6828 and moved down below the intraday high volume level of 1.6775. Moreover, the bearish pressure was aggressive that pushed it to move below the dynamic 20 EMA. Therefore, as long as the price trades below the dynamic level, it may test the 1.6649 support level in the coming hours.
The above image shows that the MACD Histogram is bearish and aiming lower, which opens room for a possible bearish pressure in the price. Overall the current selling pressure may extend as long as the price trades below the dynamic 20 MEA and weekly VWAP on the H1 timeframe. In that case, the primary target would be 1.6560, where 1.6828 is the invalidation level.
As of the current observation, EURNZD bears have a higher possibility of taking the price down towards 1.6351 in the coming days. However, investors should closely monitor how the daily candle closes below the current supply area. Any rebound with a bullish D1 candle above 1.6900 may eliminate the bearish possibility and increase the buying pressure.