Published: February 9th, 2022
European central bank left the statement unchanged where the only difference from the December statement was the preparation to adjust its instrument in either direction. The Bank expects the PEPP program to end in March with the APP purchase before the rate hike. The Q1 growth was solid despite the recent surge in the Omicron infection rate that indicates that Europeans have become familiar with leading lives with the virus.
In the latest ECB rate decision, Lagarde mentioned that the bank has no intention to raise the interest rate as the inflation rate might be elevated longer than expected. After the news, EUR was seen to skyrocket against the basket of currencies, and for EURNZD, it reached the multi-year high.
In New Zealand, the employment data for the fourth quarter came with a mixed sentiment where the unemployment rate moved dhow from 3.4% to 3.2% and remained at the lowest level since 1986. However, wages and hourly earnings increased by 3.8% q/q, which might push the RNZ to raise the interest rate in their February meeting.
Let’s see the upcoming price direction from the EURNZD technical analysis:

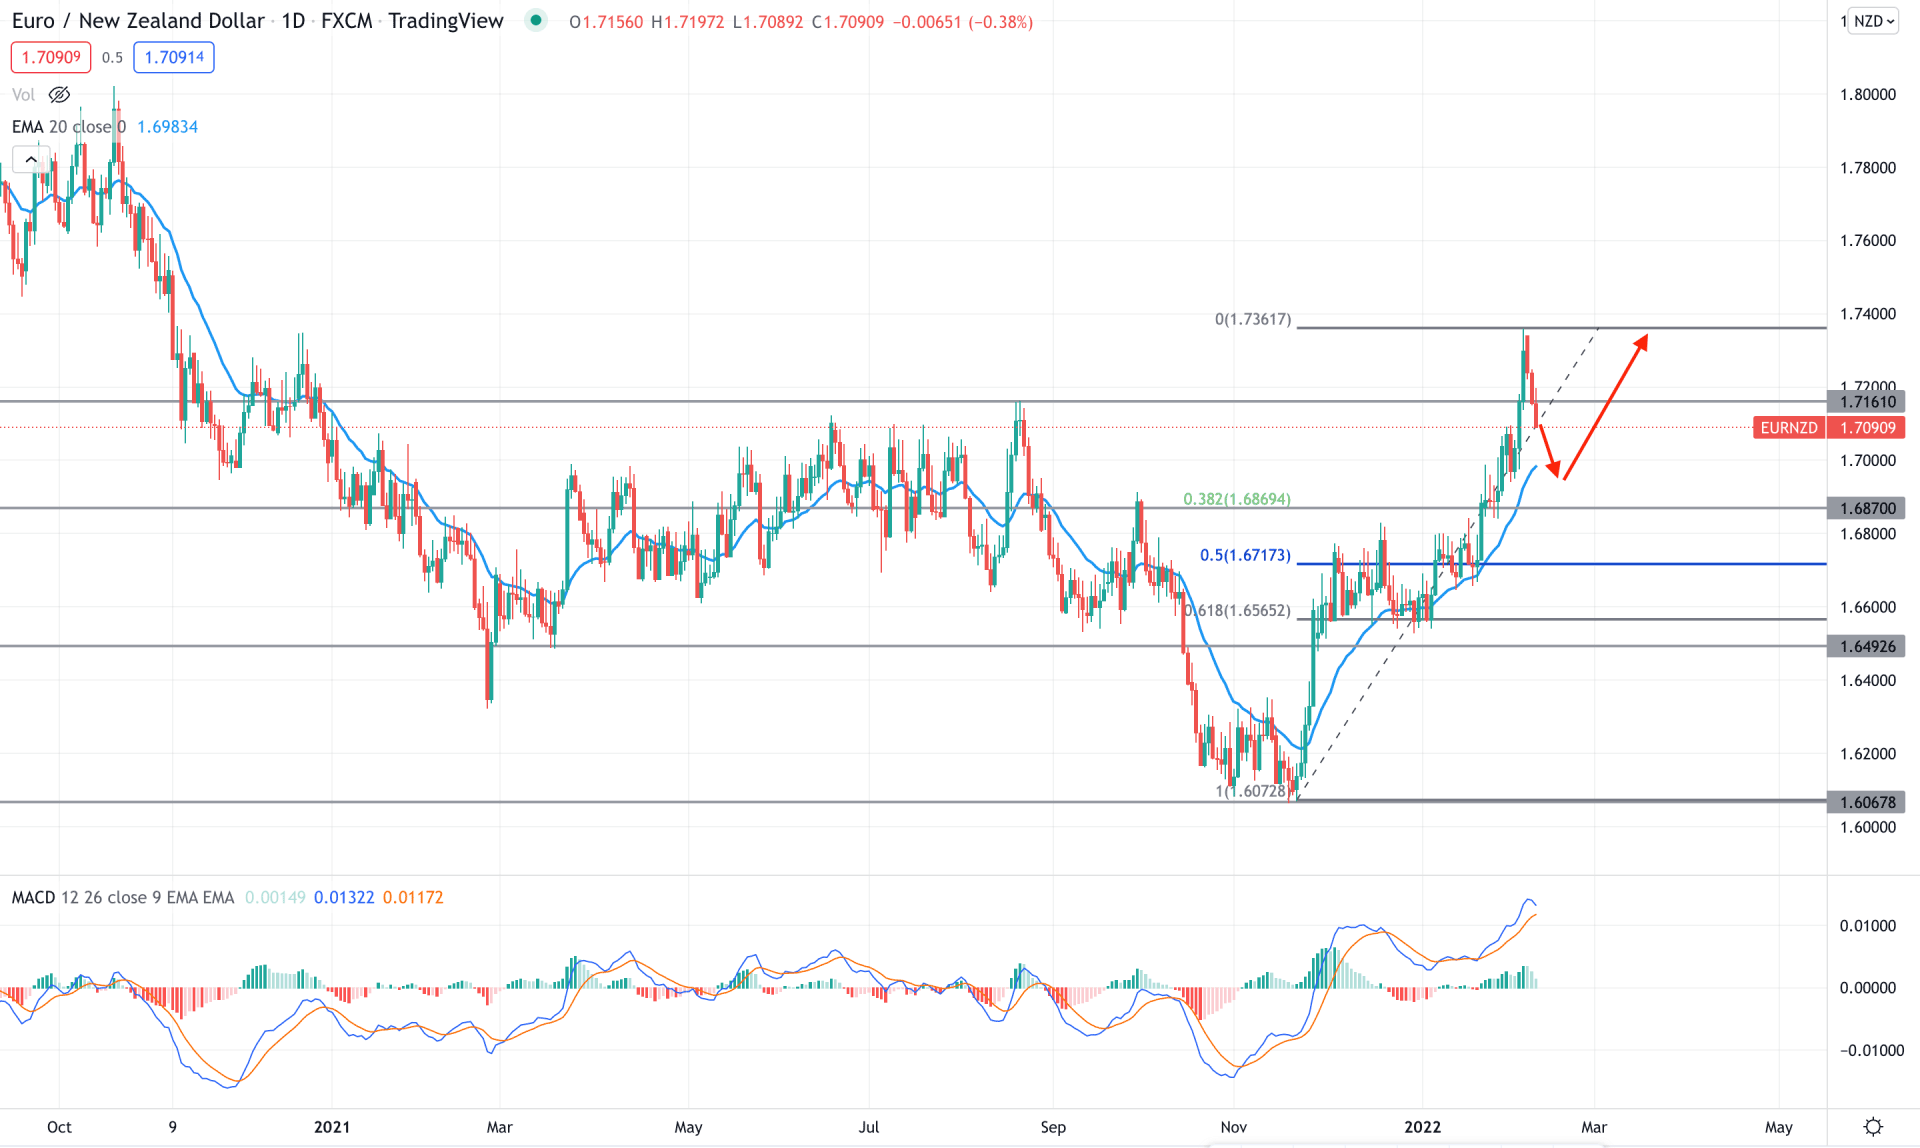
In the EURNZD daily chart the multi year swing low at 1.6067 recovered immediately with a counter impulsive momentum that pushed the price higher and formed a new swing high at 1.7358 level. Therefore, the bullish break of structure with a the impulsive pressure is a sign that bulls have taken control over the price. In that case, any dip in the existing swing would be a potential buying opportunity in this pair.
If we draw the Fibonacci Retracement level from the November 2021 swing low to January 2022 swing high we would see that the price is still above the 50% and 61.8% Fibonacci Retracements levels while the dynamic 20 EMA is below the price. Therefore, the price is likely to come lower towards the dynamic 20 EMA before showing any buying sign.
Based on the current price structure, investors may experience the price to come lower in the coming days where any bullish rejection from intraday price chart would be a buying opportunity towards new swing high.

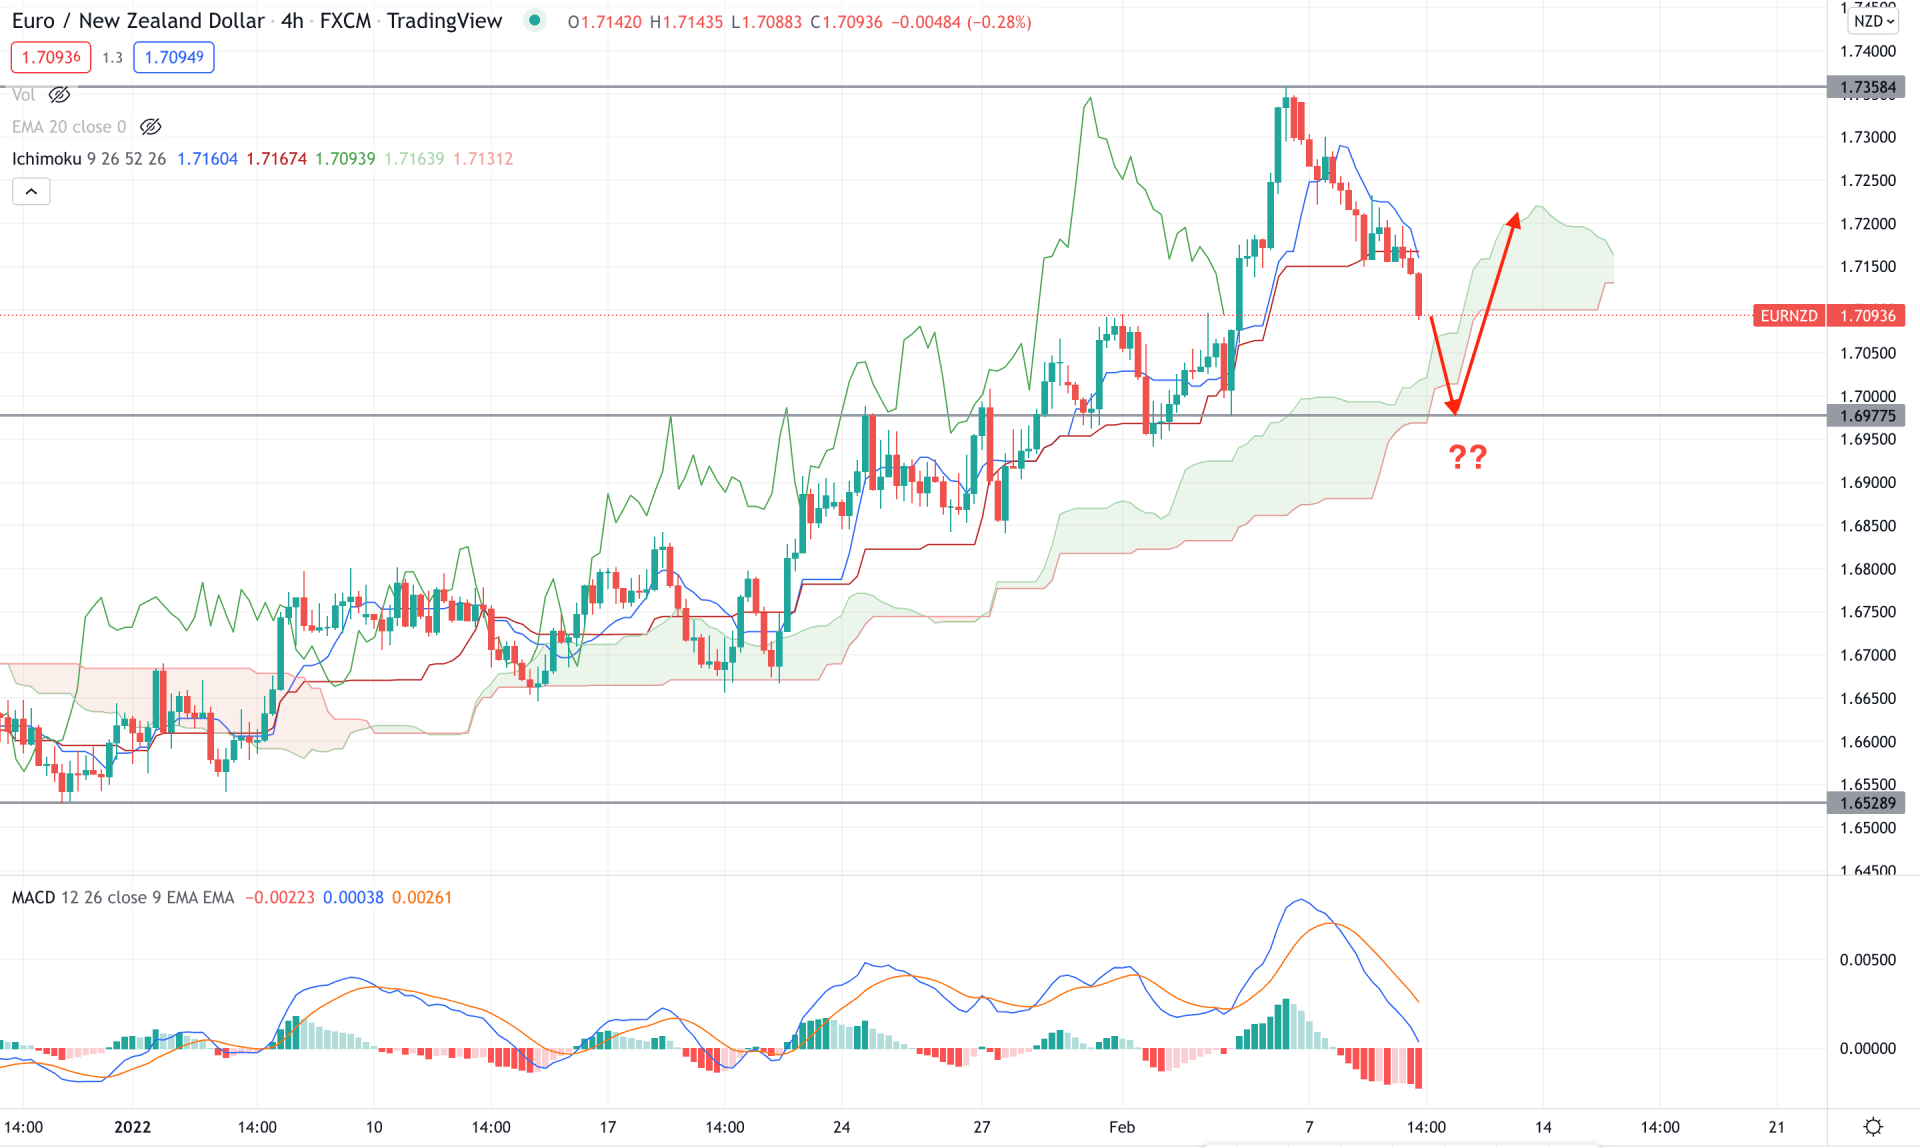
According to the Ichimoku Kumo Cloud, EURUZD H4 chart is trading within a broader bullish trend where the current price is above the Kumo Cloud for a considerable time. However, after testing the 1.7358 level the price started to show a bearish correction and moved below dynamic Tenkan Sen and Kijun Sen, indicating a possible correction in the bullish trend. In that case, the buying pressure may continue if the price remains steady above the Cloud support area.
The above image shows how the MACD Histogram moved lower with a selling pressure where a bearish crossover is forming with dynamic Tenkan Sen and Kijun Sen. In that case, the trend following system needs a close attention to the price before joining the rally.
Based on the current price structure, investors should closely monitor how the price trades at the 1.6977 area where a bullish rejection and H4 close above the dynamic Tenkan Sen would be a potential buying opportunity. On the other hand, a break below the 1.6977 level with a bearish H4 candle may alter the current market structure and lower the price towards the 1.6800 area.

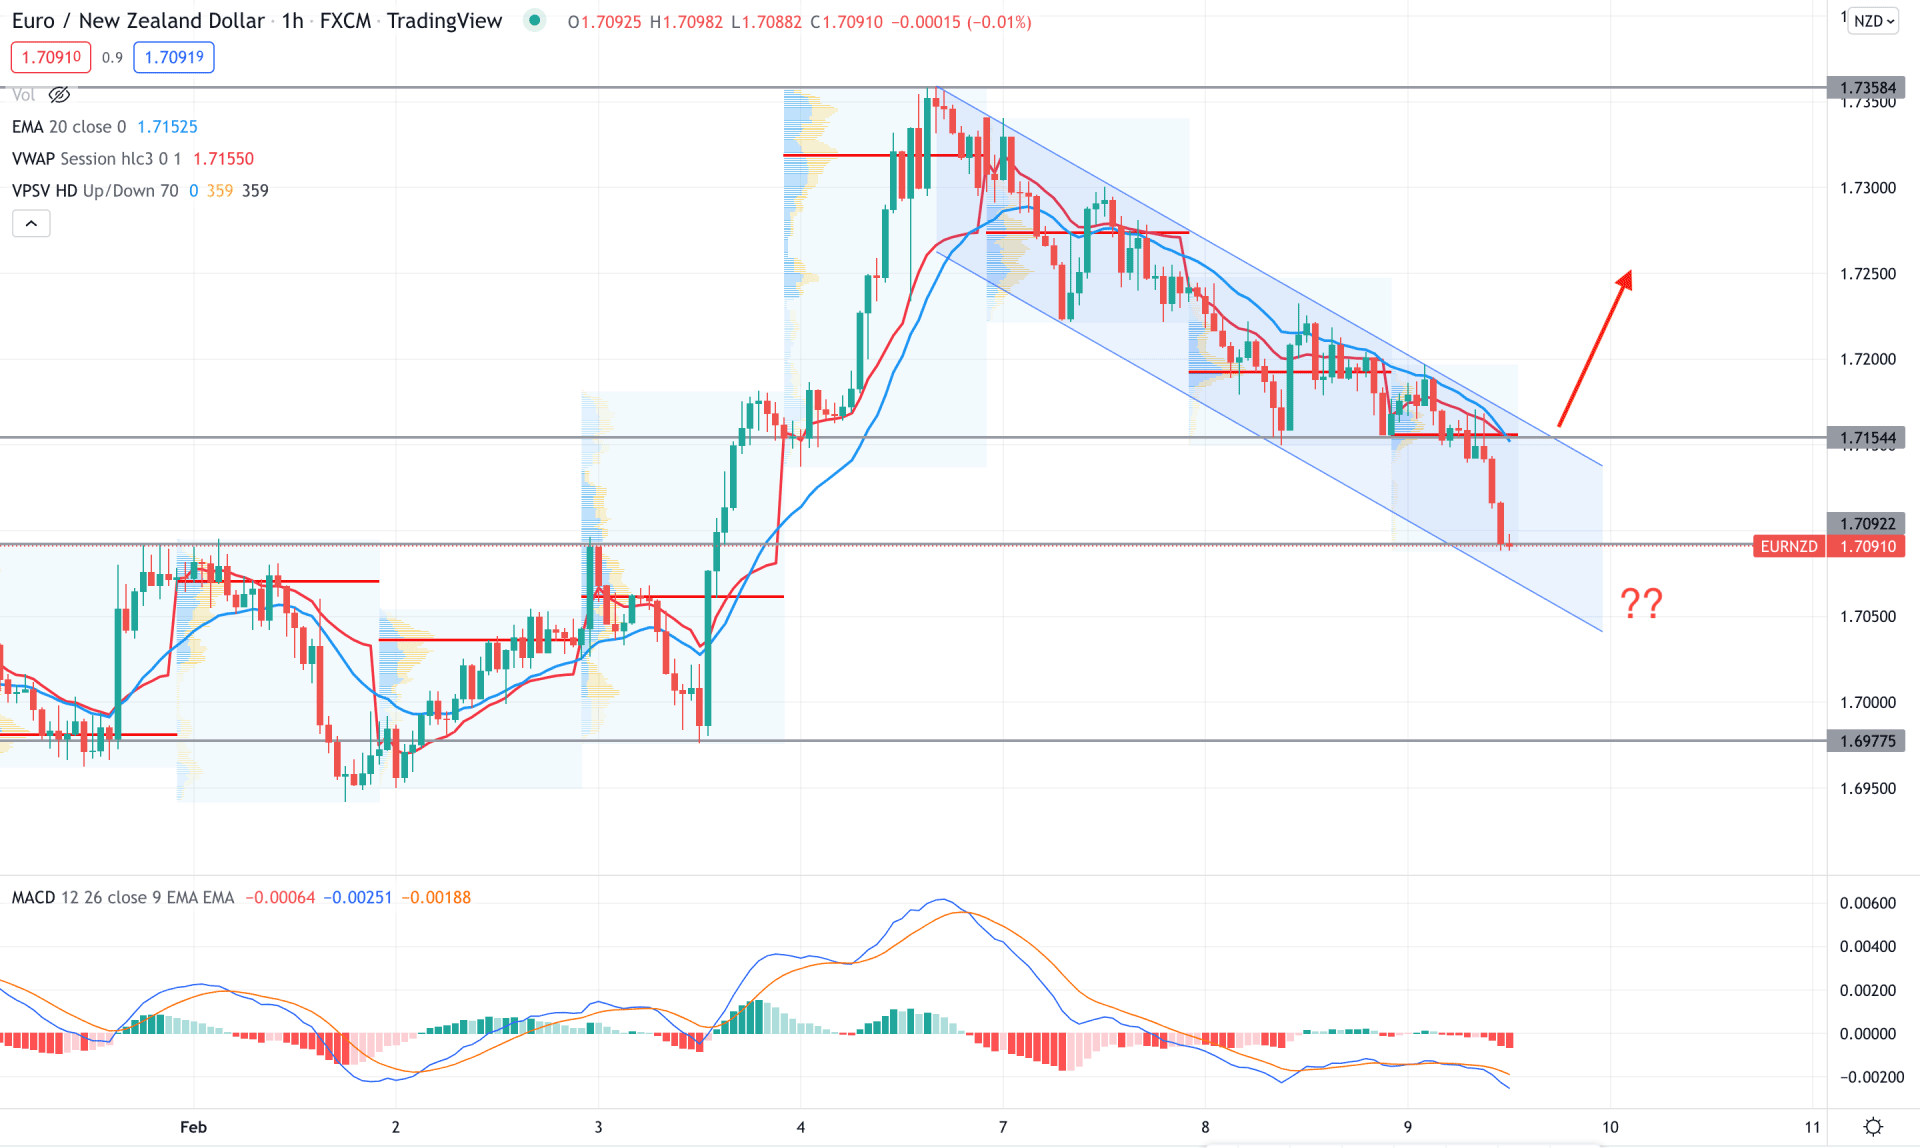
In the EURNZD intraday chart, the price is trading within a bearish channel that is backed by a bullish impulse. Therefore, any sing of the breakout from the channel would be a buying opportunity towards the broader market trend.
The above image shows how the price trades within the channel where the MACD Histogram turned bearish. Moreover, the selling pressure pushed the price to move below dynamic 20 EMA and weekly VWAP with a strong volume at 1.7155 area. Therefore, the selling pressure may extend until bulls are overcoming the 1.7155 level with a bullish H1 candle.
As per the current market context, EURNZD has a higher possibility of continuing the broader bullish trend after completing the correction. In that case, investors should closely monitor how the price trades at the near term support level. Any sign of the bullish pressure from Fibonacci levels with a lower time frame confirmation has a higher possibility of taking the price up in the coming days.