
Published: December 28th, 2021
The European Central Bank shows signs of keeping the net bond purchase program to the pre-pandemic level by the last quarter of 2022. As a result, the rate hike may come in the earliest session of 2023. Besides the ECB’s package, there is a possibility of coming to a compromise as all Governing Council members are not convinced to believe in the falling back of inflation before 2024.
Currently, Eurozone inflation reached a record high. In November, the CPI inflation reached 4.9% YoY, while the core inflation was 2.6% YoY. The primary reason for the rising inflation was the higher energy price, where the possibility of a further increase in the energy price is still intact for December 2021.
Another factor that may drive the EURGBP price is the Omicron sentiment. Currently, the global financial market has less liquidity due to the holiday season, where the price driver is how the infection rate is coming. It is still under control in the UK and Eurozone, where any negative news might work as a key price driver.
Let’s see the upcoming price direction from the EURGBP technical analysis:
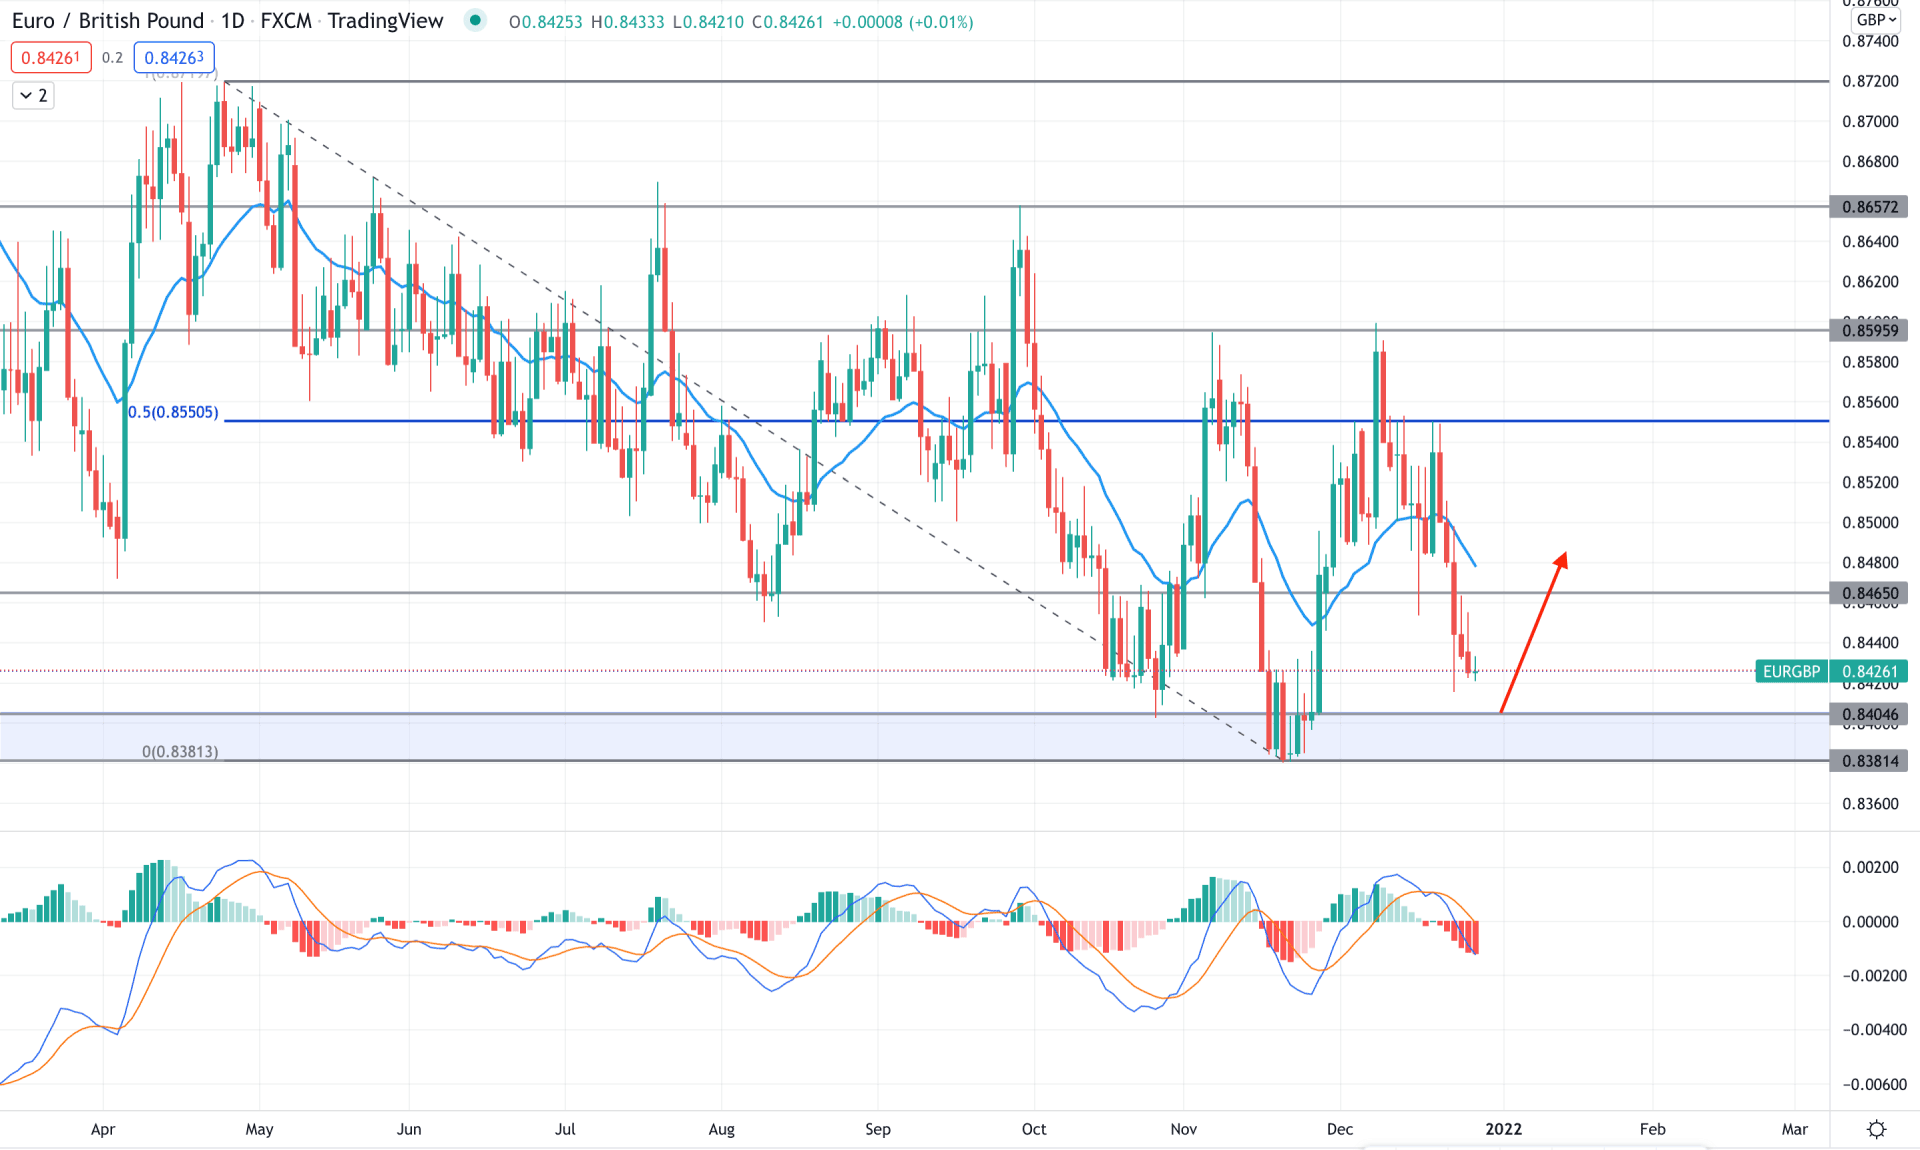
In the daily chart, EURGBP is trading below the 50% Fibonacci retracement level from April high to November low. Therefore, the discounted price signifies that institutions may show interest in buying this instrument in the coming days. Moreover, the recent price showed an astounding bullish rejection by making 0.8406 to 0.8381 area as a key demand zone. After reaching the 50% Fibonacci retracement level, the price is approaching the demand area. Therefore, any bullish rejection from the demand zone might initiate a buying pressure in the price where the primary target would be 0.8600 swing high.
The above image shows that the MACD Histogram is bearish where the gap between the dynamic 20 EMA has expanded. Therefore, any test of the 0.8404 support level is more likely to take the price up with the mean reversion.
On the other hand, if the price moves below the 0.8380 swing low, we may expect the price to eliminate the current bullish possibility and initiate a new bearish trend towards the 0.8300 area.
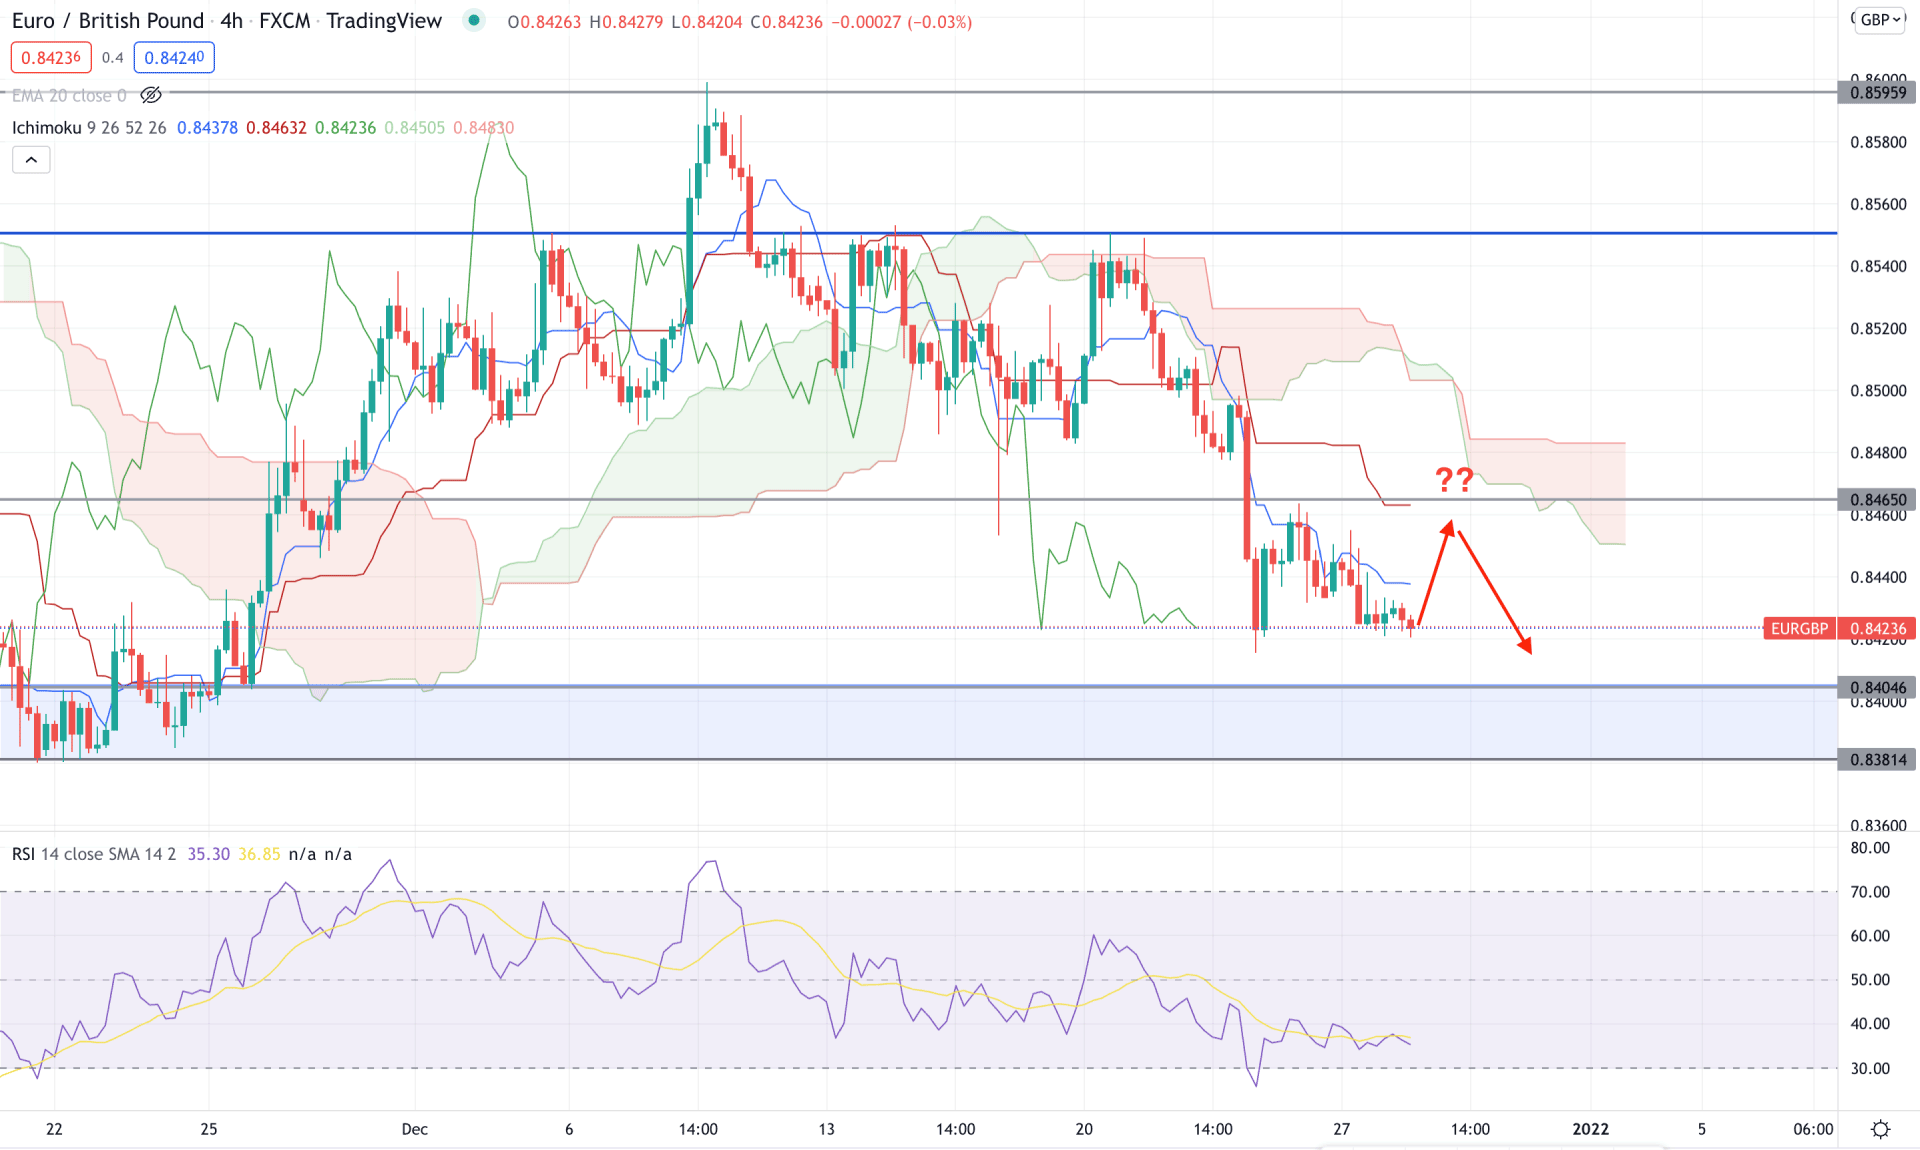
According to the Ichimoku Kumo Cloud, the EURGBP price is trading below the Kumo Cloud, where the current trend is bearish. In the future cloud, the Senkou Span A is below the Senkou Span B and aims lower, showing that bears are more robust in the current chart than bulls. On the other hand, the price is still corrective below the dynamic Tenkan Sen and Kijun Sen, which is a sign of facing a minor resistance from dynamic levels.
The above image shows how the price trades above the 0.8381 key support level where the current trend is bearish. Meanwhile, the RSI is below 50 levels and aiming lower, which is a sign of a possible bearish pressure in the price.
Based on the H4 context, the price is more likely to move up and test the 0.8465 resistance level before moving down. On the other hand, an immediate break below the 0.8404 swing level may initiate an intense selling pressure in the price with the target of 0.8350 area.
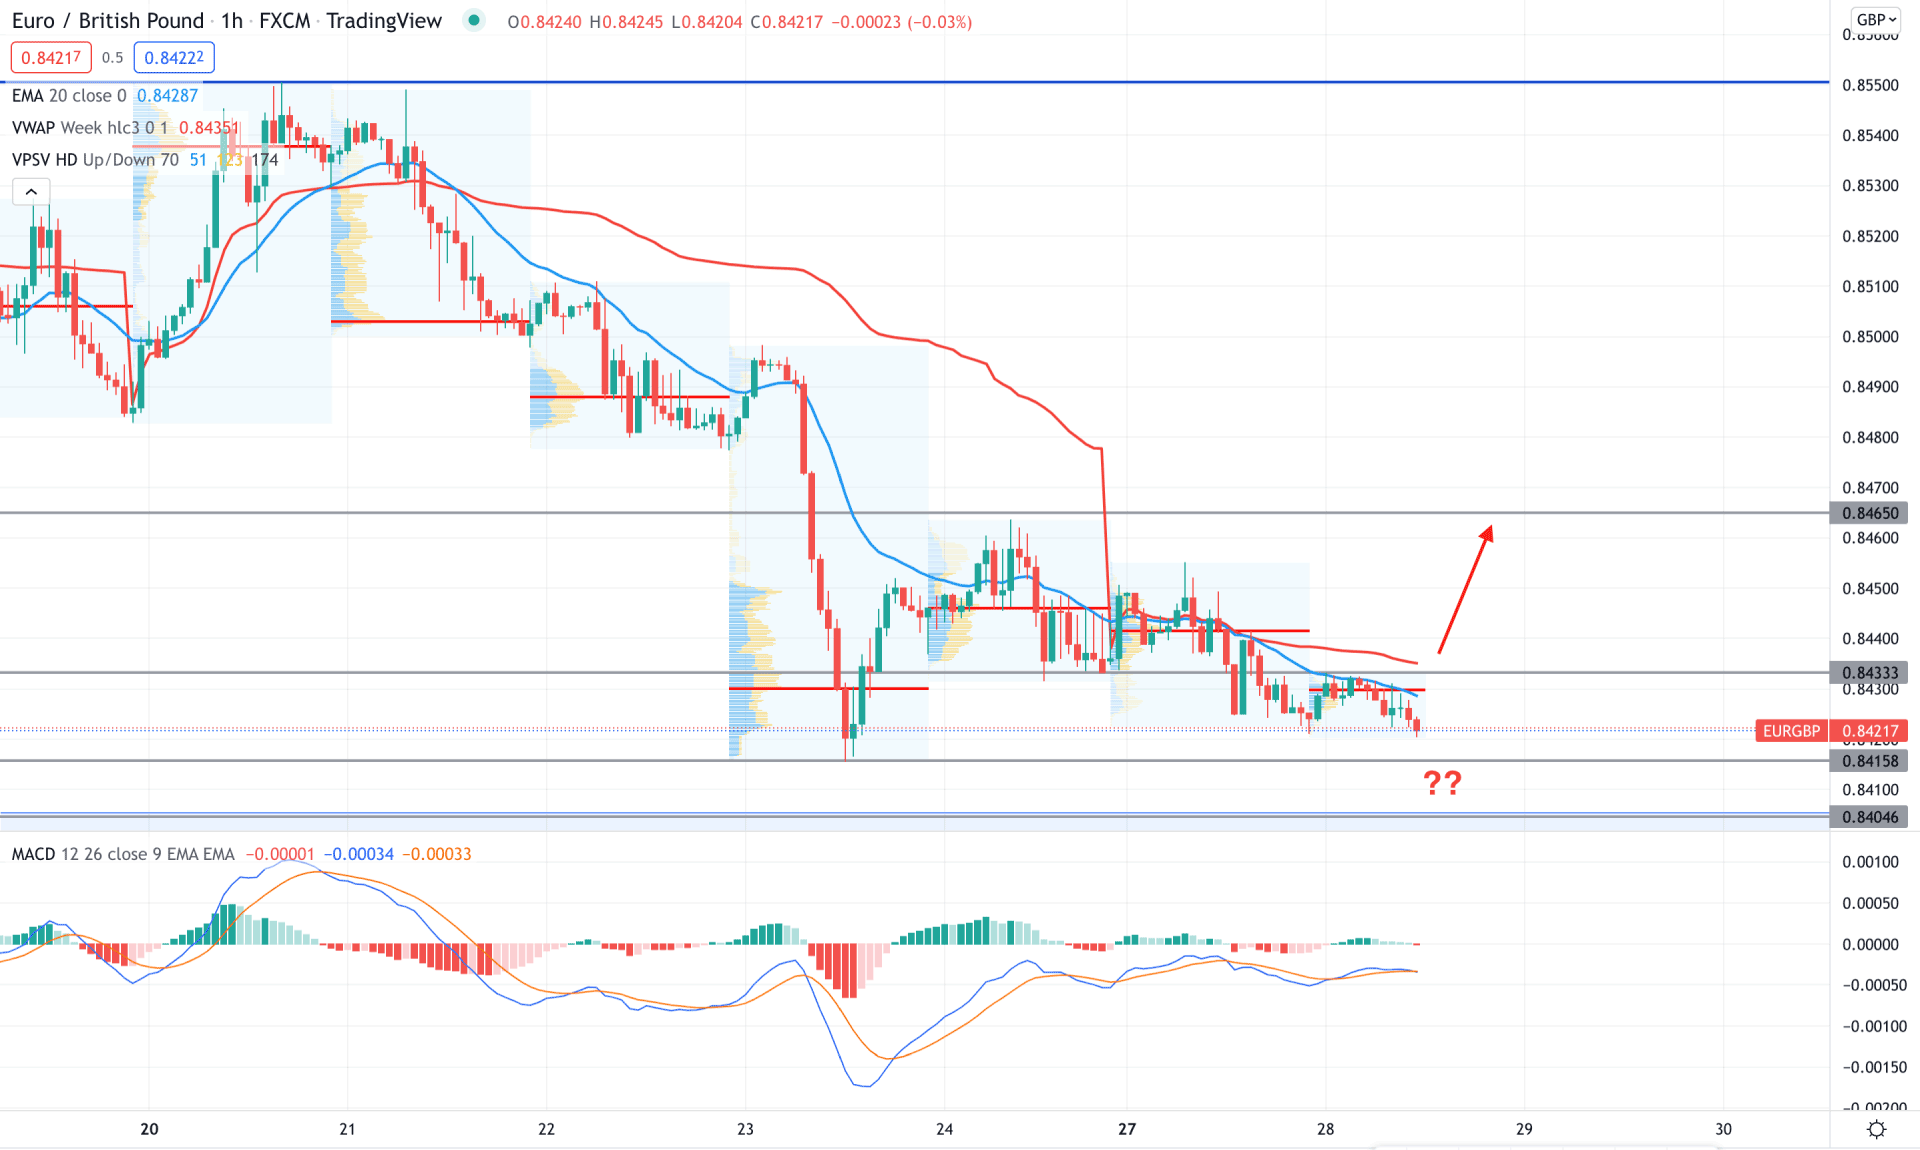
In the intraday chart, the EURGBP price has become corrective after an intense selling pressure where the current price is trading below the most recent intraday high volume level of 0.8429. Moreover, the price is still below the dynamic 20 EMA and static 0.8433 resistance level. Therefore, any selling pressure from 0.8400 to 0.8433 is more likely to take the price down towards the 0.8300 area.
The above image shows how the MACD Histogram becomes corrective where the divergence has formed with the price and MACD line. Considering the broader market’s bullish possibility, any H1 candle close above the dynamic weekly VWAP is more likely to take the price up towards the 0.8460 area. On the other hand, a break below 0.8404 may increase the bearish possibility towards the 0.8300 level.
As of the current observation, EURGBP bulls are more likely to take the price up in the coming days. In that case, investors should closely monitor how the intraday price trades at the 0.8433 area. Any bullish breakout in the H1 chart with a candle above the dynamic VWAP would be the possible buying point in this pair.