
Published: January 4th, 2022
The new year started with a lot of fundamental releases for the Euro where today’s Spanish and German unemployment report is impressive. Although the result is outstanding than the previous report, it is still under significant change. The Spanish unemployment rate came down to -76.8K where the projection was at -32.5K. The Euro was seen to get some benefit with that news, but in the EURAUD pair, investors should monitor how the upcoming PMI’s are coming on Wednesday.
On the other hand, the Australian economy remained stable, whereas the Reserve Bank of Australia has no plan to impose restrictions due to the current omicron sentiment. However, the infection rates are increasing, and investors should monitor how reports are coming. Any sign of a devastating situation might invalidate any technical setup for the EURAUD pair. The market still awaits the US Non-farm payroll to come, and before that, the current market momentum may remain corrective.
Let’s see the upcoming price direction from the EURAUD technical analysis:
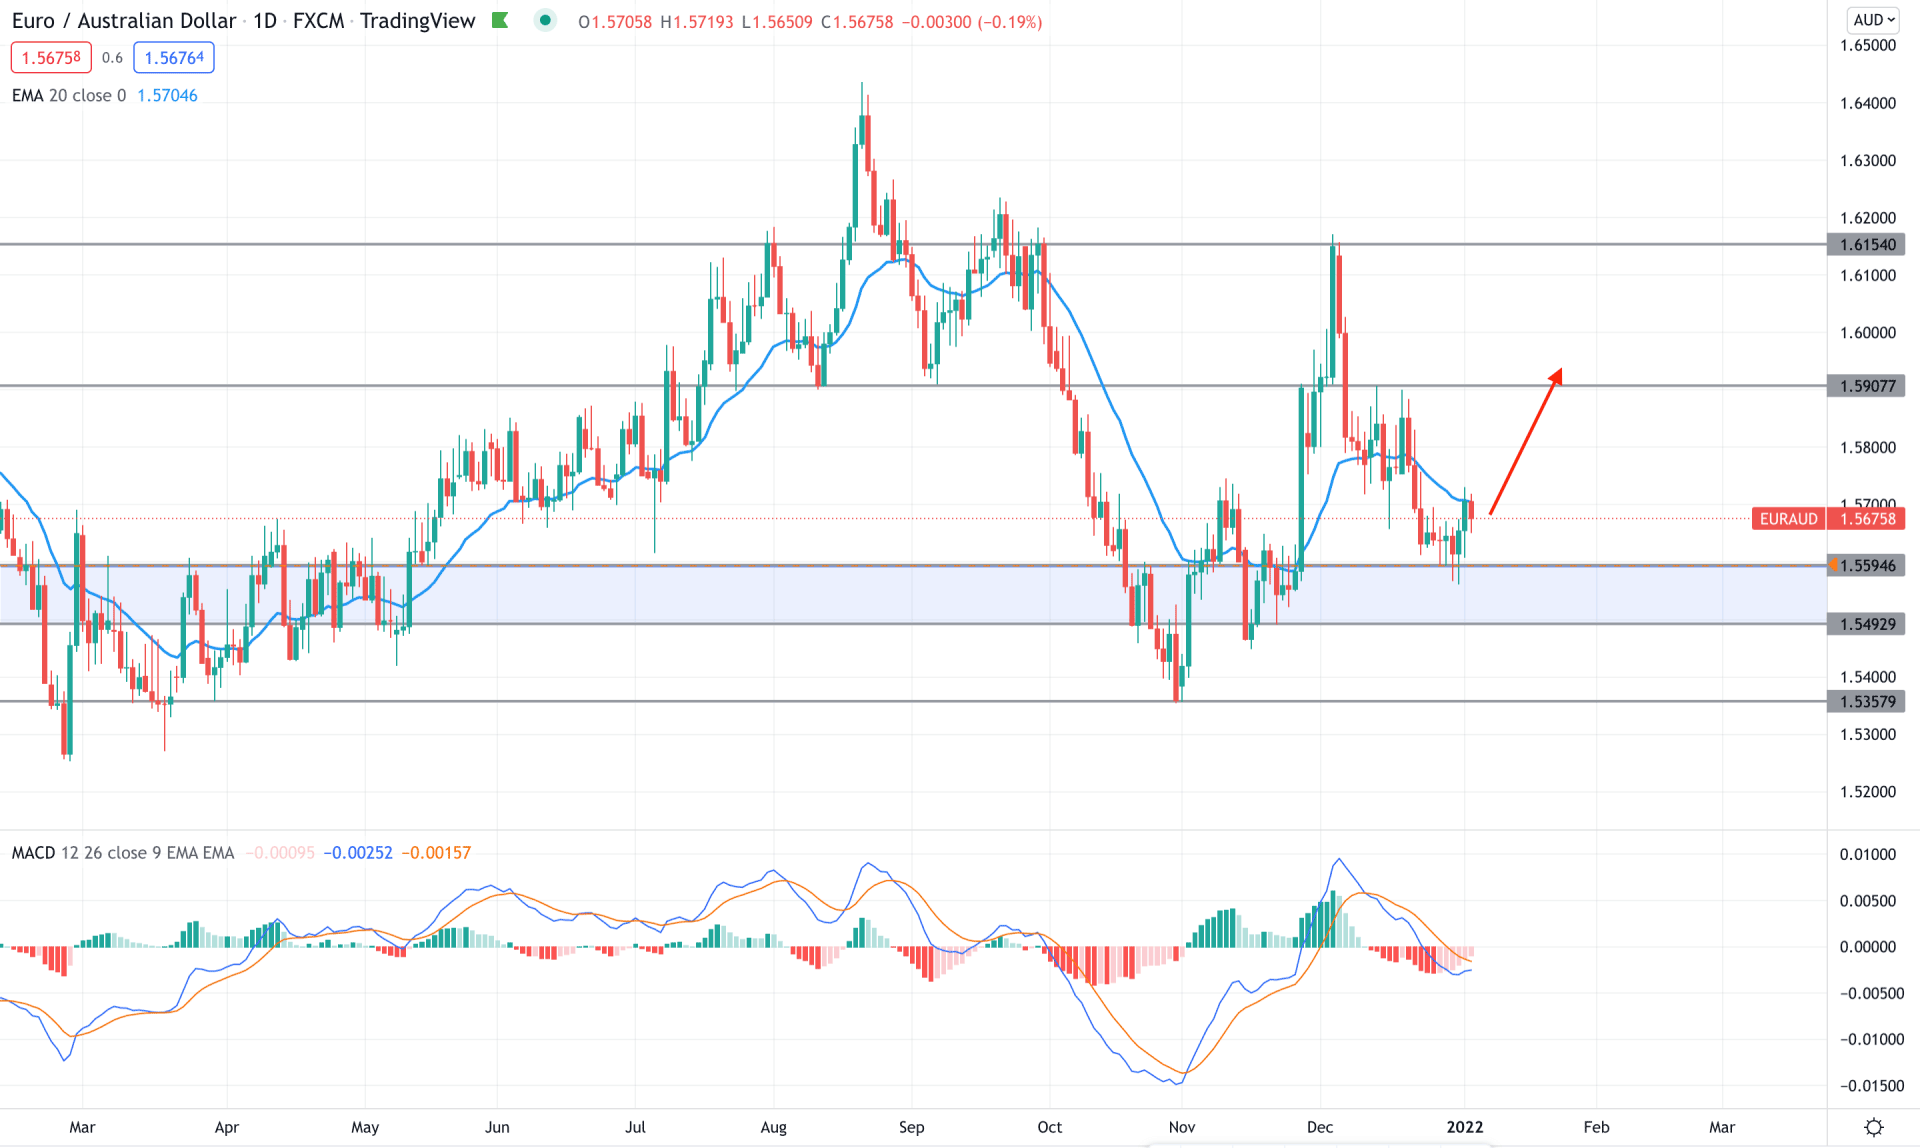
In the EURAUD daily chart, the price showed an amazing movement from 1.5357 bottoms to 1.6154 high with an impulsive bullish pressure. However, the price became volatile and moved down to 1.5594 to 1.5492 demand zone. The most recent buying pressure from this demand zone indicates that investors have become interested in this instrument where a lower time frame confirmation is needed for finding a suitable buying point.
The above image shows how the MACD Histogram is losing momentum and moving to the neutral zone, signifying that bears are losing momentum from the existing trend. However, the current price is still below the dynamic resistance, where a bullish pressure above the 20 EMA would increase the buying possibility.
The EURAUD is trading above an important demand zone based on the current price structure, while a minor resistance from the dynamic 20 EMA is in play. Therefore, the broader market context is bullish as long as the price trades above the 1.5594 support level. Any bullish daily close above the dynamic 20 EMA would be a potential buying opportunity in this pair towards the target of 1.5900 level. On the other hand, a fresh low below the 1.5492 would alter the current market direction and initiate a broader correction in the price.
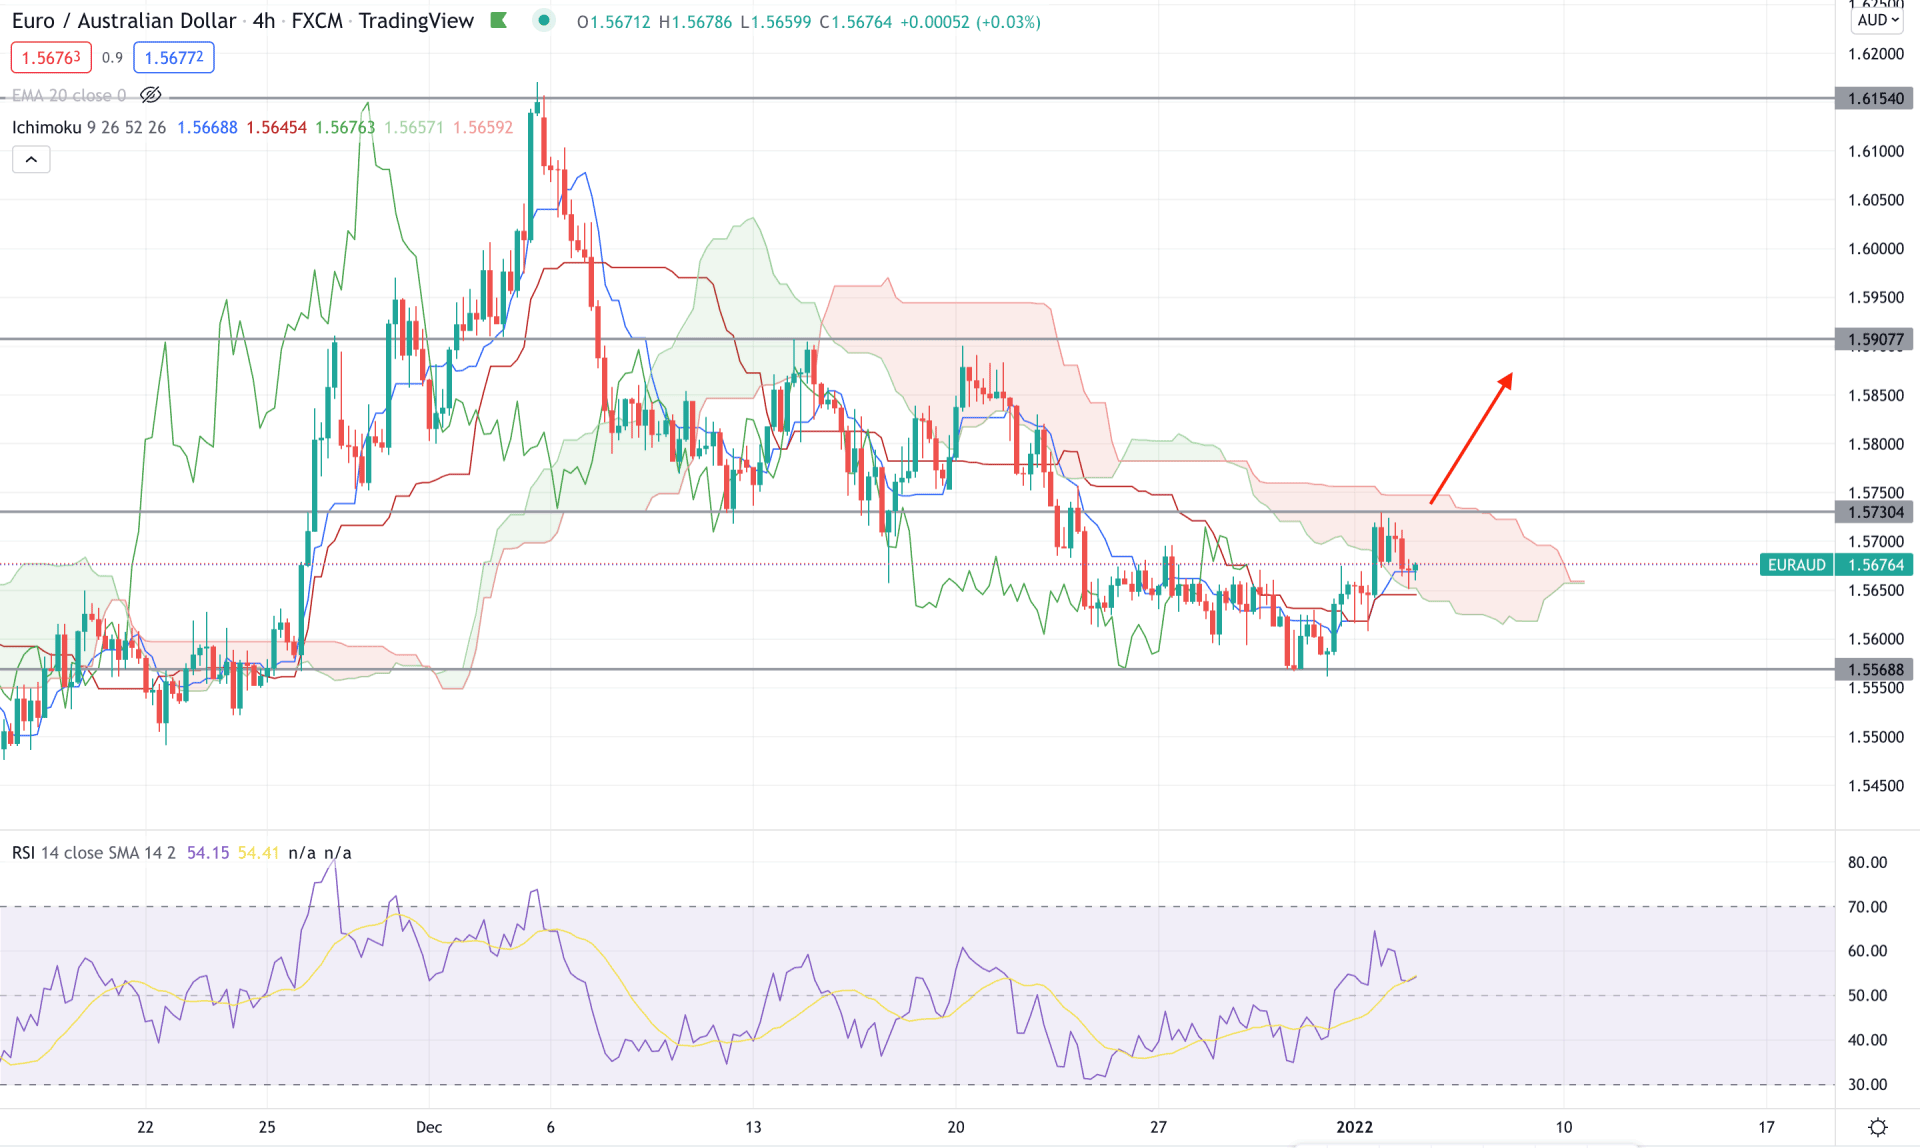
According to the Ichimoku Cloud, the current H4 chart of EURAUD shows a corrective pressure where the recent price moves above the dynamic Kijun Sen even if the border market trend is bearish. Moreover, the future cloud is changing its direction while the Lagging Span is just above the price on that level. Therefore, as the current price is within the Kumo Cloud, a breakout is needed to rely on the upcoming bullish pressure.
The above image shows how the RSI moves up and shows a strong momentum above the 50 levels. Therefore, the RSI can reach the overbought 70 level with a bullish pressure at a price. Moreover, the current price is above the dynamic Kijun Sen and formed a bullish reversal candlestick, which indicates that bulls are interested in taking the price up.
Based on the H4 context, any bullish breakout with an H4 close above the 1.5730 would increase the buying possibility in this pair towards the target of the 1.5900 area. On the other hand, a new swing low below the 1.5568 may initiate another swing below the Kumo Cloud.
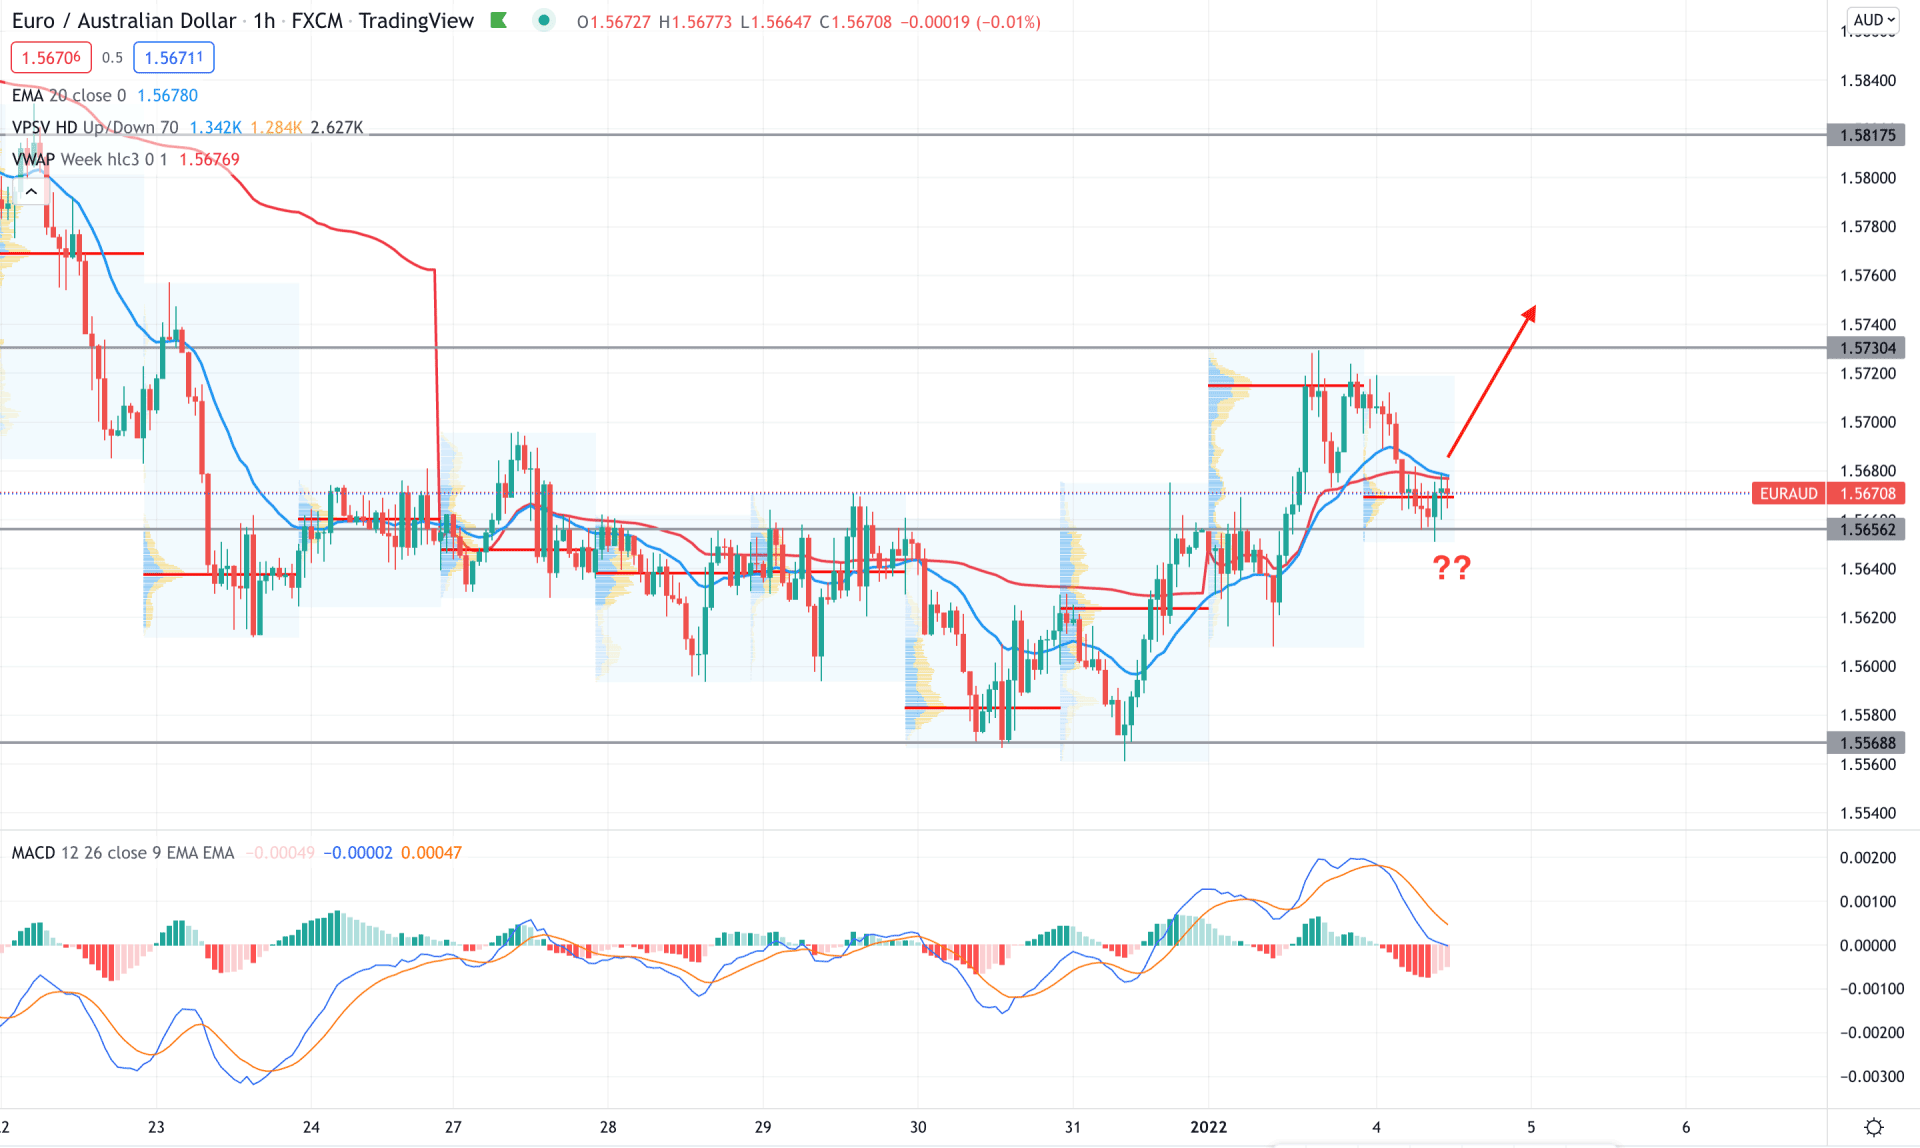
EURAUD is trading within a bullish pressure that came after a range in the intraday chart. As soon as the price moved above the 1.5656 event level, the broader market trend changed its direction from bearish to bullish. However, the price found a top at 1.5730 area from where a bearish pressure came with a strong volume.
The above image shows how the MACD Histogram loses its bearish momentum and moves up to the neutral level. In that case, a positive Histogram with a bullish H1 close above the dynamic 20 EMA would be a potential buying opportunity in this pair. In that case, the primary target would be 1.5700 level, and the final intraday target would be 1.5817 level.
According to the current observation, the EURAUD bullish trend is potential as the recent price showed buyers interest from the demand zone. In that case, investors should monitor trade setups in the H4 and H1 timeframe with an appropriate risk management system. A bearish daily candle below the 1.5492 would alter the current market structure and resume the existing bearish trend towards the 1.5357 level.