
Published: September 11th, 2020
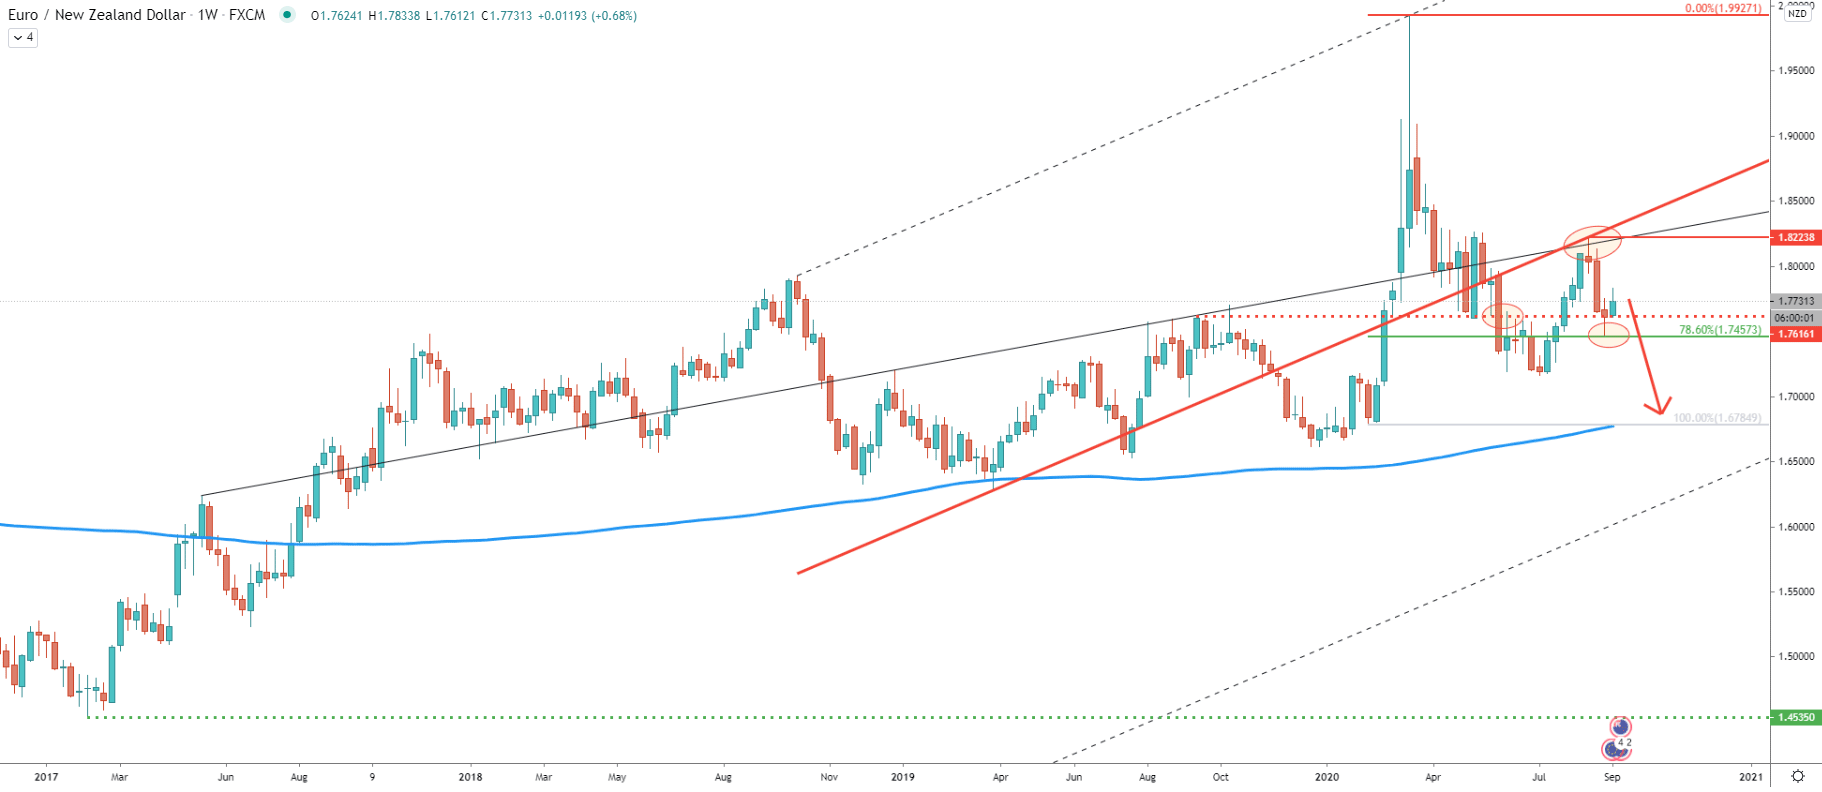
Since March 2018, EUR/NZD has been rising steadily. The average-price uptrend trendline was applied to the Weekly chart, which shows that price bounced off the trendline nearly 4 weeks ago. Along with the average-price trendline, EUR/NZD clearly rejected the lower trendline of the ascending channel, which was broken at the end of 2019.
While there is a potential for further price decline, although there is another important factor to consider. Last week, price bounced off cleanly the 78.6% Fibonacci support at 1.7457, suggesting the long term consolidation phase between 1.7457 and support and 1.8223 resistance. But considering the breakout of the ascending channel along with the previously formed supply/demand level at 1.7616, probability stays in favour of a downside move.
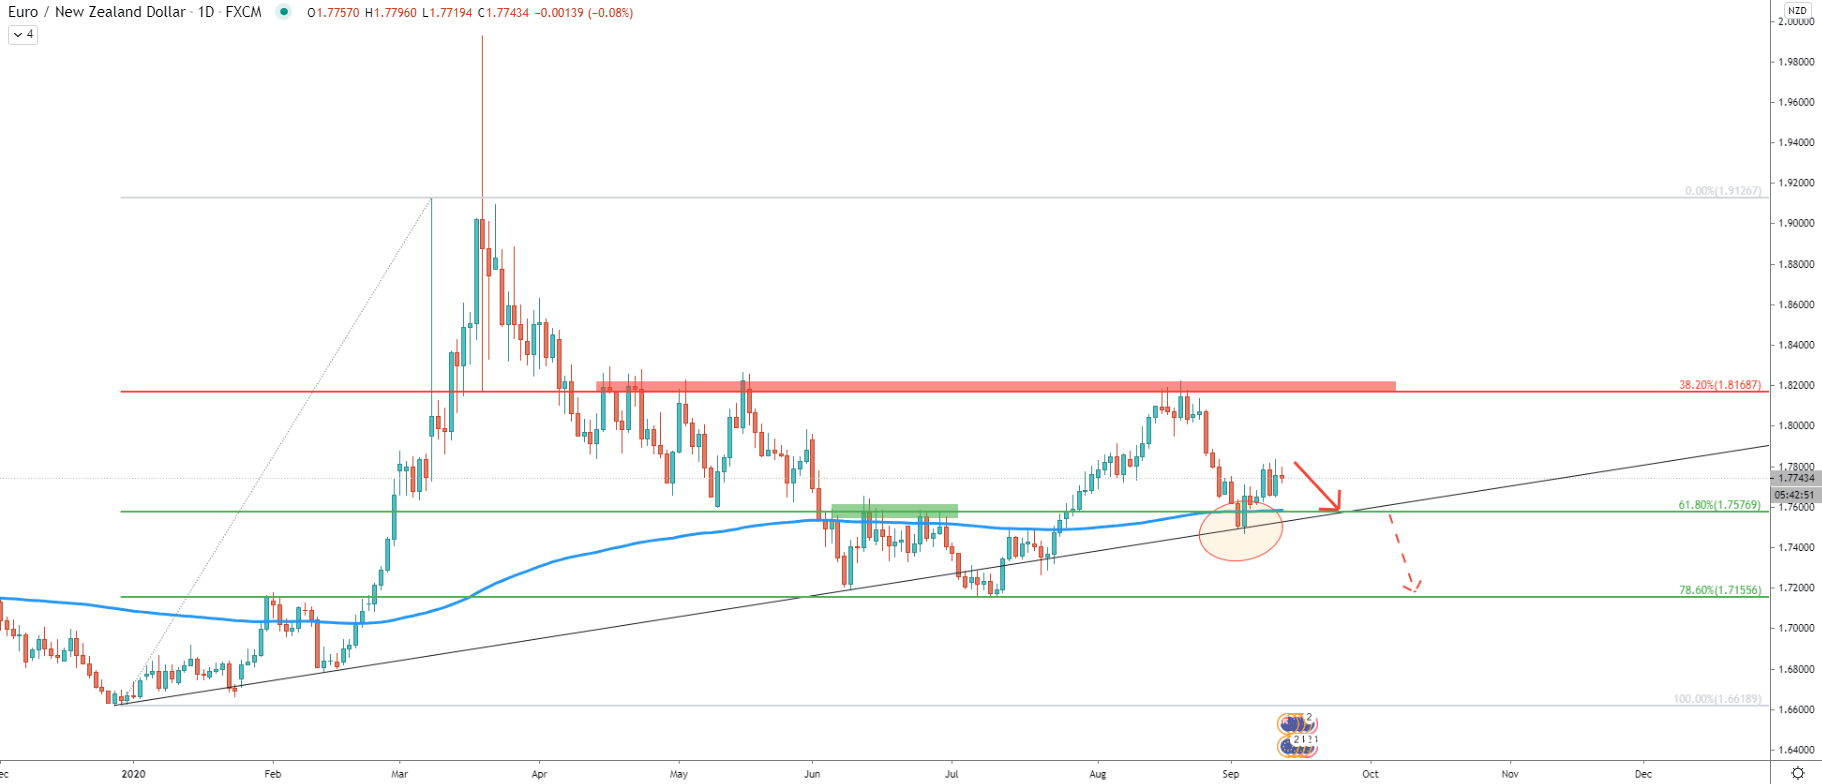
On the daily chart price has rejected the 38.2% Fibonacci resistance level at 1.8168 and then bounced off the uptrend trendline. Nonetheless, there was a break and close below the 61.8% Fibs support along with the 200 Exponential Moving Average. This suggests the ongoing selling pressure for the EUR/NZD in the coming days.
While there might not be a substantial drop in price, EUR/NZD should at least test the 61.8% Fibs at 1.7577, which corresponds to the long term uptrend trendline as well as the 200 EMA.

On the 16-hour chart, Fibonacci retracement indicator was applied to the last upswing occurred between July and August. On September 9 there was a clear rejection of the 38.2% Fibs, which is 1.7819 level. At the same time price has rejected the average-price uptrend trendline and prior to that broke below the simple uptrend trendline.
Right now, both uptrend and 38.2% Fibs are acting as a strong resistance. Considering that it has been rejected twice throughout this week, downside pressure will only be increasing as long as daily closing price remains below recently printed high at 1.7833. The previously mentioned downside support near 1.7577 now corresponds to two Fibs, both of which are 61.8% as can be seen on the chart. Therefore, the potential downside move could be as much as 200 pips in the coming week.
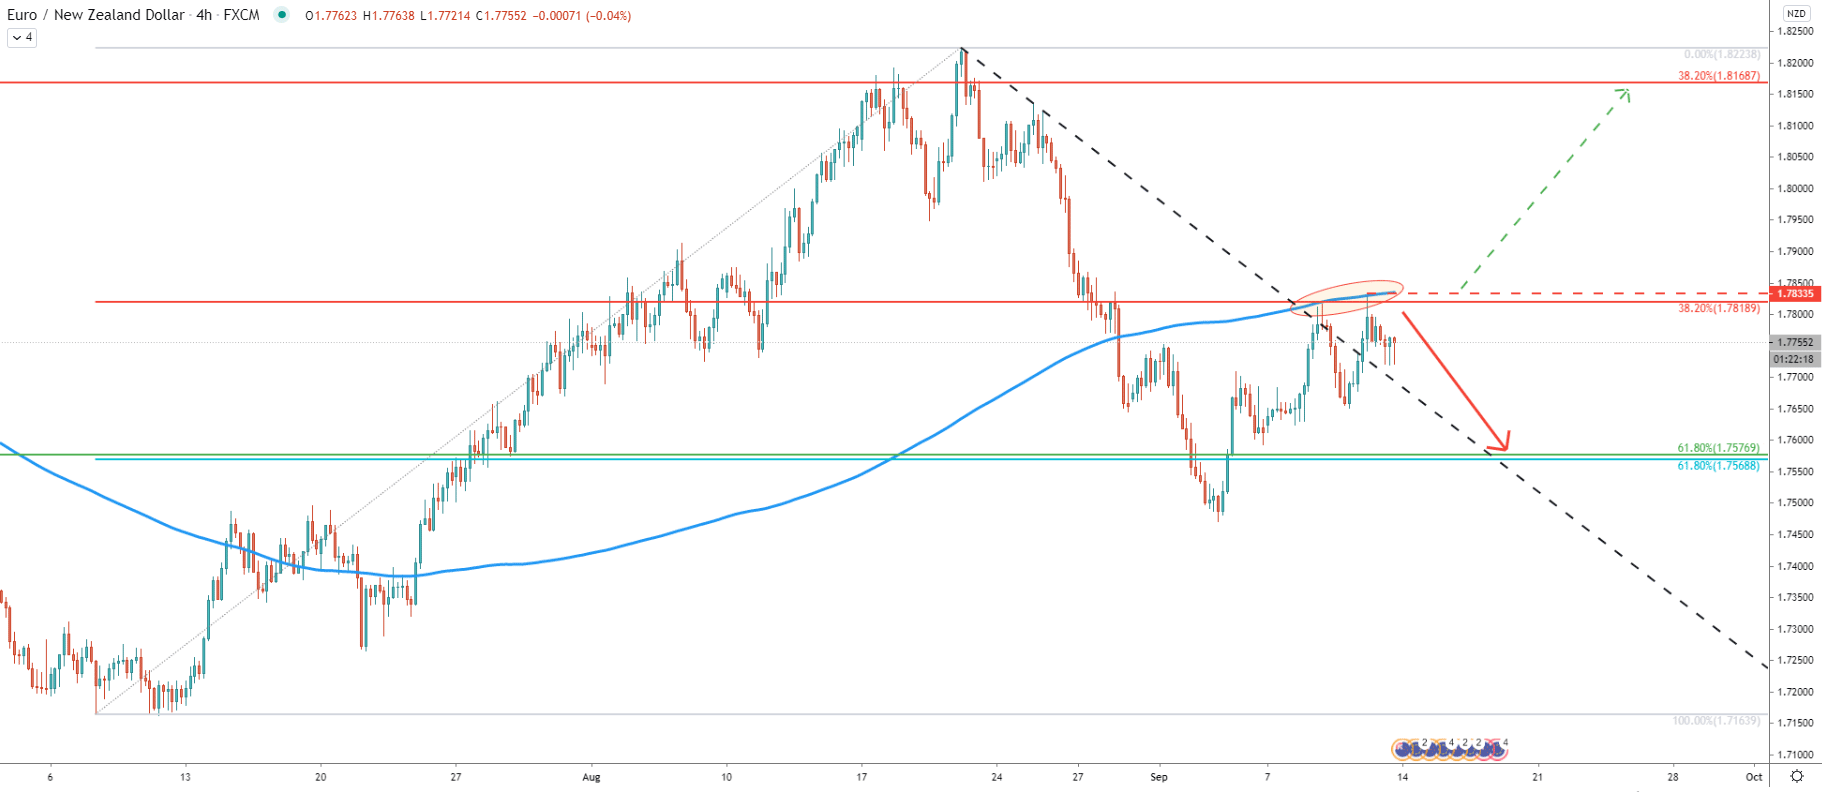
On the 4-hour chart price has rejected the 200 Exponential Moving Average two consecutive times, along with the Fibonacci resistance. Moreover, the downtrend trendline has been respected and still acts as resistance. Now only daily break and close above the 1.7833 high would be able to confirm the breakout of the trendline and the Fibonacci resistance.
Currently, short term downtrend remains valid and fast decline could take place. Perhaps there is a potential for the EUR/NZD to test the 1.7577 support at the point of the crossing with the downtrend trendline.
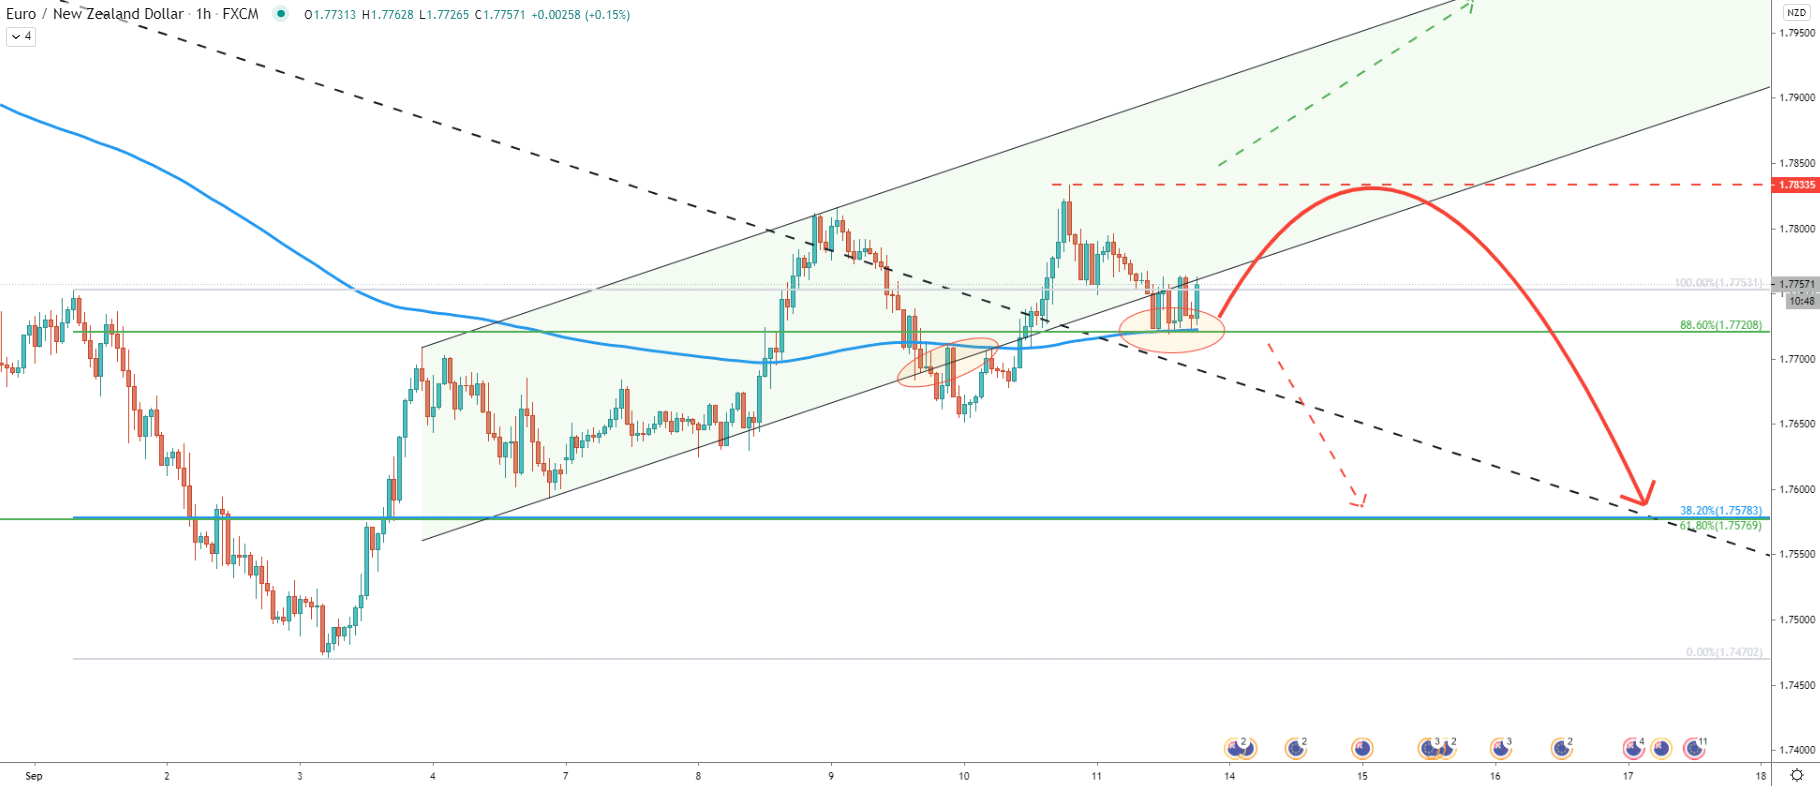
On the hourly chart EUR/NZD broke below the ascending channel suggesting further price weakness. However, today pair has been rejecting 88.6% Fibonacci support at 1.7720. Along with the Fibs, the 200 EMA was also acting as the support, both of which were rejected.
This might suggest the beginning of a consolidation phase, which can take place between 1.7833 resistance and 1.7720 support. Maybe the confirmation of the downside move will be a clear break and close below the current support. Till then sellers are likely to stay passive and wait for the new lower low to be produced by the price.
The New Zealand Dollar does feel very strong across the board, which might result in multiple NZD/XXX pairs moving up and XXX/NZD pairs moving down, including the EUR/NZD.
As per the daily and 16-hour charts, there is one key downside target to watch. This is the 1.7577 level confirmed by two Fibonacci retracement levels as well as the 200 EMA and the uptrend trendline. All of these indicators should provide strong support for EUR/NZD if/when the price will continue to decline.
As per the 4-hour chart, only daily break and close above the recently printed high at 1.7833 can invalidate bearish forecast. In this case, EUR/NZD can be expected to turn extremely bullish in the long run.
Support: 1.7720, 1.7577, 1.7457, 1.7155
Resistance: 1.7819, 1.7833