
Published: February 2nd, 2021
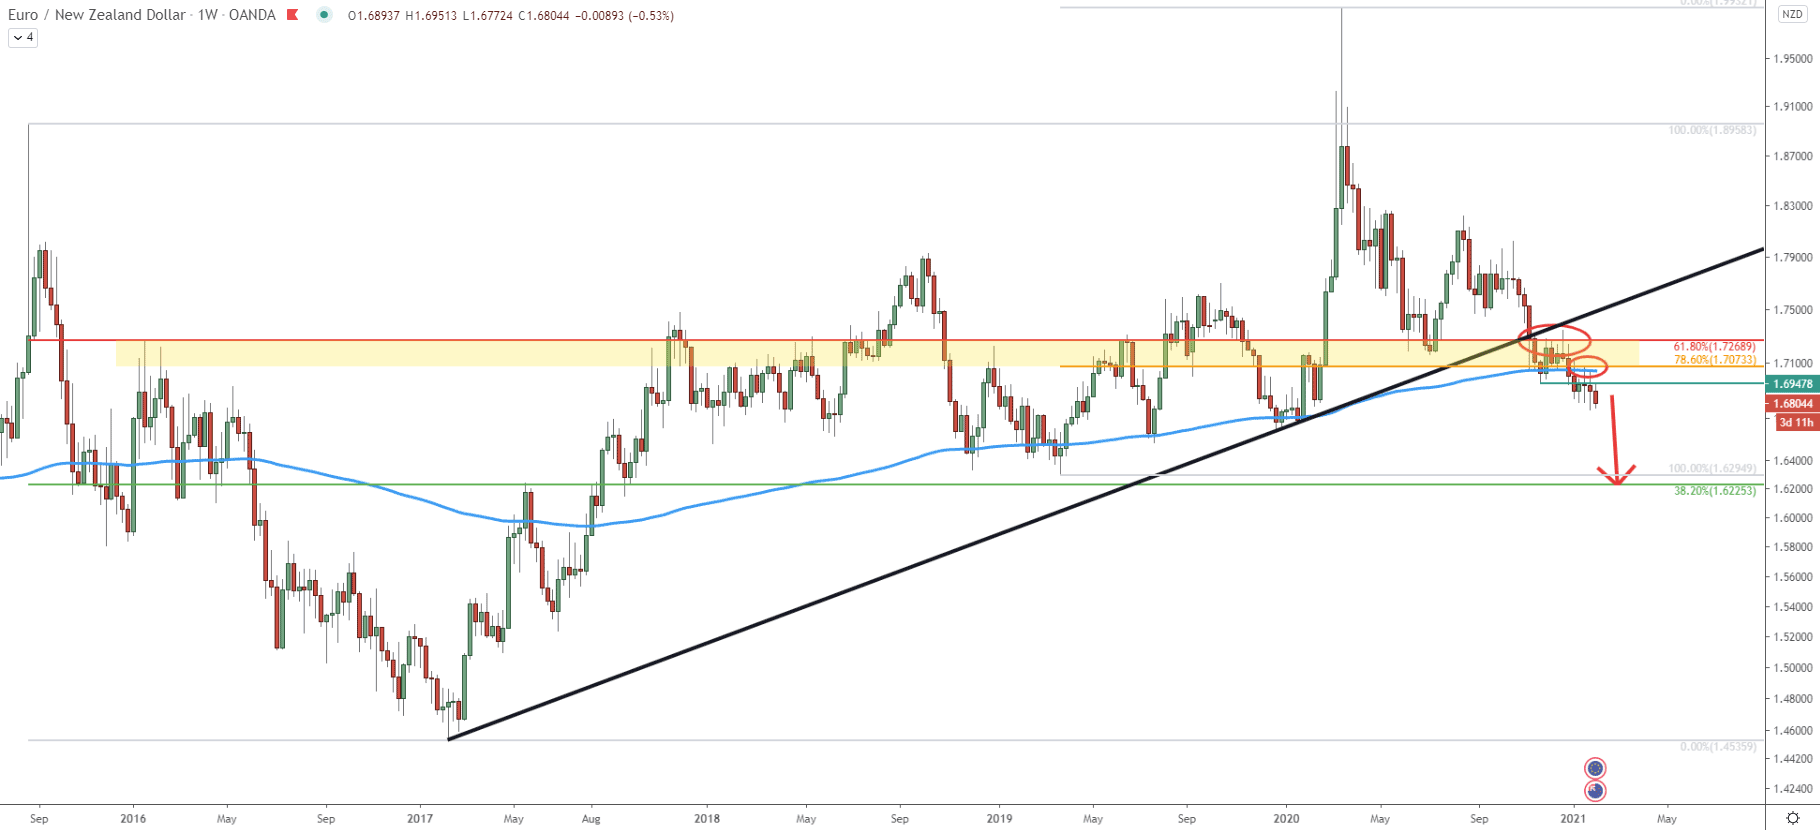
The EUR/NZD currency pair has been on a consistent rise since the beginning of 2017. On March 16, 2020, the price topped out, while nearly testing an extremely strong psychological resistance at 2.0000. Overall, it was a 37% price increase, which took 3 years. But not so long ago, the balance shifted from buyers to sellers, after the price broke below the uptrend trendline.
At the same time, EUR/NZD broke below the strong supply/demand zone, which is located between 1.7073 and 1.7268. These levels are confirmed by two Fibonacci retracement levels, namely 61.8% and 78.6% as can be seen on the chart. After breaking the trendline and the supply/demand zone, the price also broke below the 200 Exponential Moving Average, which could have been a strong indication of the change in trend. After breaking all the support indicators, the price corrected up and first rejected the 61.8% Fibs, then went lower and on small pullback rejected the 78.6% Fibonacci level.
Right now, it can be seen that EUR/NZD started to produce lower lows and lower highs, confirming the validity of the downtrend. Considering the double rejection of the resistance, the price drop could have started. Overall, this might result in the EUR/NZD falling towards the 38.2% Fibonacci retracement level, which is at 1.6225.
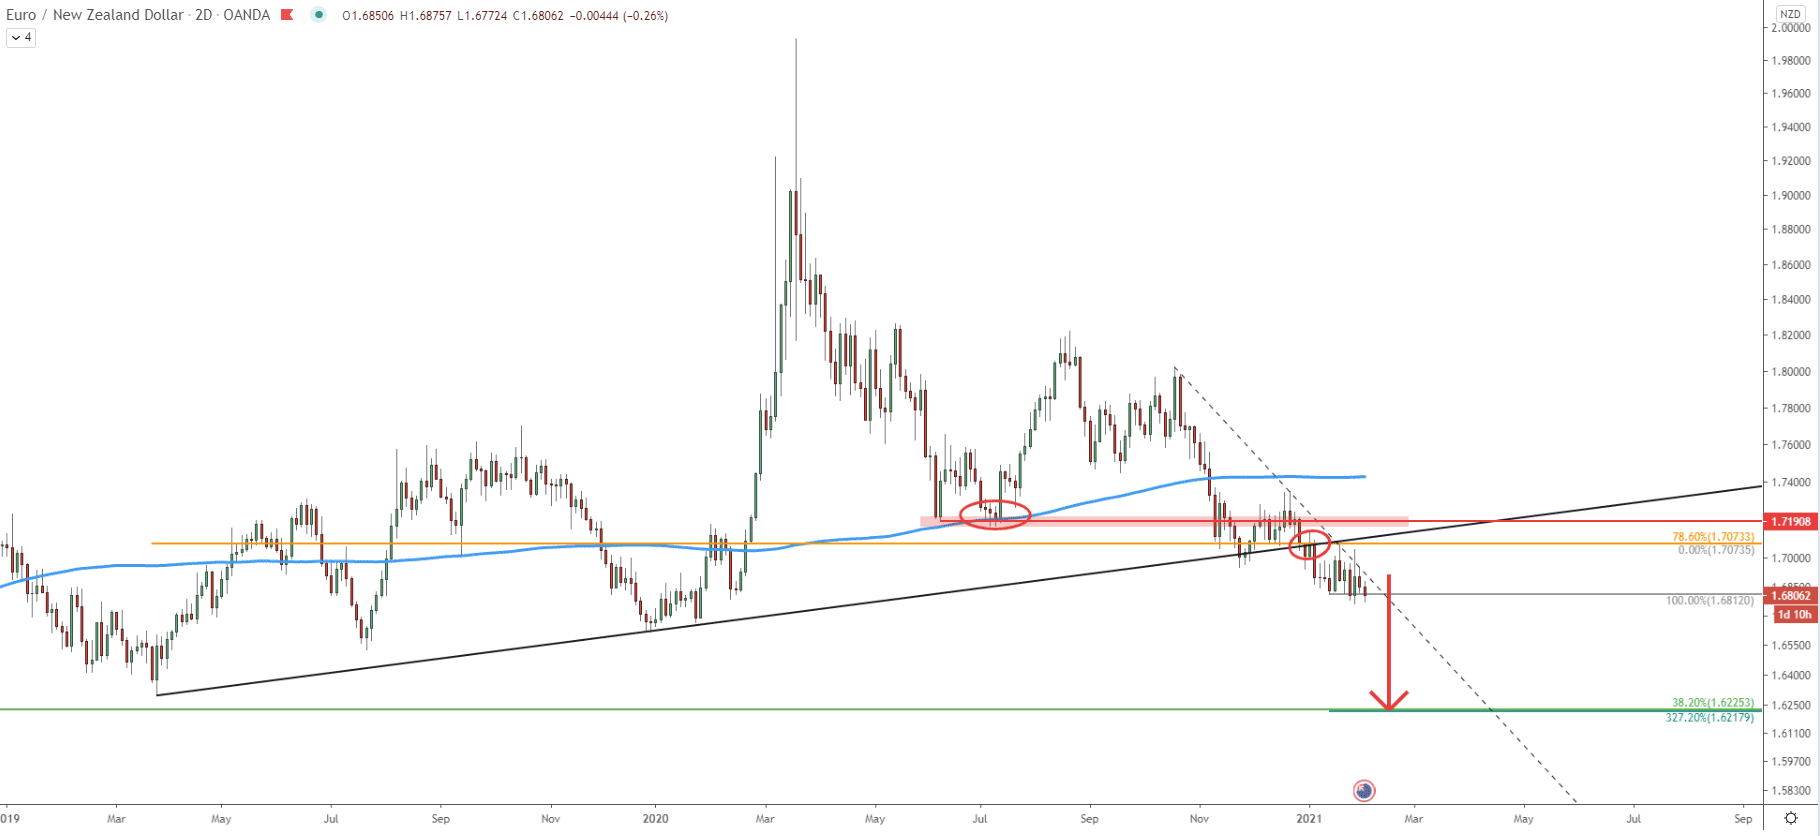
On this chart, yet another uptrend trenldine got broken. It can be seen, that prior to the trendline break, the price sliced through the 1.7190 support, where back In July 2020 the 200 EMA was rejected. This was very strong support, which was penetrated and after acted as the resistance.
At the same time, the downtrend trendline was rejected along with the 78.6% Fibonacci retracement level at 1.7073. Such price action strongly favors the continuation of the downtrend, with an overall drop of nearly 600 pips. This is because the key support level is located near 1.6225, which on this chart is confirmed by two Fibonacci retracement levels. First is the 38.2% Fibs as per the weekly chart, and the second is 327.2% Fibs applied to the pullback where 1.7073 resistance was rejected.
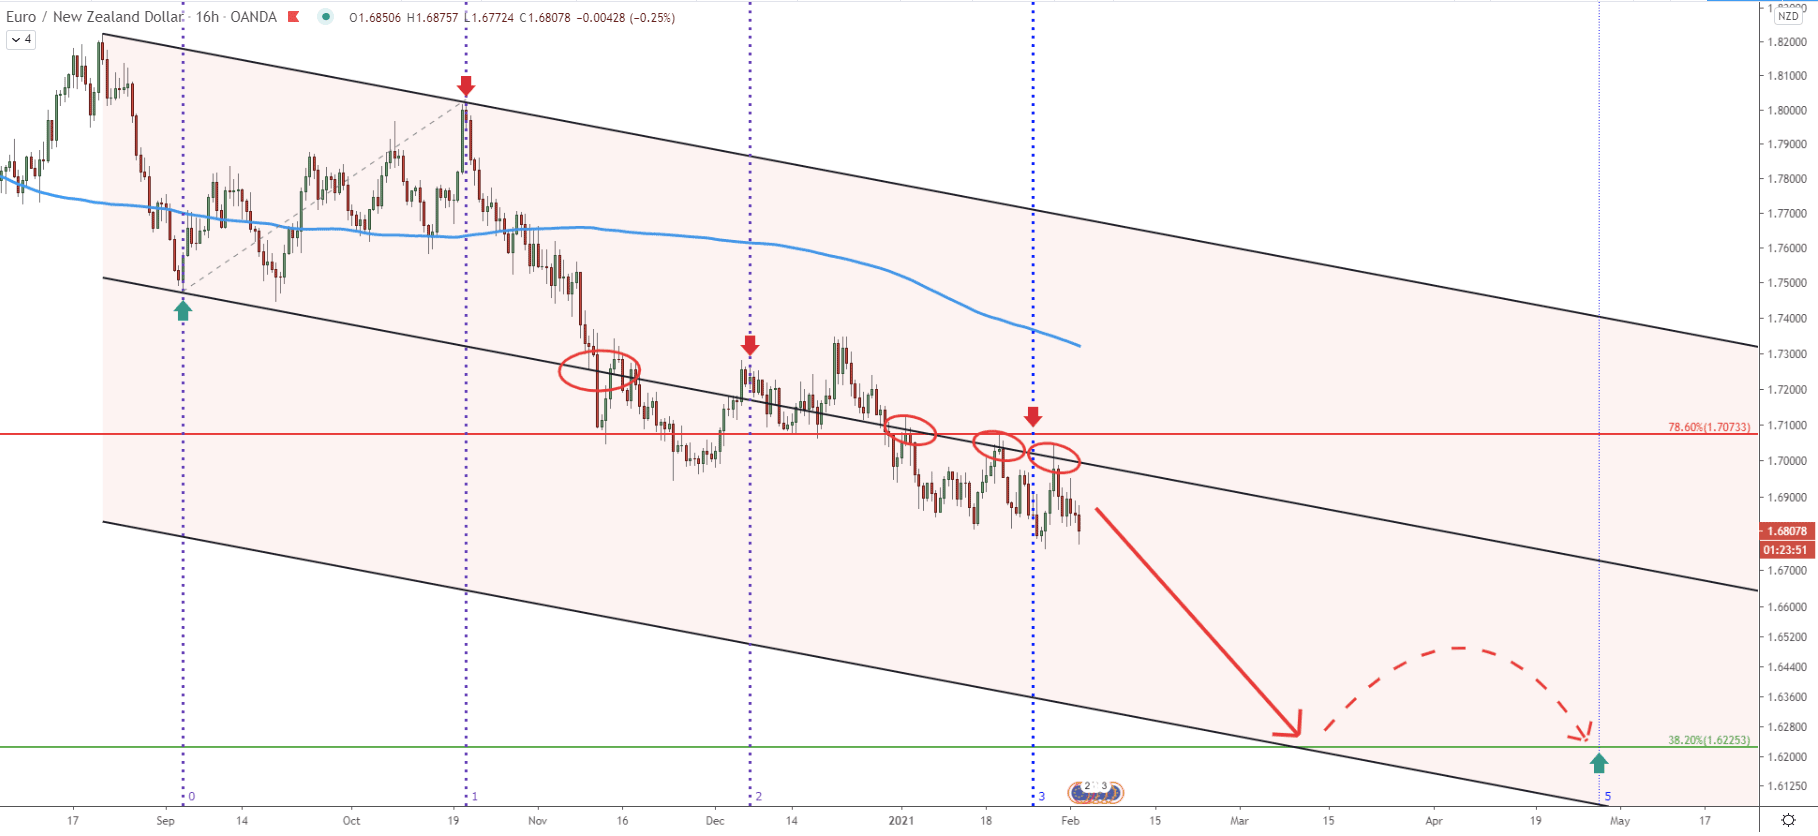
On the 16-hour chart, the price has been moving within the descending channel. However, in November 2020 EUR/NZD broke below the channel, which implies an increased selling pressure. During the past few weeks price has been bouncing off the bottom of the channel, which has acted as the resistance. Based on the Fibonacci cycles, a new cycle has recently started, which could have indicated that the downtrend is about to continue. After the beginning of the cycle, EUR/NZD has corrected up and rejected the bottom of the channel for the third consecutive time. Perhaps now is the time when sellers will step in, sending the price down towards the bottom of the extended descending channel.
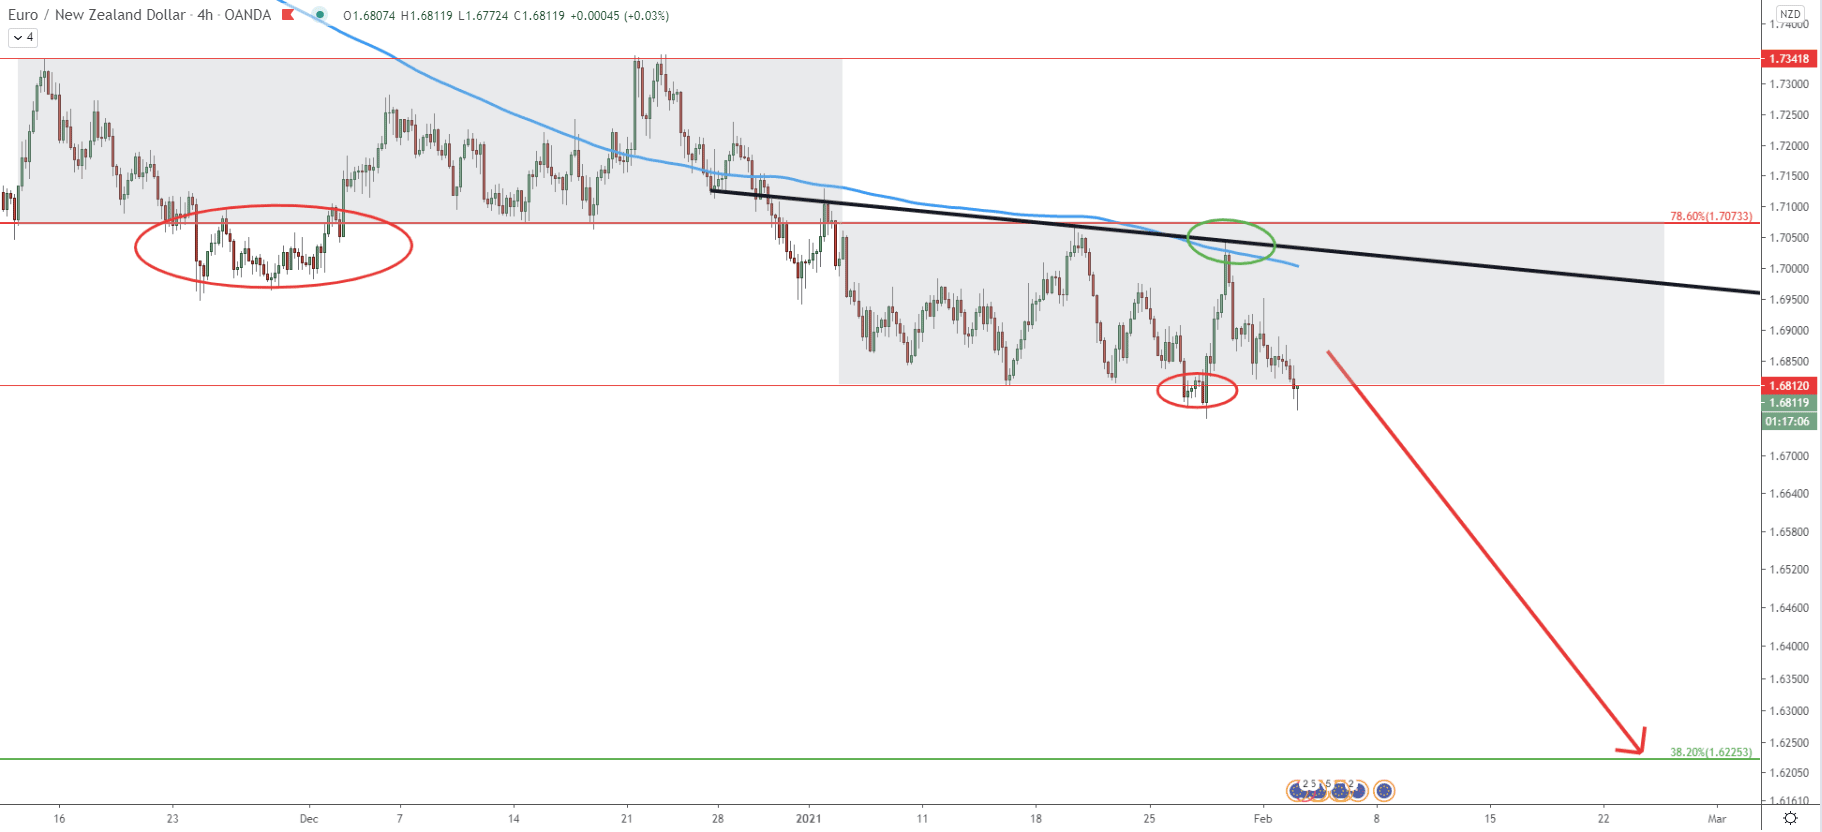
During November-December 2021 EUR/NZD was trapped between support and resistance. There was an instance where the support was broken, suggesting that the price could be ready to move lower. If we compare that price action to the current one, it is very similar. Price has been stuck between the 1.6812 support and 1.7073 resistance. And at the end of February, there was a clear break below the support, after which the price went up sharply, but rejected the average price downtrend trendline.
Right now, EUR/NZD is back below the support, yet again indicating the strong selling pressure. This means that price might continue to drop any moment, even starting from today.
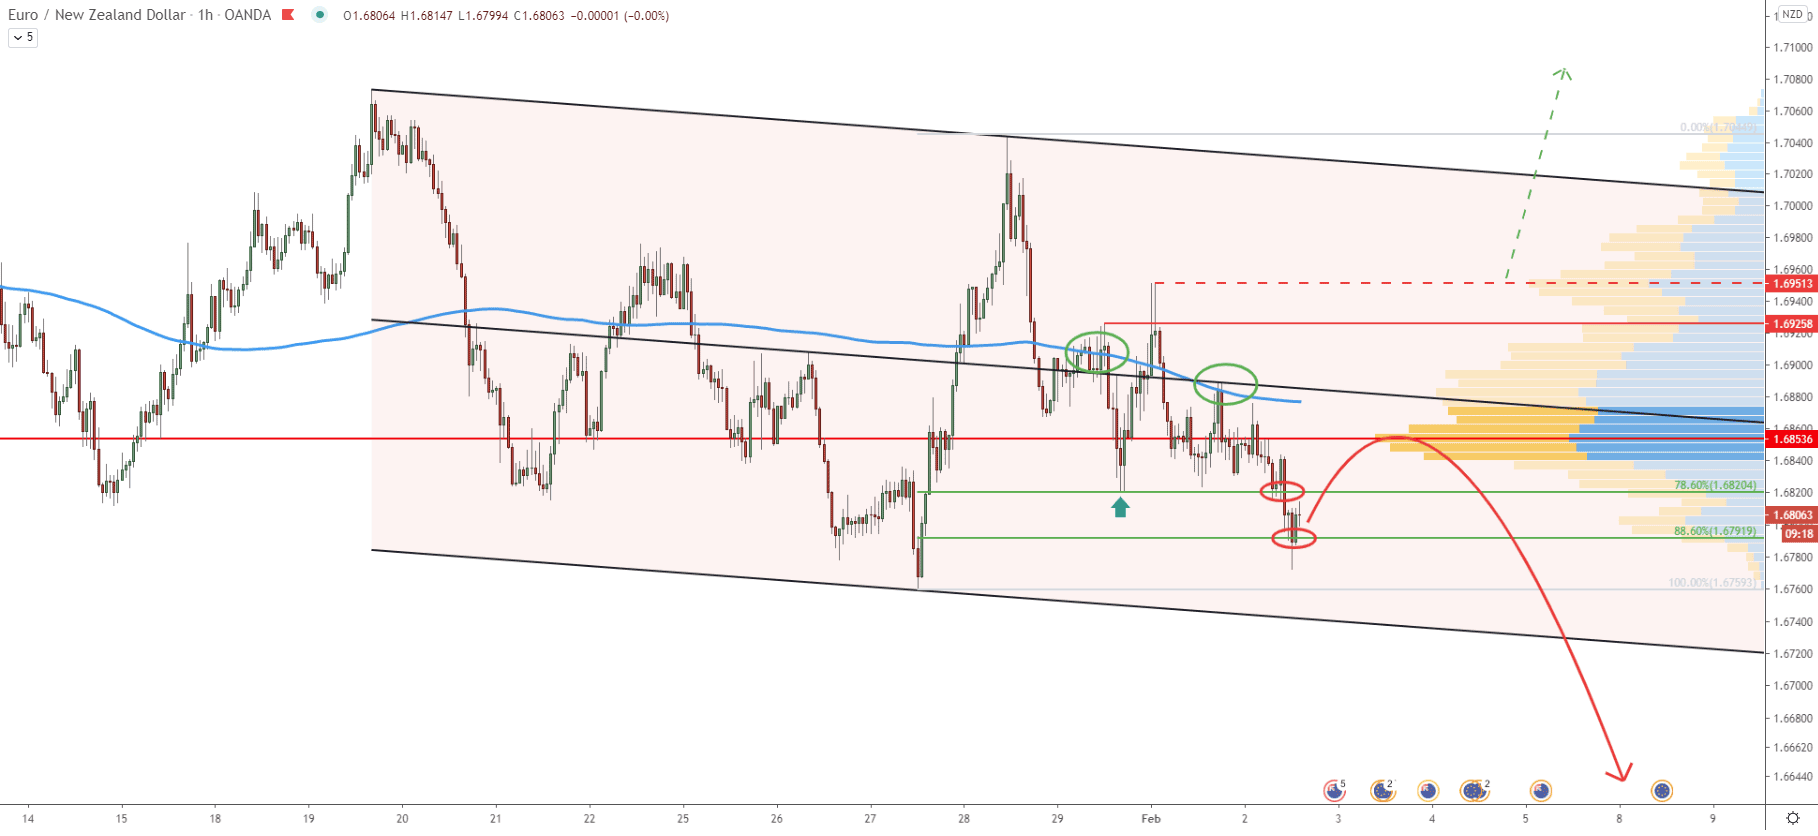
And finally, an hourly chart, where price yet again moving within the descending channel. At the time when the price bounced off the 200 EMA, there was also a rejection of the middle trendline of the channel. Price also broke below all Fibonacci support levels, especially the 78.6% Fibs at 1.6820 and 88.6% Fibs at 1.6791. Therefore, it can be concluded, that sellers are currently in control, and any small pullback could be providing an opportunity for them. The most interesting price area is near 1.6850 because this is the level when the most trading volume has occurred based on the Volume Profile indicator.
EUR/NZD trend could have turned from bullish to bearish after multiple breakouts downtrend trendline as well as the descending channel. Price continues to bounce off the resistance indicators and producing lower lows and lower highs. All-in-all, this is likely to result in a 600 pip price drop during the next week or two.
As per the weekly and 2-day chart, the key support is located at 1.6225, which is confirmed by two Fibonacci retracement levels.
As per the hourly chart, the key resistance is at 1.6951, which is the highest point reached when the 200 EMA was rejected for the first time. As long as the price remains below this level, the downtrend will be valid. On the other hand, a break above 1.6951 will invalidate the bearish forecast, and EUR/NZD trend is likely to turn bullish for the medium term.
Support: 1.7660, 1.6225
Resistance: 1.6850,1.6950