
Published: February 14th, 2020
Today we will observe the EUR/NZD currency pair due to the very interesting timing for the trade setup. We will analyze 4H, 1H and 15M timeframes for the most precise short and mid-term overview.
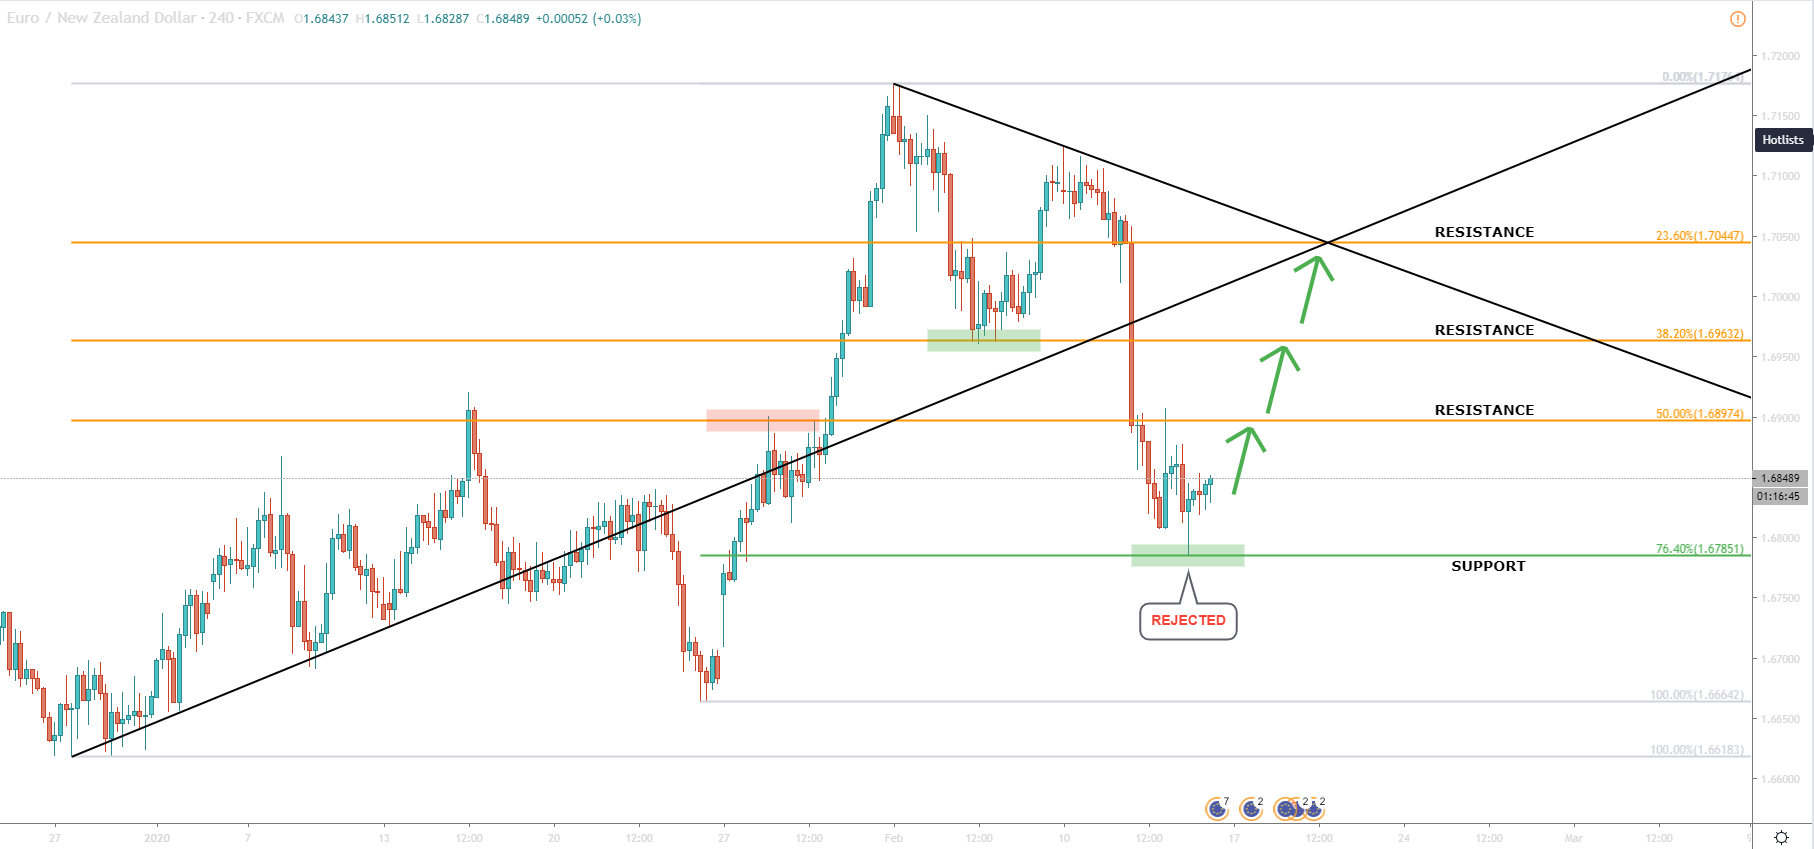
On the 4H timeframe, we can see a very sharp correction down from 1.7124 down to 1.6784. It was a 312 pips decline, where the pair lost 1.82% in less than 4 days. The price decline was stopped exactly at 76.4% Fibonacci retracement level applied to the 24 January - 03 February upside wave. Such a clean bounce could be the starting point of the long-term uptrend continuation resulting in growth towards one of the Fibonacci resistance levels applied to the entire uptrend that has started back on January 26.
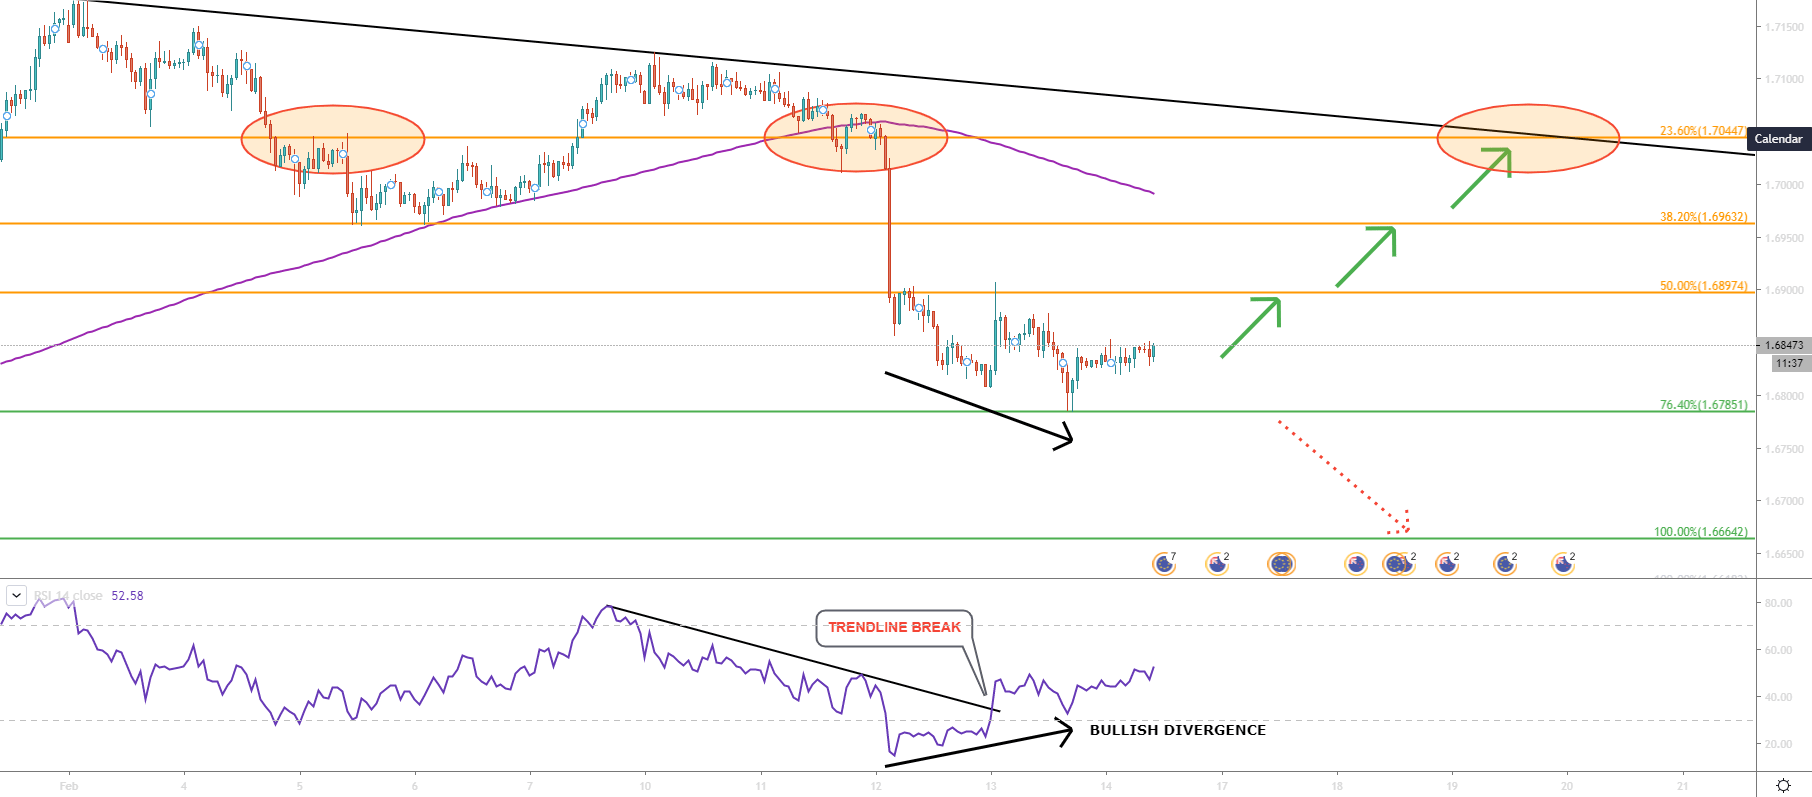
On the 1H chart, we can see more technical confirmations that the price could start rising. First, is the fact that the RSI oscillator formed a bullish divergence. Second, is the fact that RSI broke above the downtrend trendline. These are some strong indications of a trend reversal on the 1H timeframe. On this chart, we can see the area where the price broke below the 200 Moving Average . This area corresponds to the 23.6% Fibonacci retracement level and could be the final upside target.
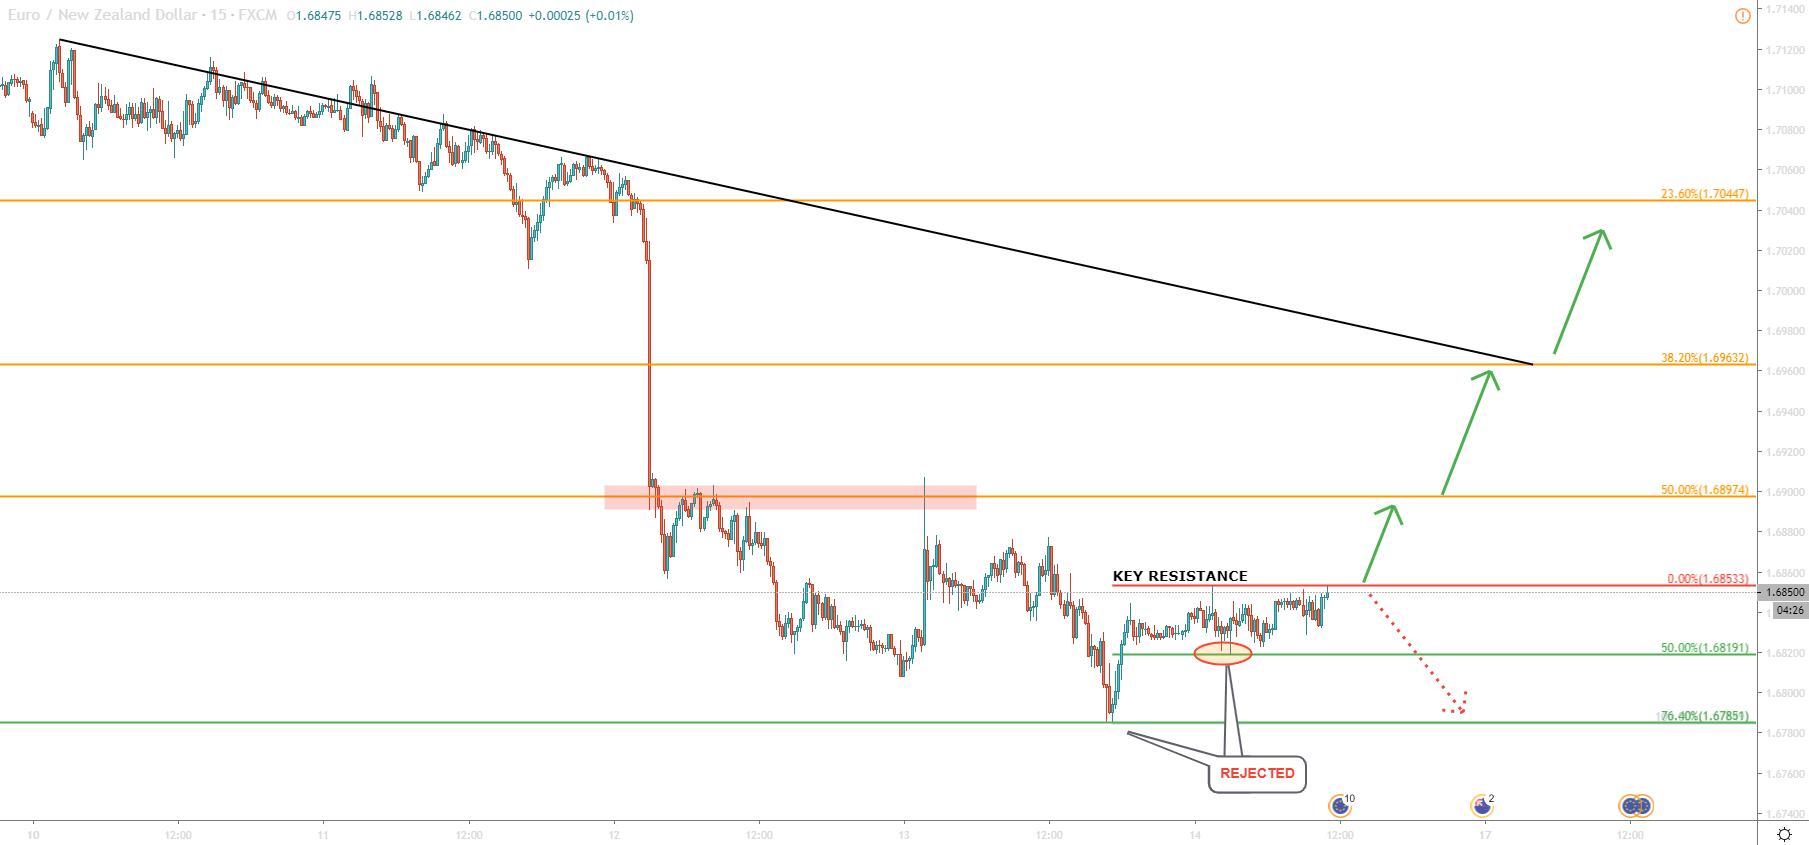
So why might it be a decision-making point? While EUR/NZD has consequently produced a clean bounce off two Fibonacci support levels, it also formed a double top at 1.6853 area. Today, market participants will have to decide where to push the price. In order to move higher, break and close above 1.6853 on a 1H timeframe is required. This should trigger a strong and fast upside rally.
There are 3 resistance levels to watch. The nearest is a 50% Fibonacci retracement level at 1.6897. This price is very near the 1.6900 psychological round number and can give further clues as to whether the price will go higher or not.
1H break and close above 1.6900 would give room for more growth, while the next resistance is located at 38.2% Fibonacci level. This is 1.6963 price, which also corresponds with the downtrend trendline on the 15M chart and should be threatened as the next upside target.
1H break and close above 1.6963 can result in a final wave up towards 23.6% Fibonacci retracement level at 1.7044. This price corresponds to the downtrend trendline on the 4H chart.
Long-term uptrend continuation is expected as long as EUR/NZD remains above 1.6785. However, for this scenario price must break and close above 1.6854 on the 1H chart.
Altogether, there are 3 resistance levels corresponding to Fibonacci retracement.
Any of these levels can stop further growth and therefore should be monitored closely for rejection.
The most likely downtrend confirmation would be a break below the 76.4% Fibonacci support at 1.6785. This action would invalidate the bullish forecast and the consolidation phase is likely to begin. After consolidation EUR/NZD will likely continue trending downwards.
Support: 1.6819, 1.6785, 1.6664
Resistance: 1.5853, 1.6897, 1.6963, 1.7044