
Published: February 19th, 2020
Today we will observe yet another extremely interesting trading opportunity. This time it will be EUR/JPY which shows a very strong selling pressure on multiple timeframes.
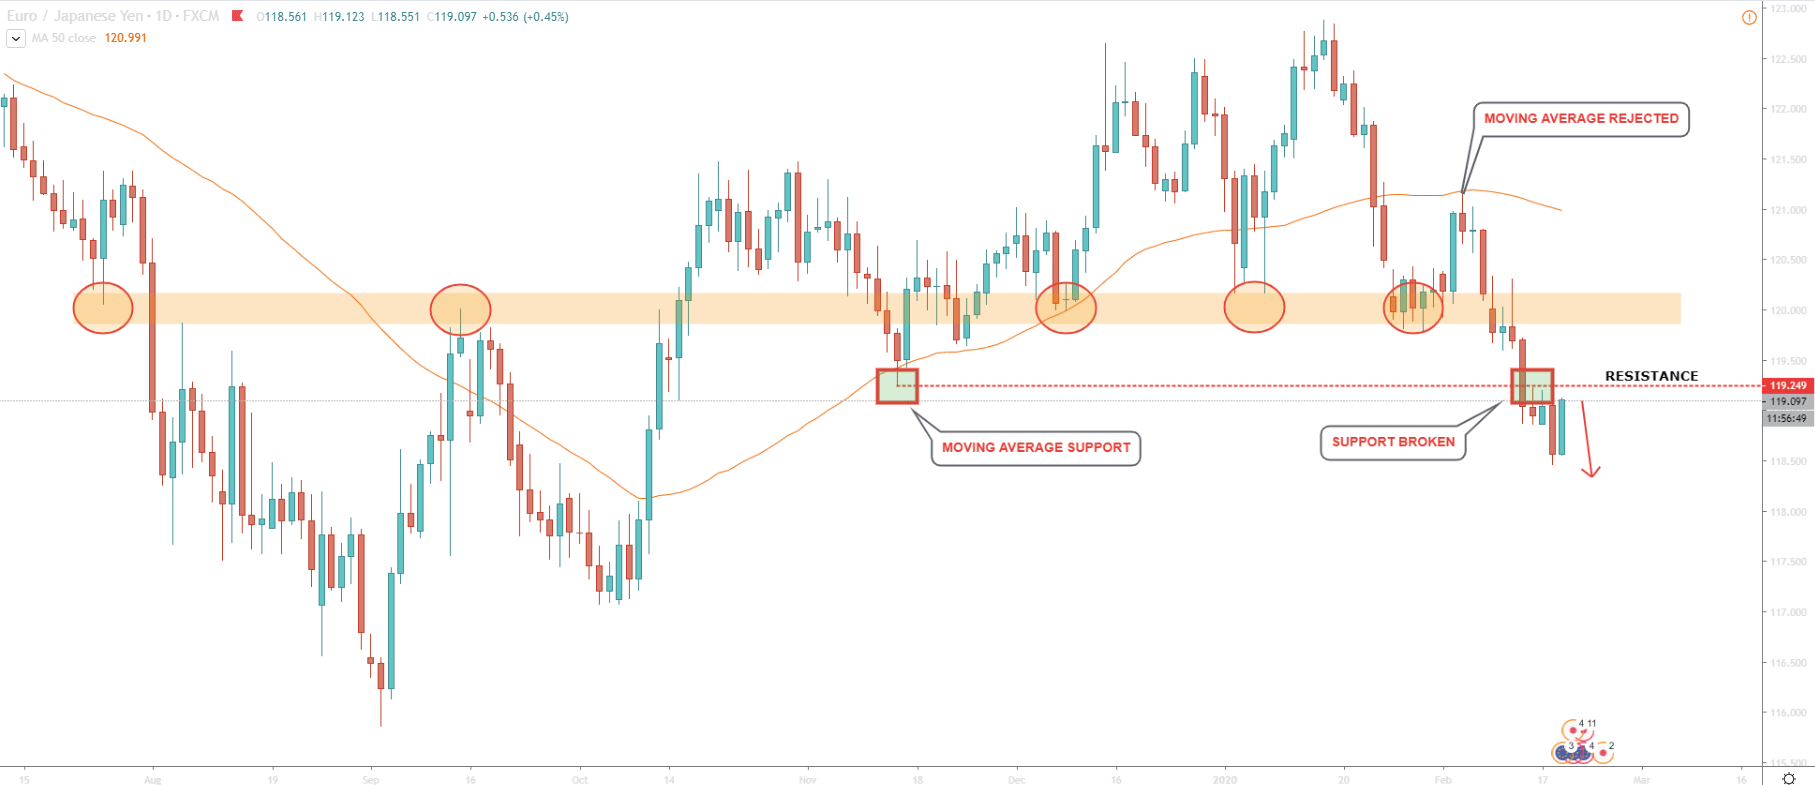
Above is the EUR/JPY daily chart where we can see the big picture. On January 16, the price reached 122.87, hitting 4-months high. At the same time, it produced a triple top resulting in the beginning of a downtrend. While moving down, price broke below the 50 Moving Average but rejected 120.00 psychological support area.
Corrective wave up followed and 50 Moving Average proved to be the supply zone where sellers showed great interest. MA was rejected cleanly, followed by a continuation of the decline. This time 120.00 psychological area has been taken out and then 119.25 support was broken.
It looks like EUR/JPY simply penetrating through all the obstacles on its’ way down and nothing can stop the price from falling even more.
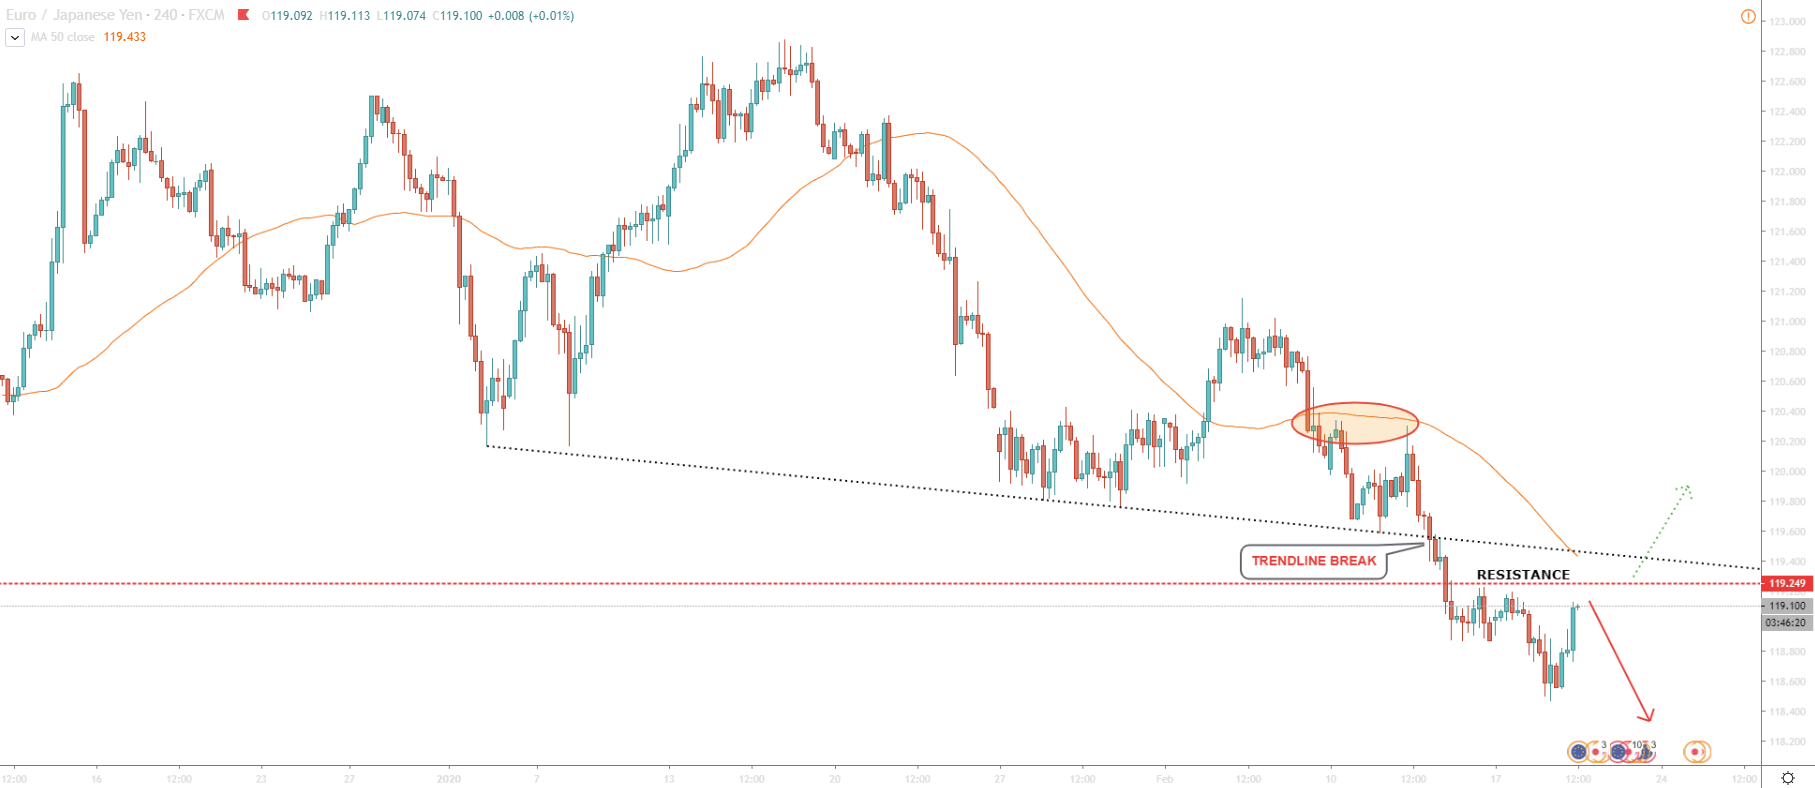
On the 4H chart, the downtrend becomes even more obvious. Price broke the support trendline, prior to which, rejected the 50 Moving average. In the near future, the support trendline might become a resistance, along with the 50 Moving Average. However, the nearest resistance remains at 119.25 level and it will be interesting to see market reaction around this area. As long as the price is below the resistance, selling pressure will remain very strong.
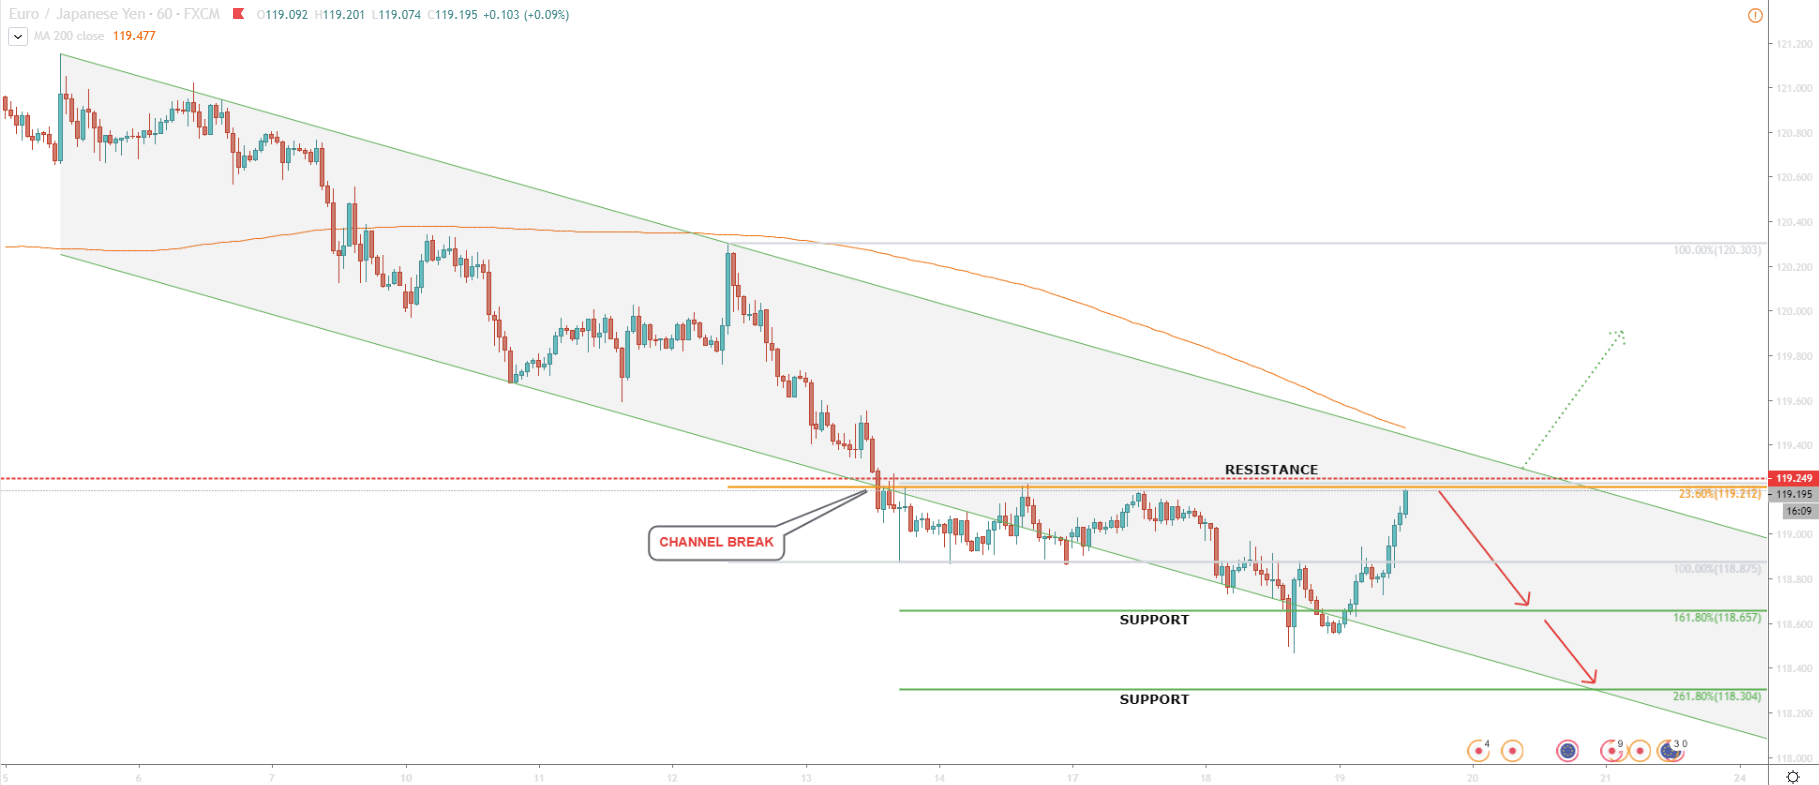
And finally, the 1H chart provides even deeper insight into current price action. From February 5, until February 13, the price stayed within the descending channel. But, on the 13th, EUR/JPY broke below the lower trendline of the descending channel. Price has reached 118.87 low and corrected up to 23.6% Fibonacci retracement level at 119.21. This makes an 119.25 a key resistance area, which up until now has been respected by the market. Even today pair has touched 119.22 and still remains below the resistance.
The downtrend validity hasn’t been compromised and there is a very high probability that EUR/JPY price will continue to go down. Currently, price is very near key resistance (119.25), which seems to be the area of interest for bears.
In order to find support level, we have applied the Fibonacci retracement level to the corrective wave up after the break below the descending channel. There are two support levels, each of which might act as a downside target.
As long as resistance at 119.25 is holding, the downtrend will remain valid. But, a 1h break and close above this level will invalidate the bearish scenario immediately. At this stage, price is likely to start rapid growth. Watch the resistance level very closely as this might be the trend turning point. Break above the resistance could even be a signal to buy EUR/JPY.
Support: 118.65, 118.30
Resistance: 119.25