
Published: February 24th, 2020
EUR/GBP showing some mixed sentiment on different timeframes. We will look into 4H, 1H and 30M charts to see what kind of trading opportunity would be the most probable in the coming days.
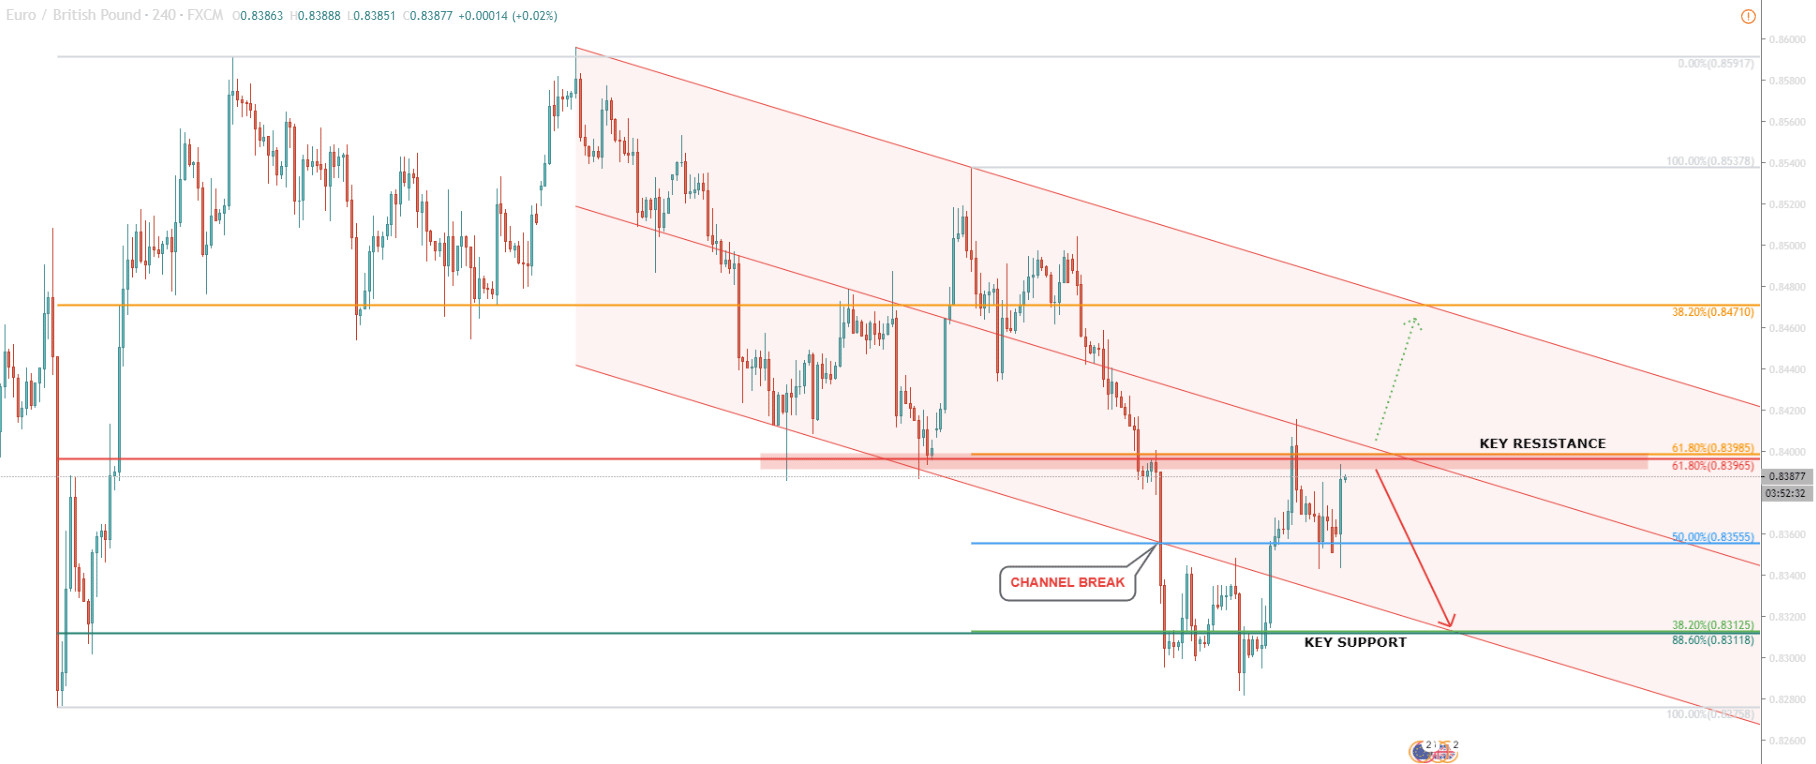
The 4H chart shows a very wide range trading, with the top being near 0.8600 and bottom near 0.8275. There doesn’t seem to be any major directional move going on, but since Brexit, the price has been steadily moving downwards.
EUR/GBP price has been slowly decreasing and staying within the descending channel. Nevertheless, the price broke below the lower trendline on the February 13 and produced a 44-day low while hitting 0.8282.
Fibonacci applied to the channel breakout, where 50% retracement is placed on the breakout point, shows that price is currently near 61.8% Fibonacci resistance level at 0.8400. At the same time, the Fibonacci applied to the 13-24 December wave up, shows that 61.8% retracement is yet again located near the 0.8400, which is a strong psychological level. And finally, this is the are of the previous support where price formed a double bottom throughout 24-31 January. Interestingly, the double bottom support was formed just prior to Brexit, although now it is broken.
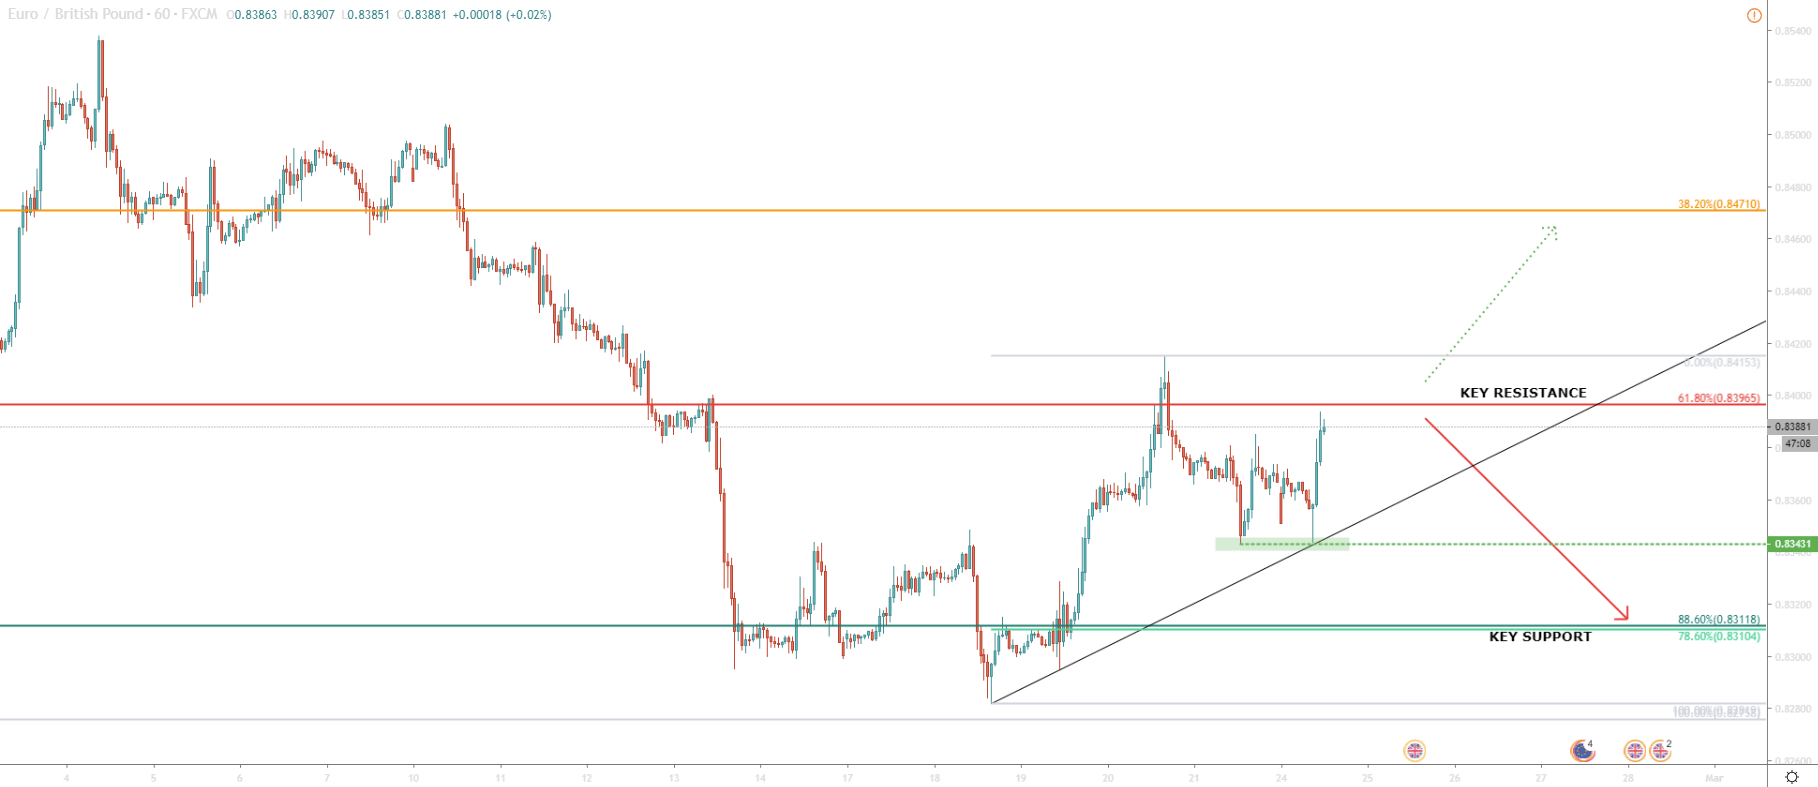
On the 1H chart, we can see a correctional wave up, with the highest point tested at 08415. And here we can see the possibility of an uptrend continuation. This is because EUR/GBP produced a double bottom and rejected the uptrend trendline at 0.8343. However, the daily close was below the 0.8400, which is an indication of the sellers’ domination. This could lead to a further price decline, but only if the pair remains below the 0.8400 resistance area. Currently, EUR/GBP is trading at a very important level, which is still more interesting for selling opportunities.
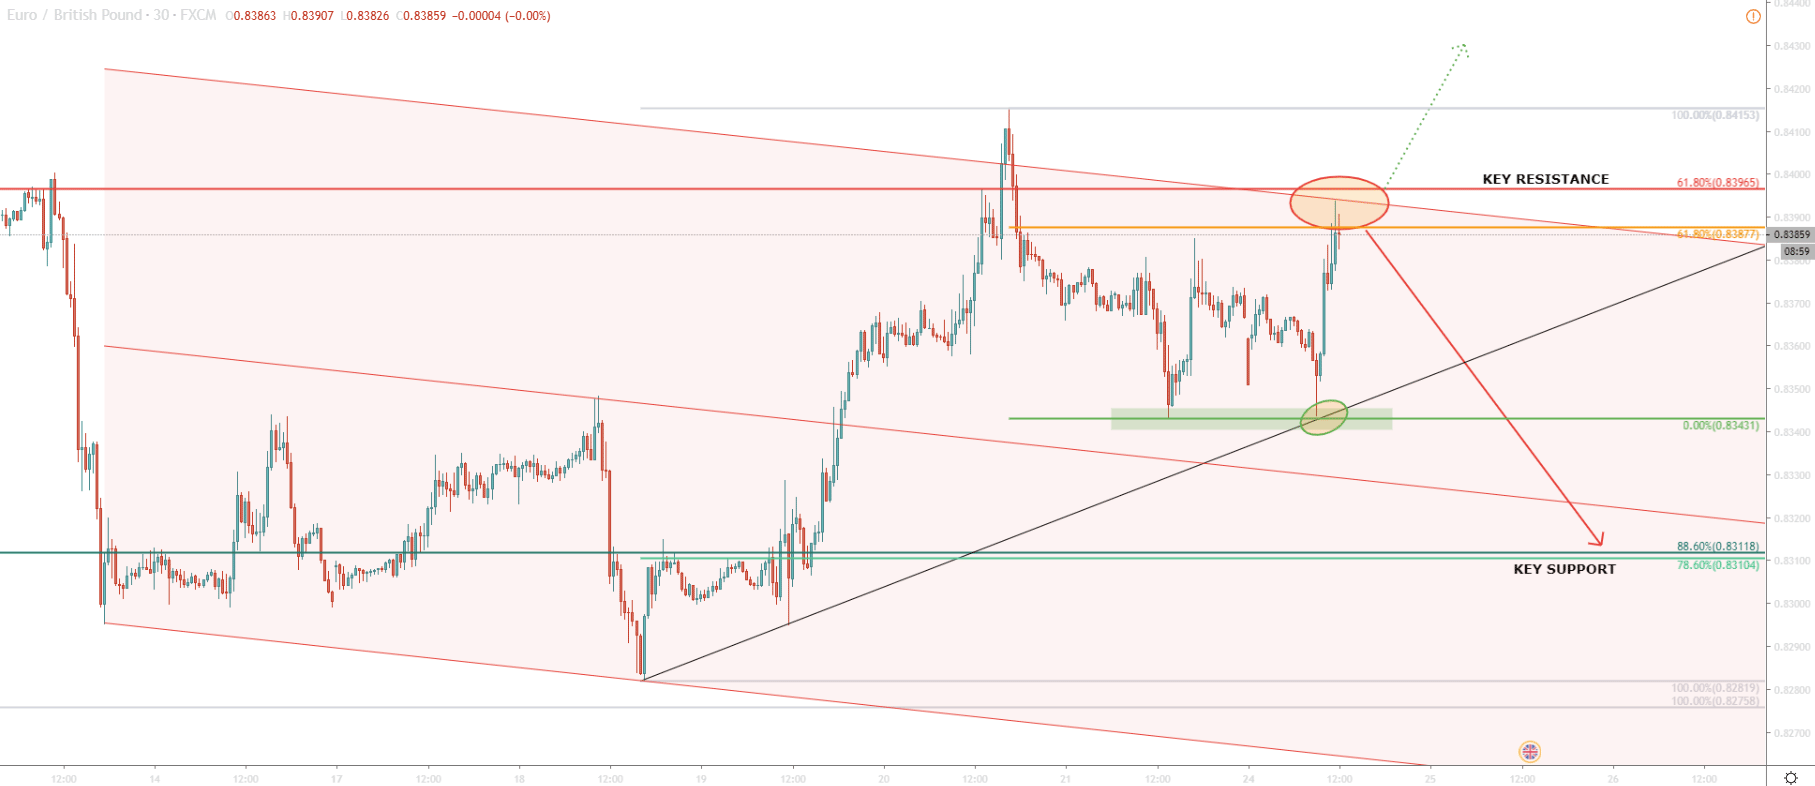
On the 30M chart, we have applied an extended descending channel, which shows, that today’s price rejected the upper channel trendline. At the same time, it failed to close above the 61.8% Fibonacci retracement level, applied to the 20-21 February wave down. All-in-all, the price could be right at the top of correction and from this point start to move down.
What is very clear, is that EUR/GBP is trading near key resistance level, which is extremely attractive for sellers. Buyer are likely to enter the market only if and when price breaks above 0.8400. But currently, the downtrend scenario has a higher probability and therefore providing a good risk/reward trading opportunity.
There is one extremely important support level, which is confirmed not by one, or two, but three Fibonacci retracement levels applied to various waves. These are 78.6%, 88.6% and 38.2% (of the Fibonacci applied to the channel breakout point.
All these levels are pointing out a single price level, and this is 0.8310. It could be considered as key resistance and a potential downside target.
As per the 1H chart, the price rejected the uptrend trendline. But after rejection still failed to produce a new higher high. The first alarm that the price is likely to go higher would be 1H break and close above 0.8400 psychological resistance. Final confirmation might be a formation of a new higher high, where the price will go beyond 0.8416. This should invite more buyers, which over the medium term could push the price much higher, towards the 0.8470 area.
Support: 0.8343, 0.8312
Resistance: 0.8387, 0.8396, 0.8471