
Published: October 30th, 2020
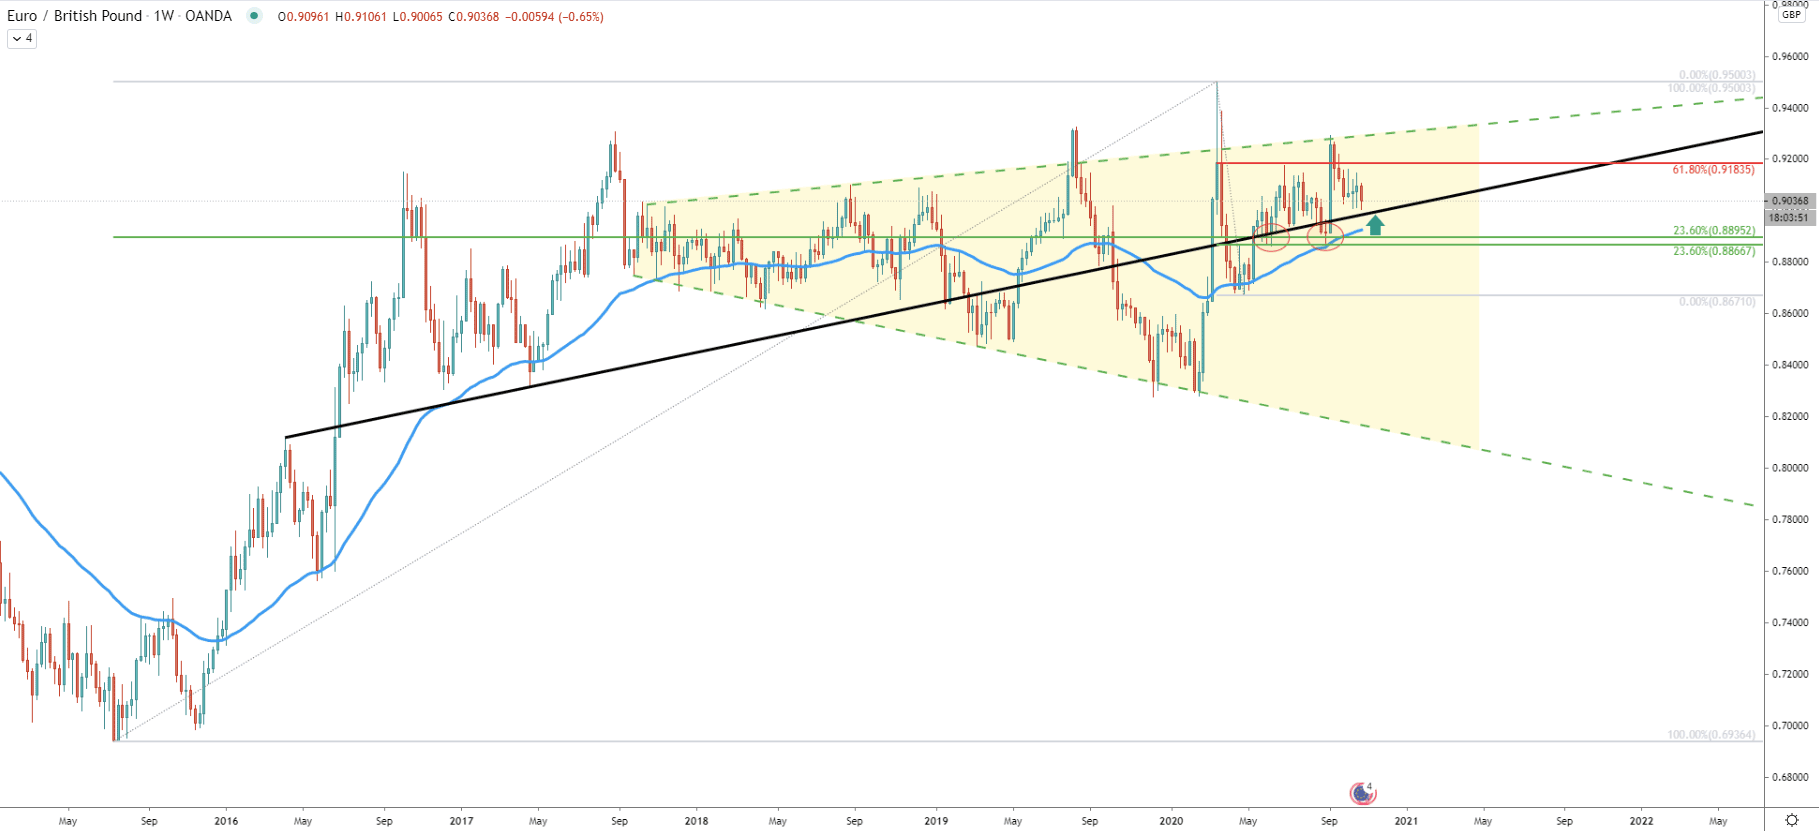
EUR/GBP long-term trend is bullish although the price action shows that currently, a consolidation phase is taking place. While the support downtrend trendline has been rejected, the resistance uptrend trendline has been broken, suggesting a higher probability for the uptrend continuation. The average-price uptrend trendline was also rejected along with two 23.6% Fibonacci retracement levels. These support levels are located between 0.8866 and 0.8895 and provide a strong demand area for buyers. At the same time, there was a rejection of the 50 Exponential Moving Average, also suggesting buyers are still in control.
Based on the Fibonacci retracement indicator applied to the last corrective wave down, the nearest resistance could be at 0.9183, which is a 61.8% retracement level. However, prior to the uptrend continuation, EUR/GBP might re-test the average-price uptrend trendline. But it will be extremely important to see that the daily close remains above the 0.9000 psychological level for the uptrend to remain valid.
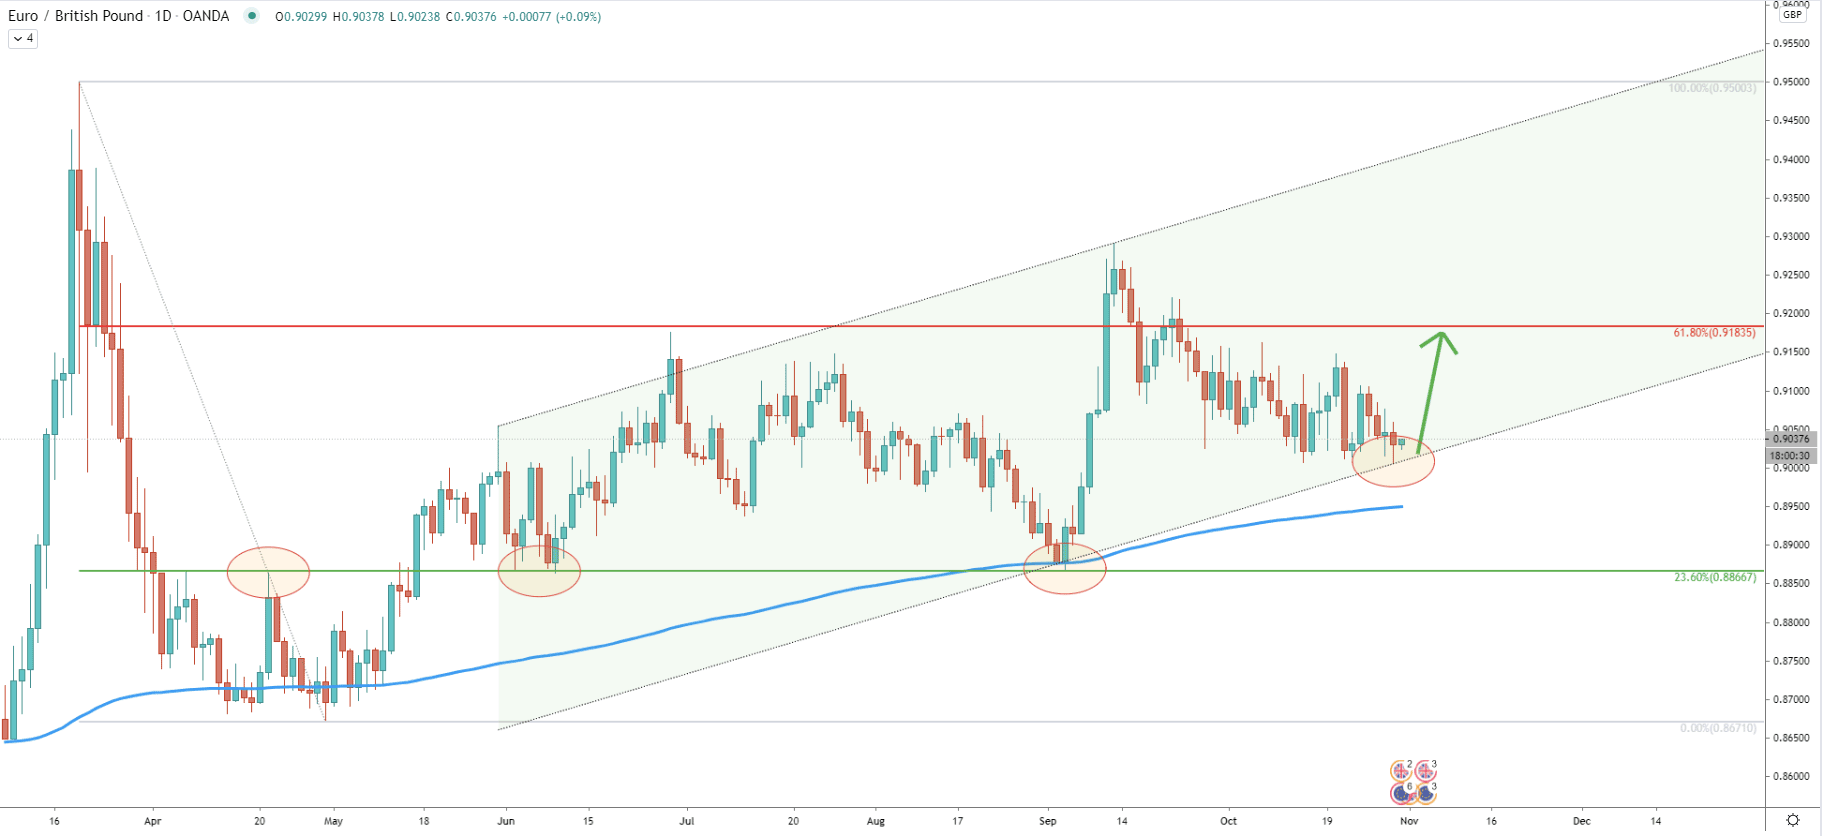
On the daily timeframe price continues to move within the ascending channel, validating the uptrend. At the beginning of September pair rejected the 200 Exponential Moving Average. Simultaneously prie has bounce doff the 23.6% Fibs at 0.8866. This level previously acted as the resistance as well as the support, making it a very attractive demand zone. While the trend is bullish, there is a possibility that EUR/GBP will attempt to re-test the 200 EMA, spiking below the most recently printed low. Of course, it is important to see the daily closing prices above the bottom of the channel for the uptrend to continue.
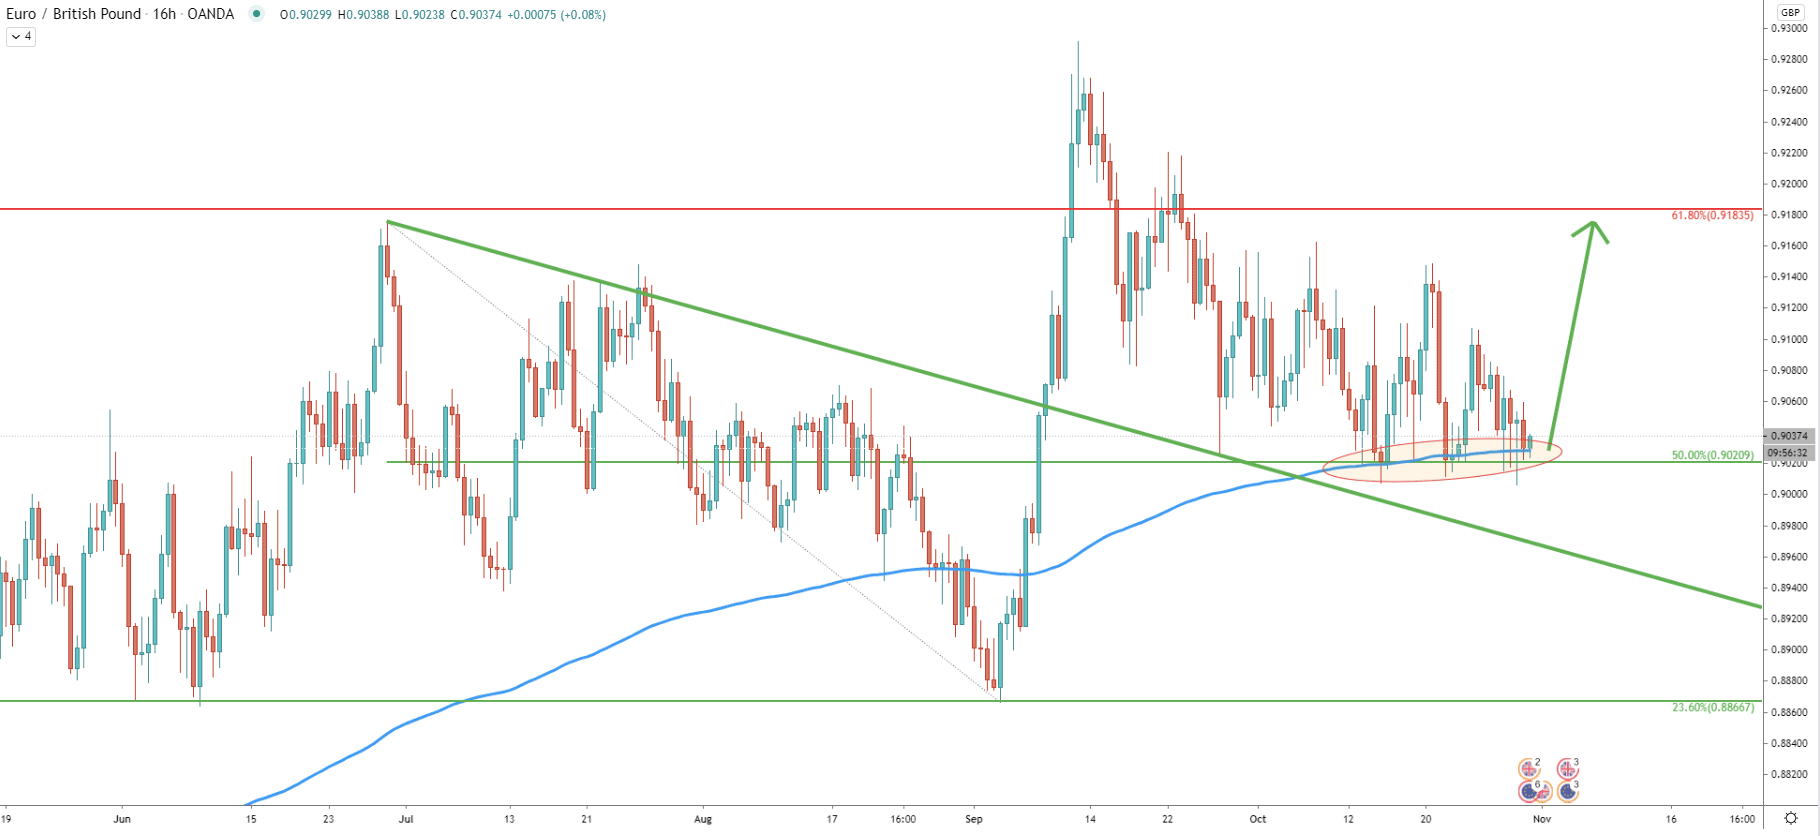
On the 16-hour chart, it can be witnessed that price I once again continues to reject the 200 Exponential Moving Average, which provides enormous support along with the 50% Fibonacci retracement level at 0.9020. The average-price downtrend trendline was also rejected, and all these facts strongly supporting the scenario where uptrend continuation will take place. Although the price is getting very choppy and therefore spikes below the support should be expected, and can even reach the support downtrend trendline, before/if the uptrend will take place.
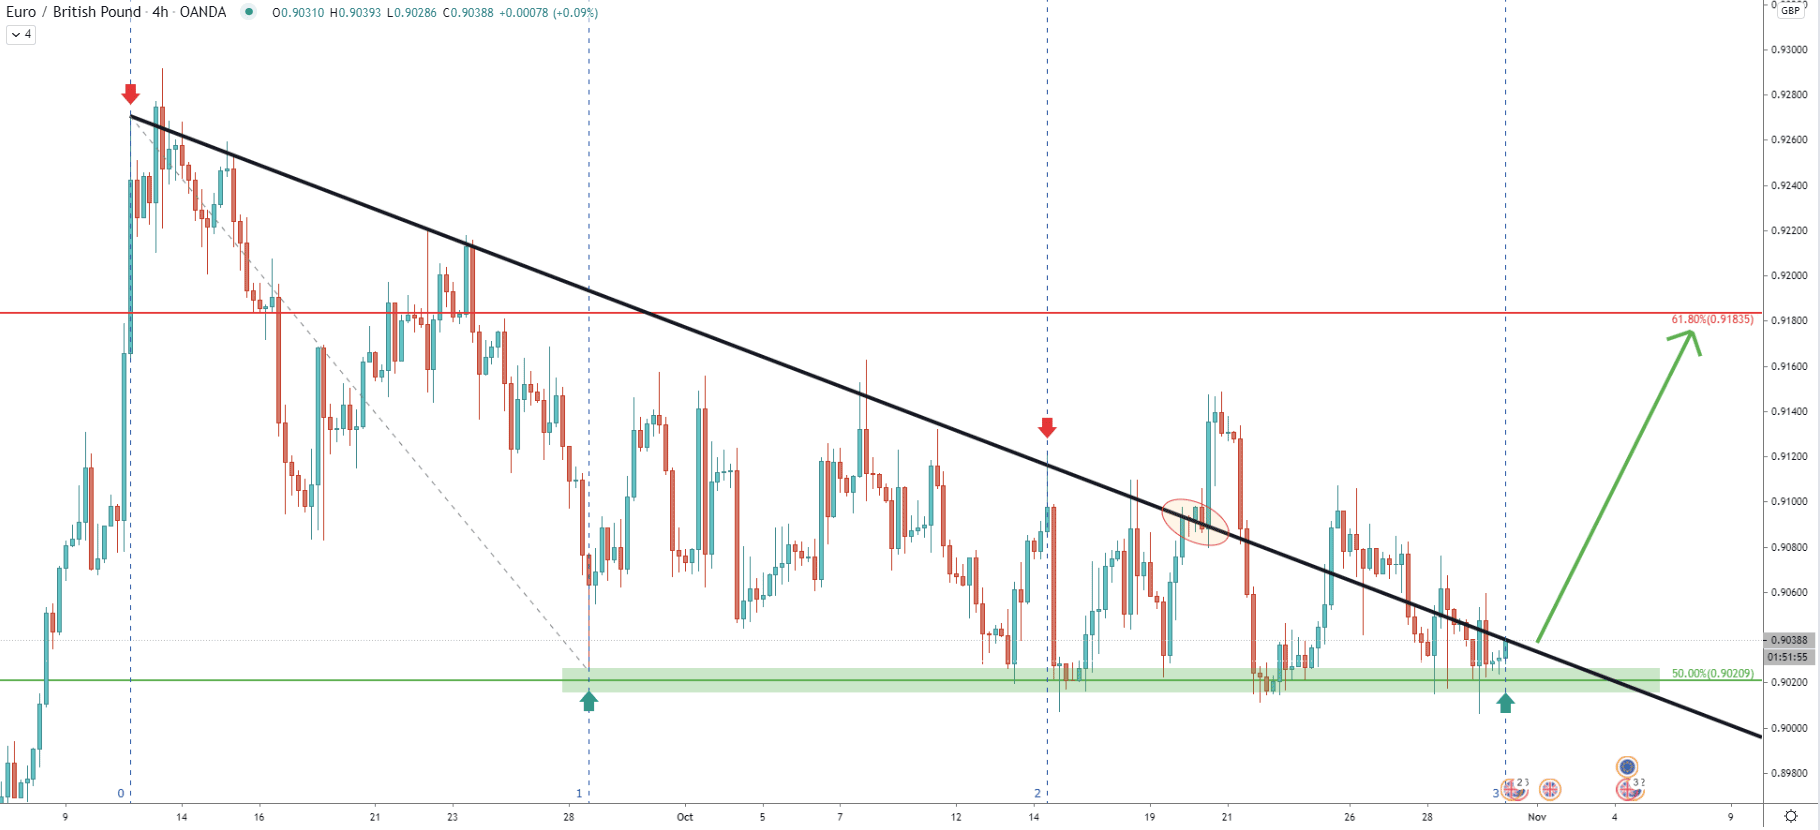
EUR/GBP has been trading below the downtrend trendline for an extended period of time. Although on October 20 it broke above the trendline with confidence. This could have been the very first bullish sign on a lower timeframe, although after the breakout price went down sharply. It has tested the 0.9000 psychological support area once again, which has been rejected. This goes to show that bulls are defending this support and as long as the daily closing price remains above it, an uptrend is likely to start.
The Fibonacci cycle was applied through the high and first low of the triangle pattern which shows that the next cycle has just started. Perhaps this week might end with a strong upside move for the EUR/GBP, which eventually will bring the price up to the 0.9163 resistance.
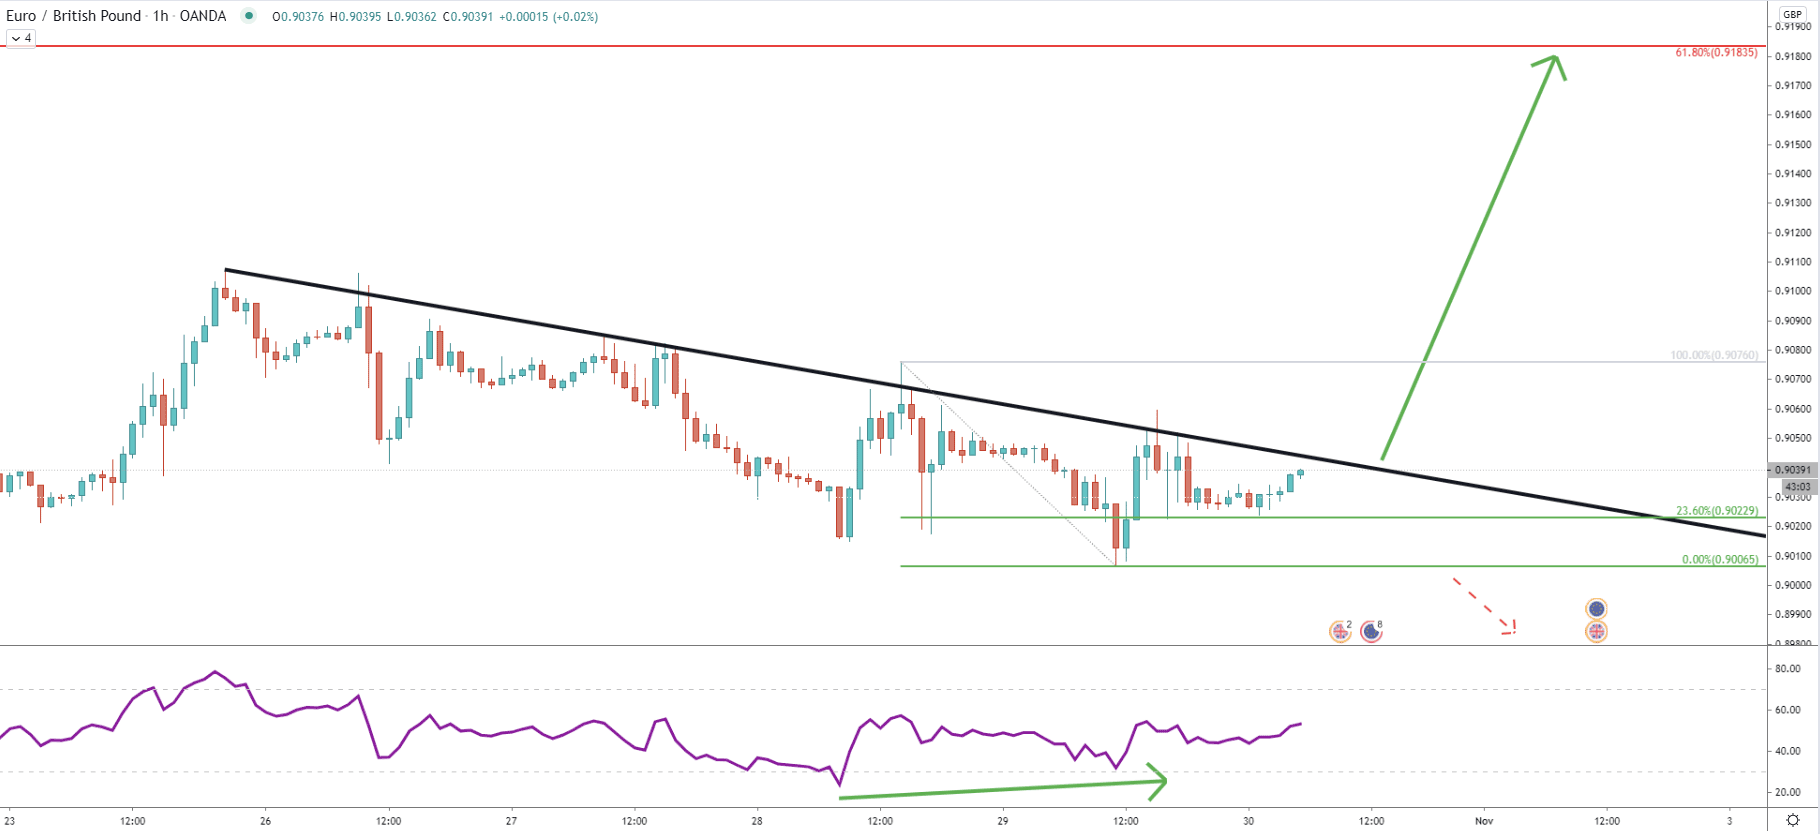
An hourly chart could be providing a final confirmation for buyers. Still, the price remains below the simple downtrend trendline and the trigger point for the rally could be a break and close the trendline. After RSI formed a bullish divergence, the price is facing minor support at 0.9022. If this support holds and the price will break to the upside, the volatility and trading volume are likely to increase substantially, resulting in a strong upside move. However, up until that point consolidation is likely to continue.
The EUR/GBP is currently trading near the enormous psychological support, which is 0.9000. The long term perspective is in favor of the uptrend continues as long as the support holds. Therefore, the current price could be providing a long-term buying opportunity while the price could be still very choppy.
The upside target based on two Fibonacci retracement levels is located at 0.9183
Daily break and close below the 0.9000 psychological support will invalidate bullish forecast and the EUR/GBP downtrend will likely continue.
Support: 0.9020, 0.9000
Resistance: 0.9076, 0.9183