
Published: February 24th, 2021
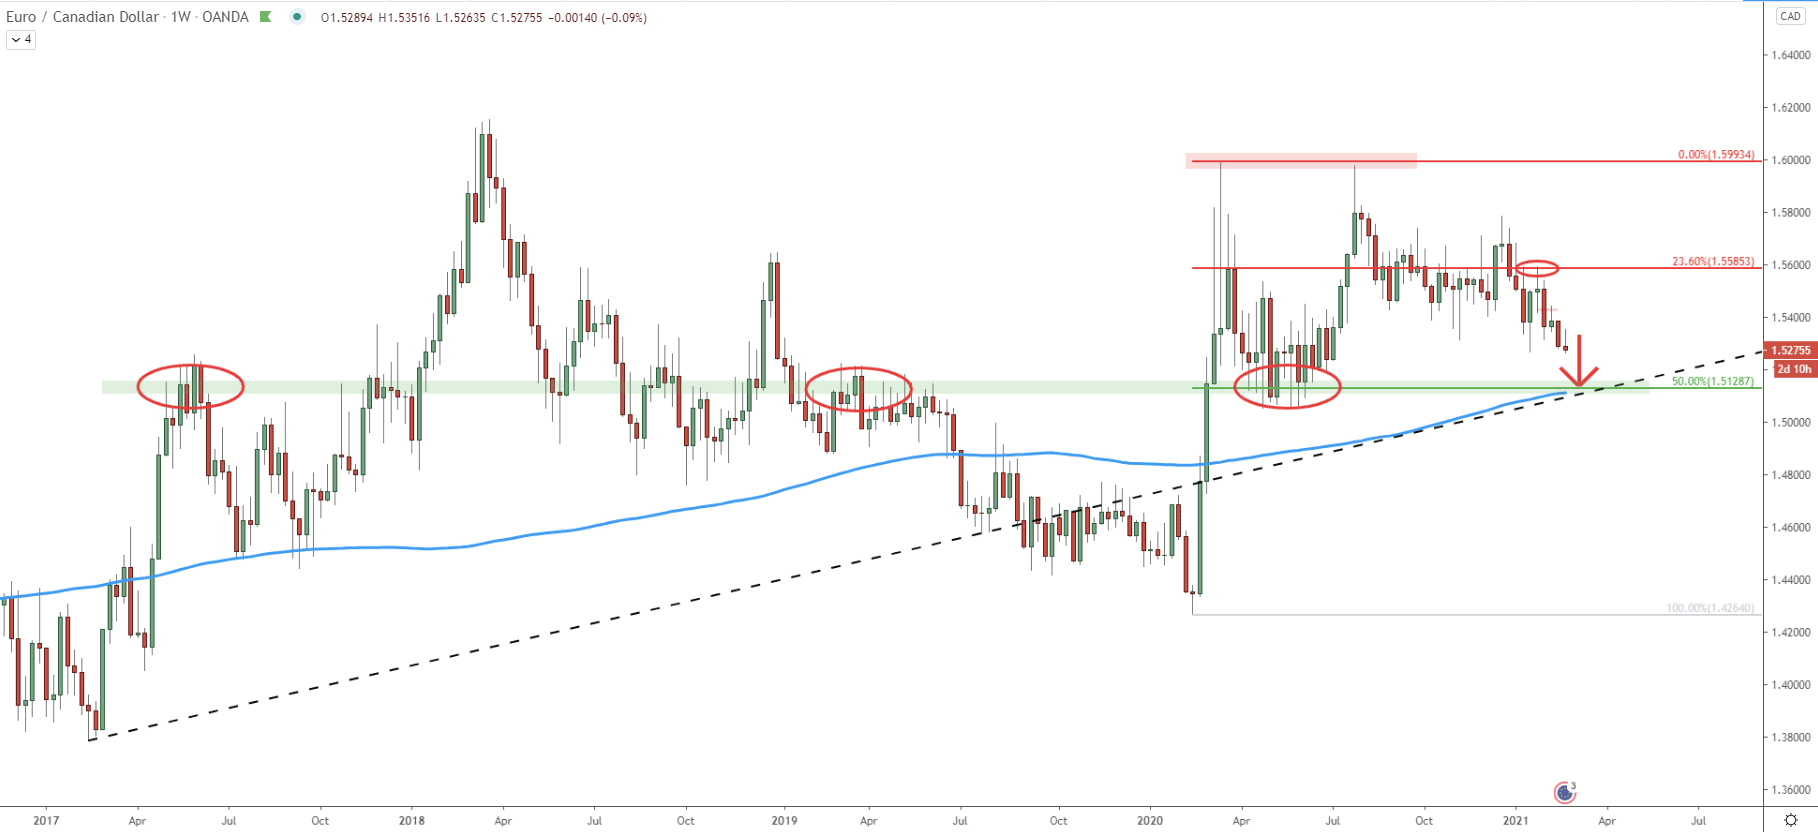
By looking at the weekly chart it becomes obvious that EUR/CAD is currently stuck between the support and resistance areas. The resistance, along with the double top has been formed near the 1.6000, which is a very strong psychological level. On the other hand, the support has been formed near the 1.5130, which is also confirmed by the 50% Fibonacci retracement level. Moreover, the 1.5130 area corresponds to the 200 Simple Moving Average and shows that throughout 2017-2021 it has been acting as a magnet for the price.
Therefore, it can be considered as the critical supply/demand area, and in this case, obviously, it is the demand zone. And finally, it can be seen, that the average-price uptrend trendline also corresponds to the 1.5130 area, making it an extremely attractive profit-taking zone for buyers.
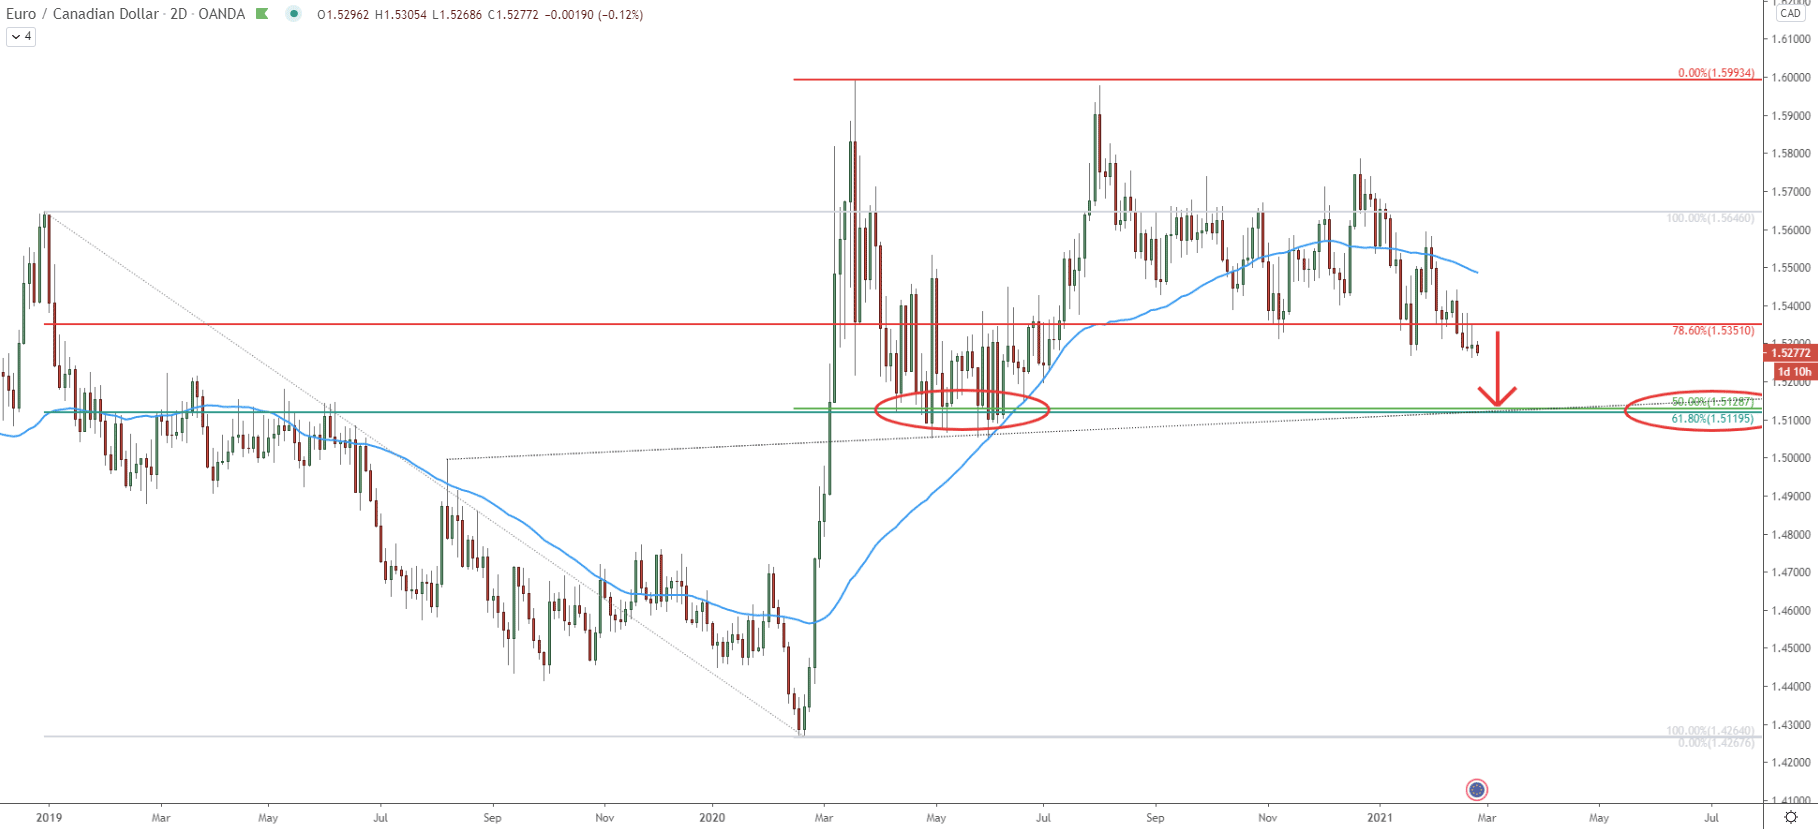
On this chart, the Fibonacci retracement indicator was applied to the previous wave down, where EUR/CAD bottomed out at 1.4264. It shows that just yesterday, the 78.6% Fibonacci retracement level at 1.5351 has been acting as the resistance, and so far, got rejected. Price remains below the 50 EMA and all these facts are in favor of the downtrend continuation towards the 1.5130 support area.
Besides, now there are 2 Fibonacci retracement levels confirming the support, these are 50% as per the weekly chart and 61.8% Fibs based on the previous move down. And finally, the support area goes inline with the average price uptrend trendline, which crossing with the Fibonacci support right at 1.5130.
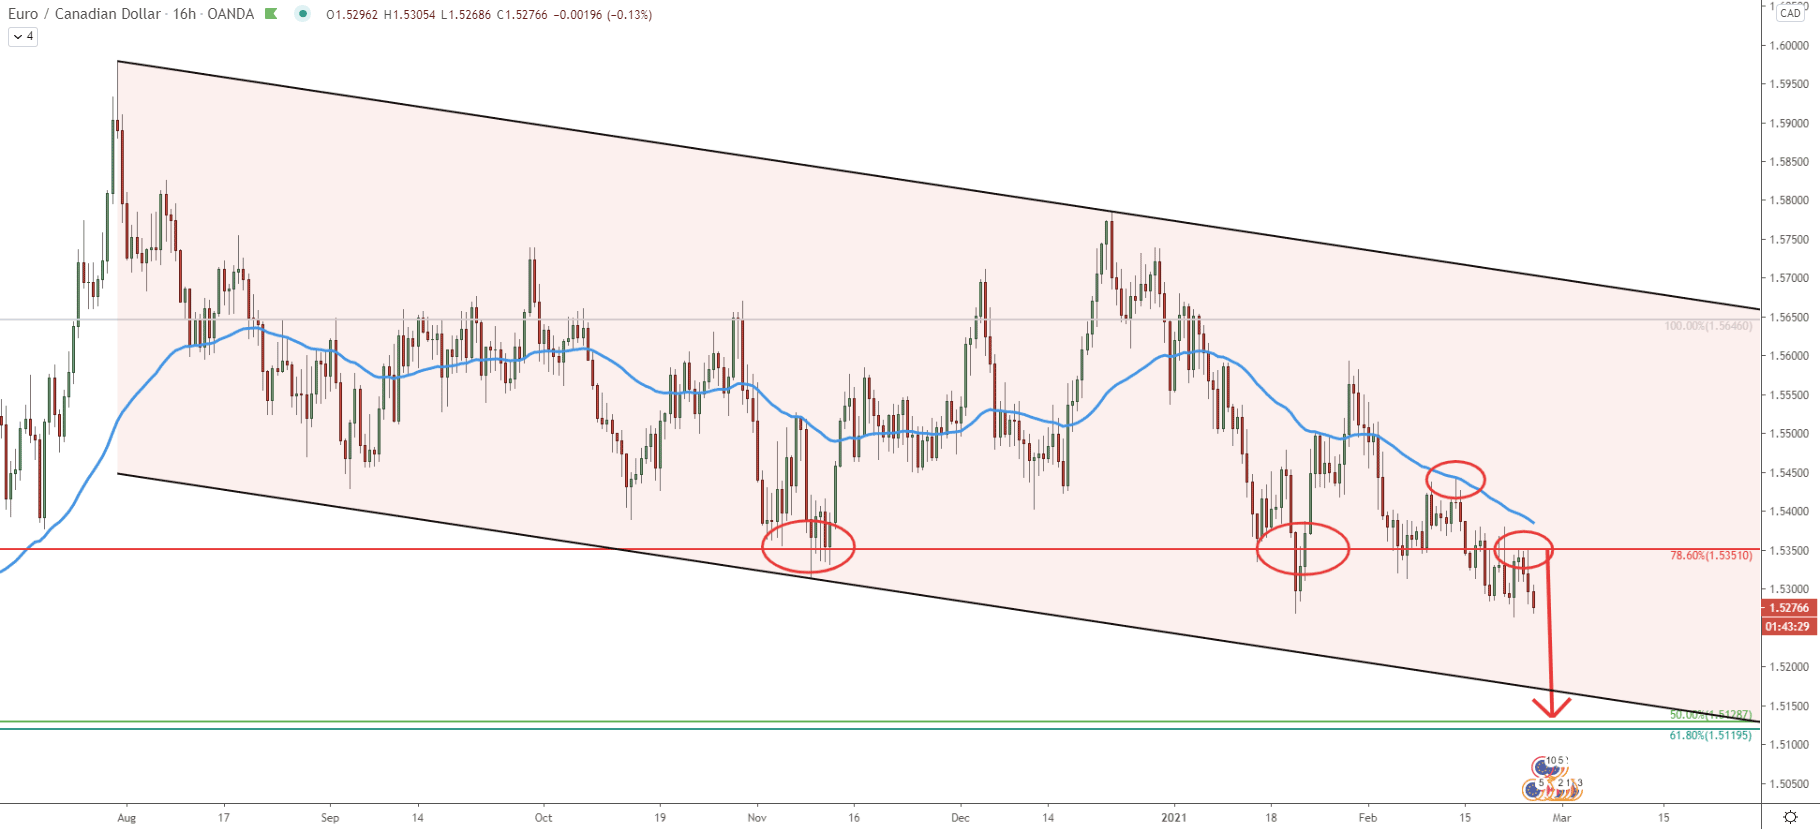
As can be seen on this chart, EUR/CAD continues to move within the descending channel, while the price remains below the 50 SMA. At the end of January, EUR/CAD broke below the 1.5351 support, which is based on the previous demand area as well as 78.6% Fibs. After the breakout, a strong pullback followed, but then the price gradually started to move down. A week ago, there was a clean rejection of the 50 SMA, after which EUR/CAD has managed to produce a new lower low, implying the validity of the downtrend.
Overall, as long as the price remains below 1.5351, selling pressure will remain extremely high and should send the price towards the 1.5130 support, which on this chart corresponds to the bottom of the descending channel.
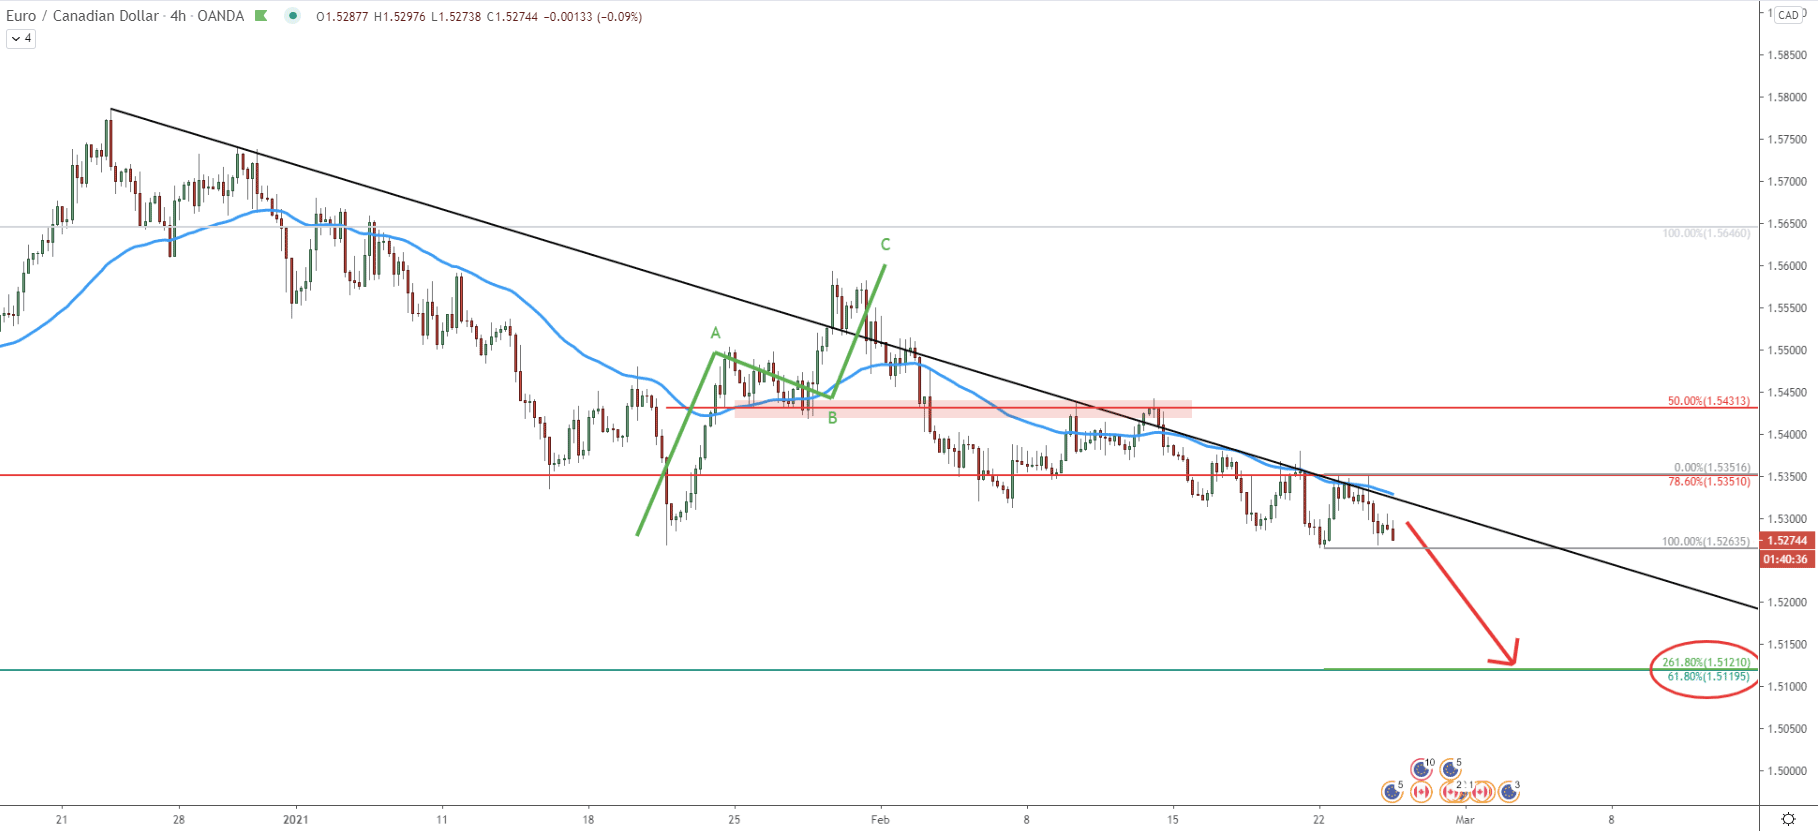
On the 4-hour chart, there are no doubts that the trend is bearish. After completing an ABC corrective pattern based on the Elliot Wave theory, EUR/CAD price continued to decline and formed resistance at 1.5431. This level corresponds to the previous support as well as the 50% Fibonacci retracement level.
After a new lower low has been produced, EUR/CAD found yet another resistance, but this time at 78.6% Fibs. At the same time, the downtrend trendline along with the 50 SMA was rejected, yet again confirming the validity of the strong bearish dominance.
Fibonacci applied to the most recent pullback, where 78.6% Fib resistance, the downtrend trendline, and 50 SMA were rejected, shows that 261.8% Fibs corresponds exactly to the previously mentioned support at 1.5120. This means that the key demand area is located between 1.5120 - 1.5130
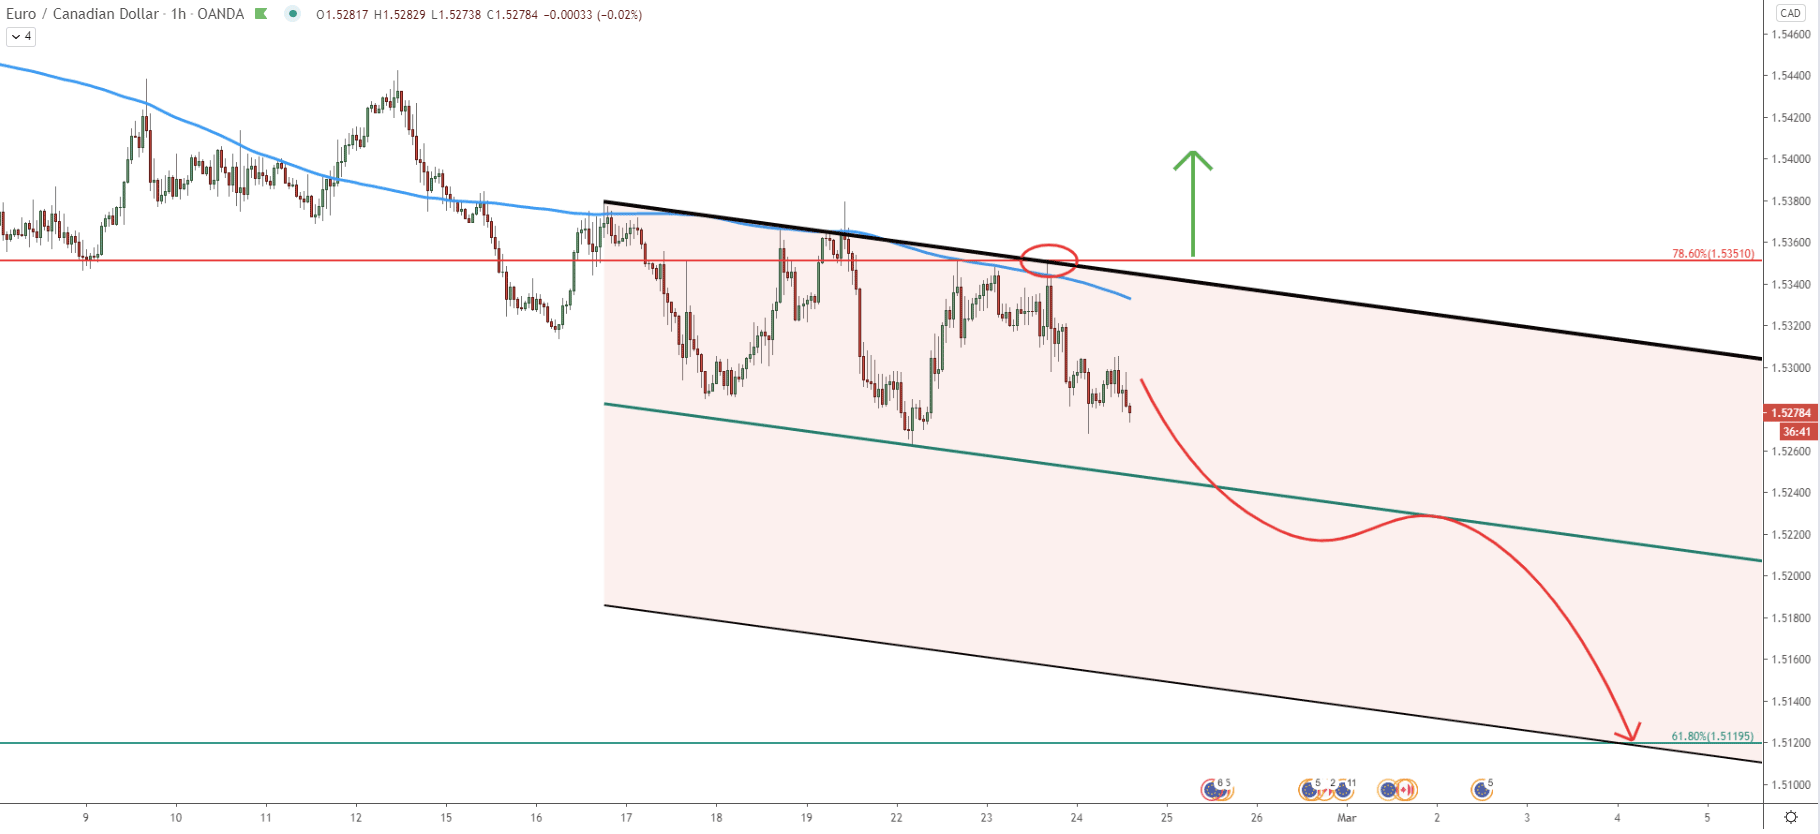
On the hourly chart, the price also moving within the descending channel as well as below the 200 SMA. Right now, the downtrend continuation holds a much higher probability in comparison to the trend reversal scenario. Perhaps throughout this and next week EUR/CAD will break below the descending channel and will head towards the 1.5130 support area, which also corresponds to the bottom of the extended descending channel.
While the EUR/CAD is stuck between the support and resistance on the weekly chart, there is no clear direction. However, on lower timeframes price remains extremely bearish, which is likely to send EUR/CAD towards the bottom of the range as per the weekly chart.
As per the weekly, 2-day, and 4-hour charts, the downside target area is located between 1.5120 - 1.5130. This support is confirmed by 3 different Fibonacci retracement levels and corresponds to the bottom of two descending channels as well as several trendlines.
As per the hourly chart, the key resistance is at 1.5351, where previously 200 SMA was rejected along with the 78.6% Fibs. Break above this level will immediately invalidate the bearish scenario and the price can be expected to slowly reverse to the upside.
Support: 1.5130, 1.5120
Resistance: 1.5351, 1.5585