
Published: August 18th, 2020
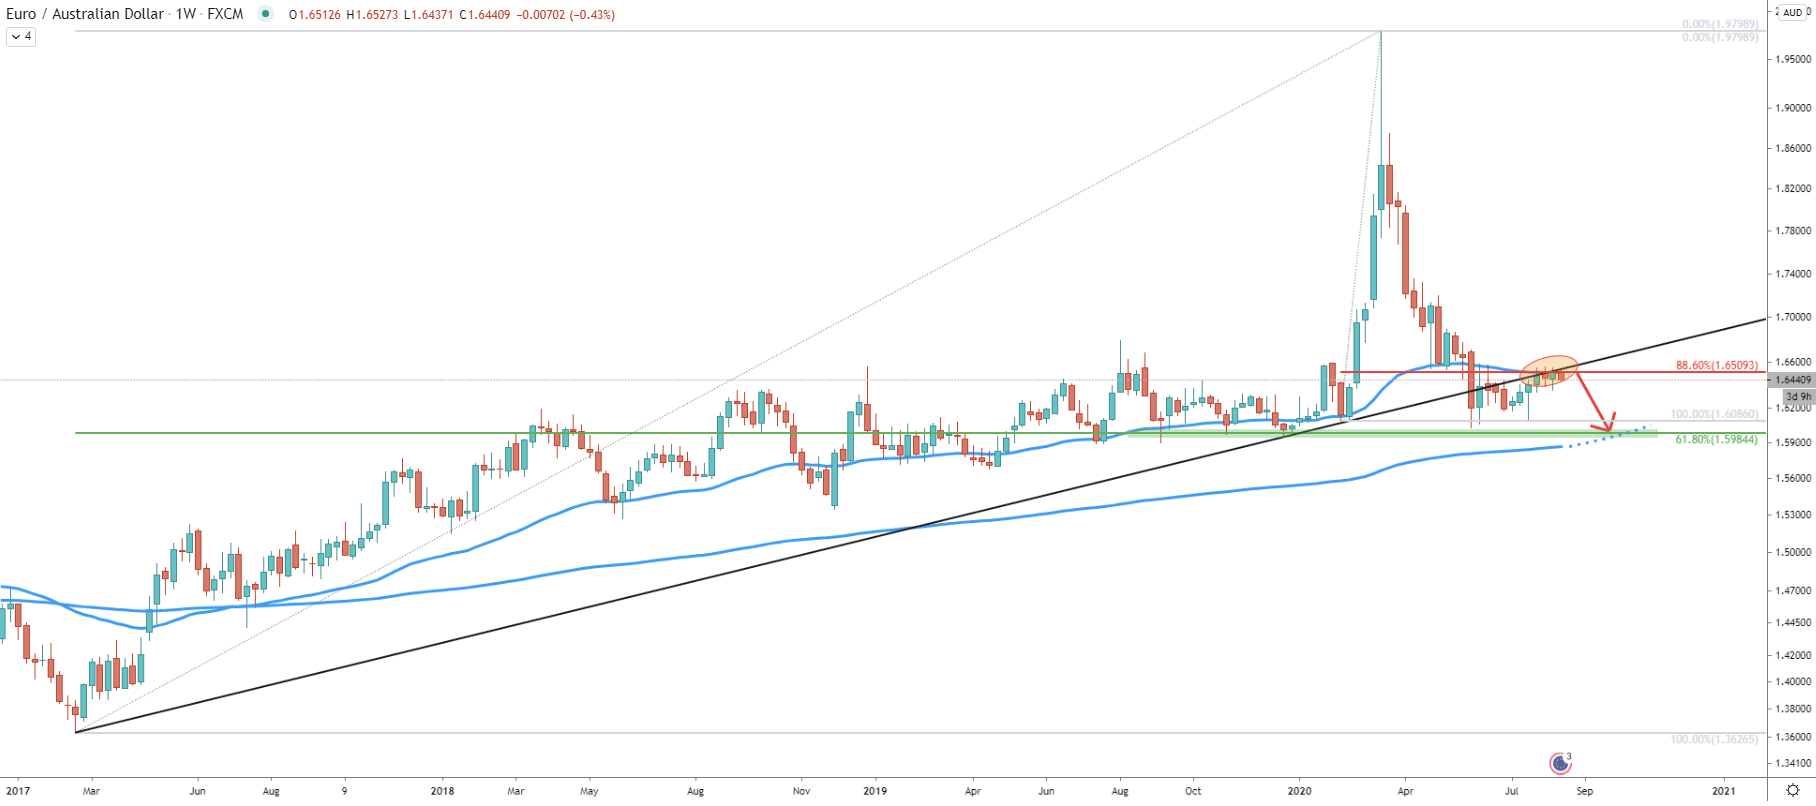
The EUR/AUD is still undergoing a massive correction after the rally in the beginning of the year. Pair already declined by over 3300 pips and this tendency is likely to continue. This is because price has broken below the lowest Fibonacci retracement level, which is 88.6% at 1.6509. This is also extremely close to the 1.6500 psychological level, which is currently acting as the resistance.
At the same time, the 50 Exponential Moving Average is being rejected, and as long as weekly close remains below 1.6586, which is the high produced on June 12, correction down will continue. Price can be expected to decline towards the 61.8% Fibs at 1.5984, which is the nearest Fibonacci support of the overall uptrend. The support corresponds to the extended 200 Exponential Moving Average, where 1.6000 psychological level could be playing a key role in the long term price development, when and if it will be reached.
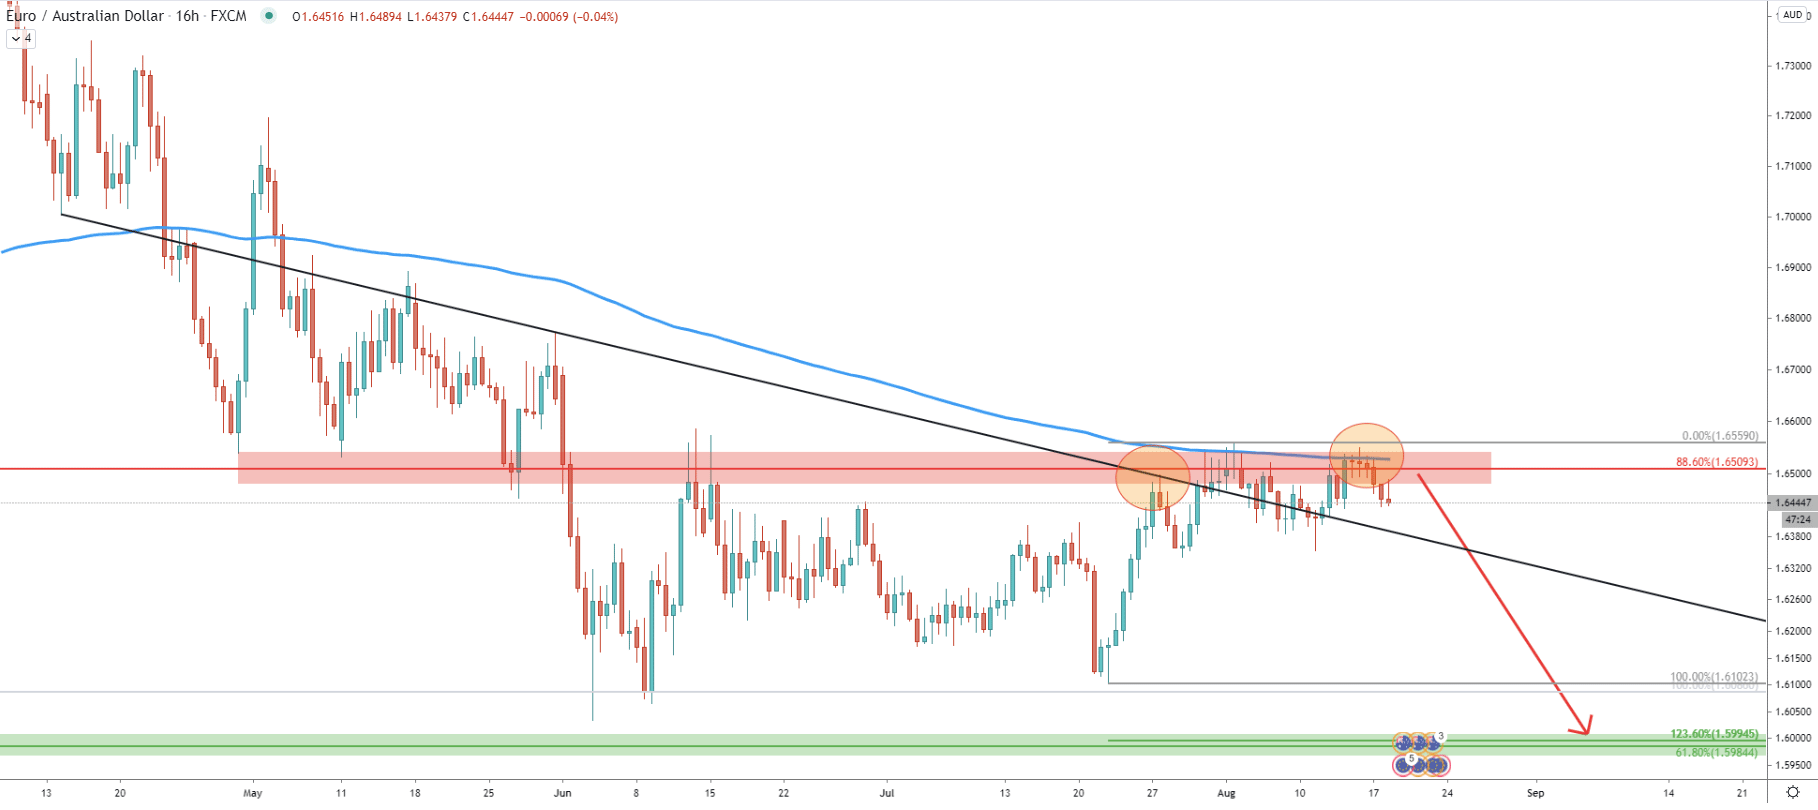
On the 16-hour chart, the price continues to reject the 200 EMA along with the average price downtrend trendline. This goes to show, that the downtrend remains valid. Besides, we can see the formation of the double top near 1.6560 area, and right now price is already starting to move lower. However, perhaps more confirmations would be the safest way to approach the EUR/AUD downtrend. Therefore, any small pullbacks towards the 1.6500 level could provide a much better risk to reward ratio for sellers.
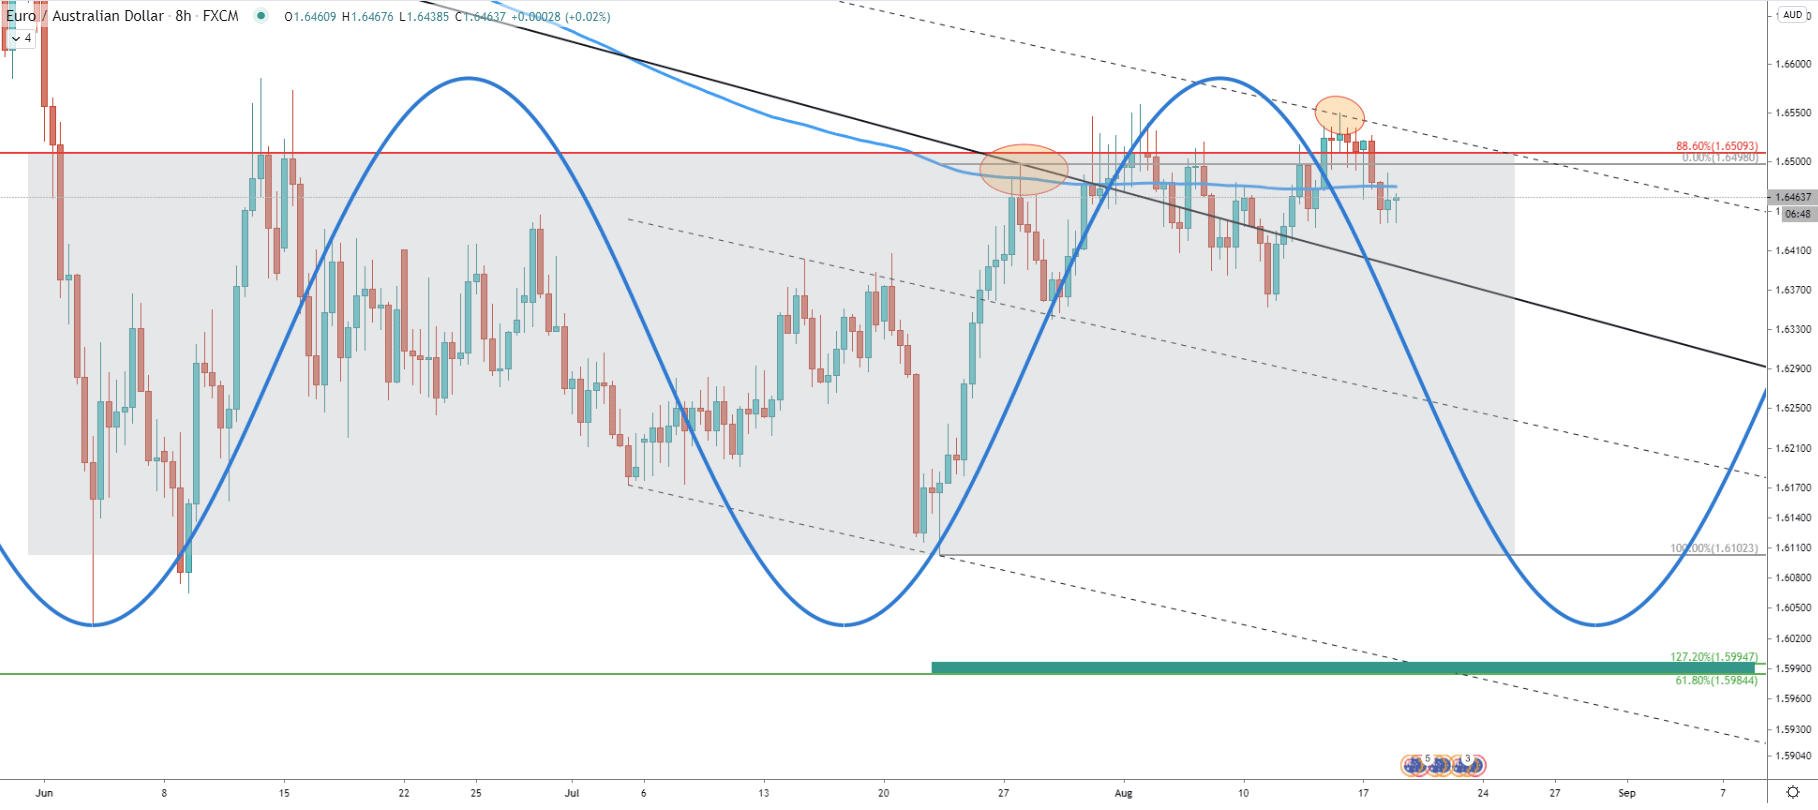
On the 8-hour chart, there is a clear consolidation going on. For the past few months, the price has been stuck between the 1.6500 resistance and 1.6100 support areas. Although this week EUR/AUD trading at the top of the range where it rejected the upper trendline of the extended descending channel.
Simple cycles show, that now it is the time for the bearish cycle, and considering the rejection of the top of the range along with the channel, the price could be starting to move south any moment. Today there was a break and close below the 200 EMA, which is another confirmation of the selling pressure. But at the same time consolidation can be extended further, and in the worst-case scenario of a downtrend, EUR/AUD will re-test the 1.6580 resistance area before the downtrend continuation.
We have also applied another Fibonacci retracement level to the corrective wave up where the average price trendline was rejected. The 127.2% Fibs almost exactly corresponds to the previously mentioned downside target at 1.5984.
The descending channel has been broken and EUR/AUD found the resistance at the lower trendline of the channel. The resistance has been rejected consistently throughout the past 4 trading days, after which rice went down and broke below the 50EMA. Sellers are clearly defending the 1.6500 resistance and considering that 200 EMA was already broken on two occasions, the probability of the downtrend is increasing every day.
On lower timeframes, there are no clear indications of the trend, and EUR/AUD continues to move sideways. While speculators could be cautious about trading EUR/AUD, long term investors could be starting to buy the Australian Dollar and sell the Euro.
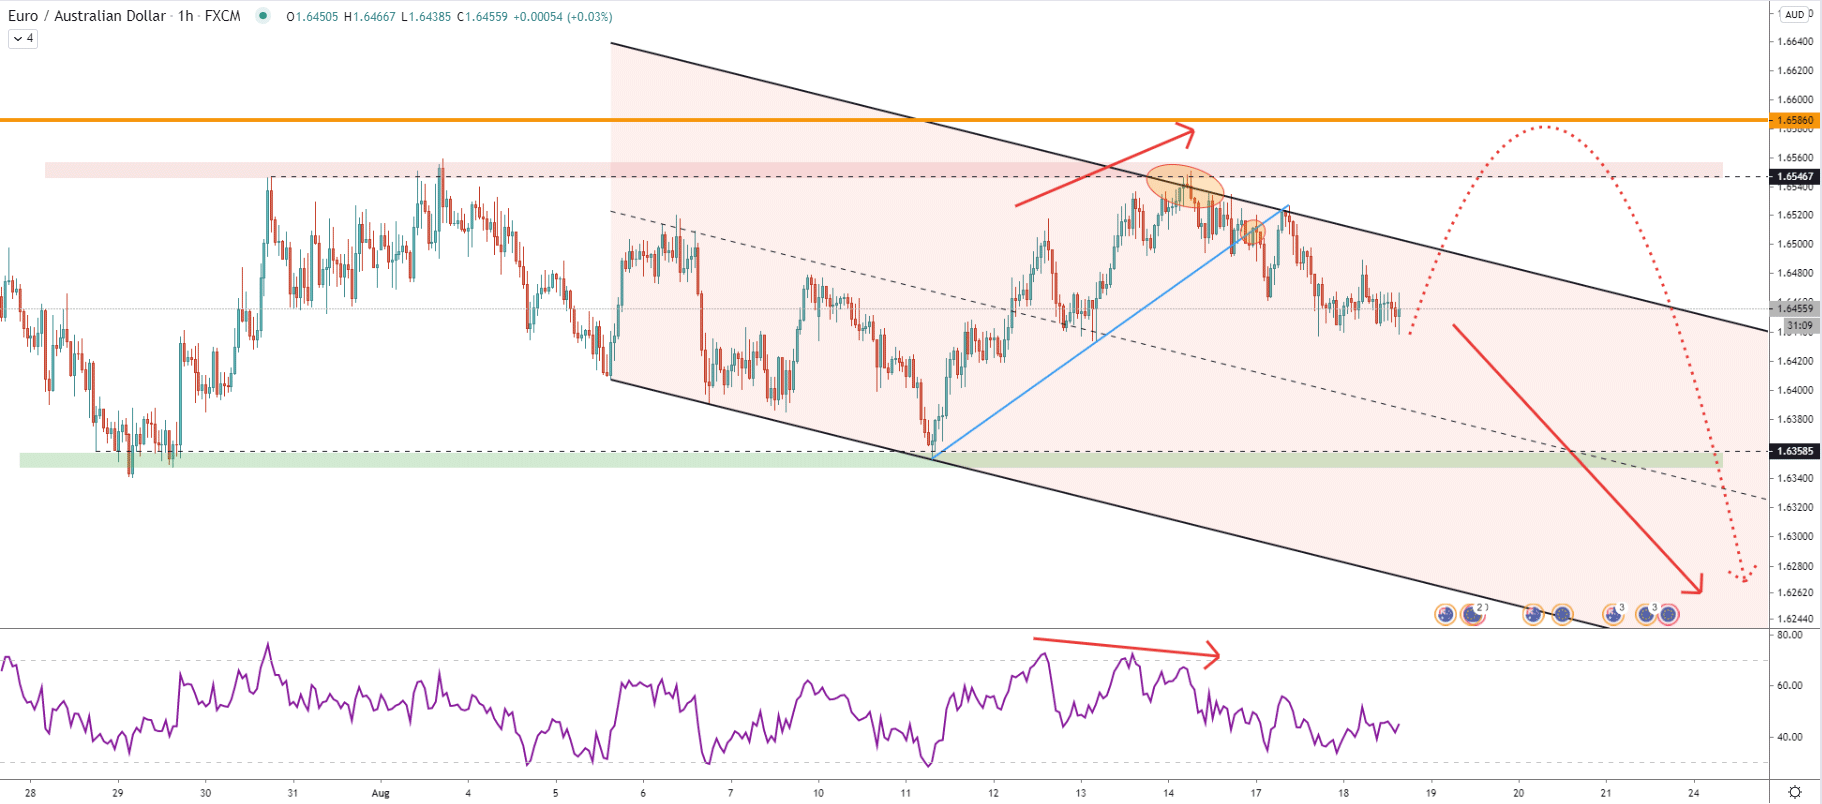
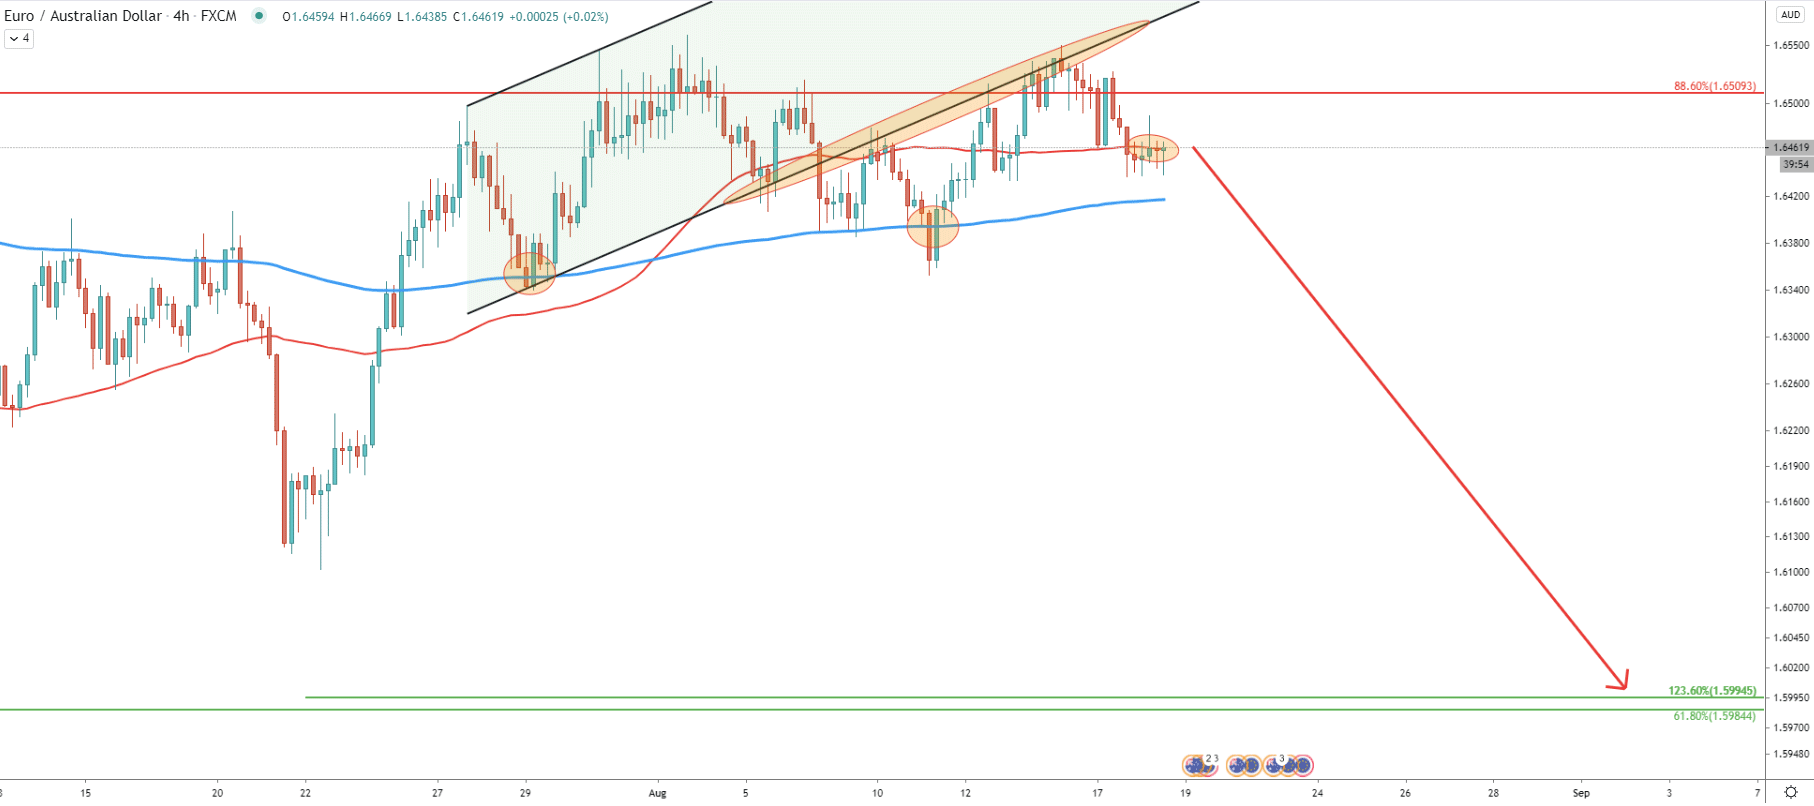
Price clearly rejected the upper trendline of yet another upper trendline of the extended descending channel. On the top, the RSI oscillator formed a bearish divergence and price went down. It broke below the uptrend trendline, corrected up, and rejected the trendline. We can see lower lows and lower highs are starting to appear, which might increase selling pressure during this week.
But as has been already mentioned, the price can move up above the 1.6546 in order to hunt stop losses. Therefore, the safest approach for sellers could be to wait until pair breaks below the currently produced double bottom at 1.6438
On the long timeframe charts, the EUR/AUD correctional phase is still ongoing. This can result in another 550 pip price decline in the coming week or months. Although on the low timeframe charts price continues to consolidate while traders will continue to hunt for the best possible selling and maybe even buying opportunity.
As per the Weekly and 8-hour charts, there is a strong phycological and technical support located at 1.6000. It is confirmed by 61.8% and 127.2% Fibonacci retracement levels as well as the previous demand area. This means there is still a huge downside potential of approximately 550 pips.
The key resistance is located at 1.6586, which is the high produced on June 12. Only daily break and close above this price will invalidate bearish outlook and EUR/AUD long term uptrend can resume.
Support: 1.6438, 1.6358, 1.6000
Resistance: 1.6500, 1.6546, 1.6586