
Published: June 23rd, 2020
Yet again we are getting back to the topic of a potential strength of the Australian Dollar. There were at least 3 analyzes on different AUD pairs during the past couple of weeks. They all suggested that AUD will be outperforming other fiat currencies. This time we’ll analyze the Euro versus the Australian Dollar and its exchange rate perspective in the long run.
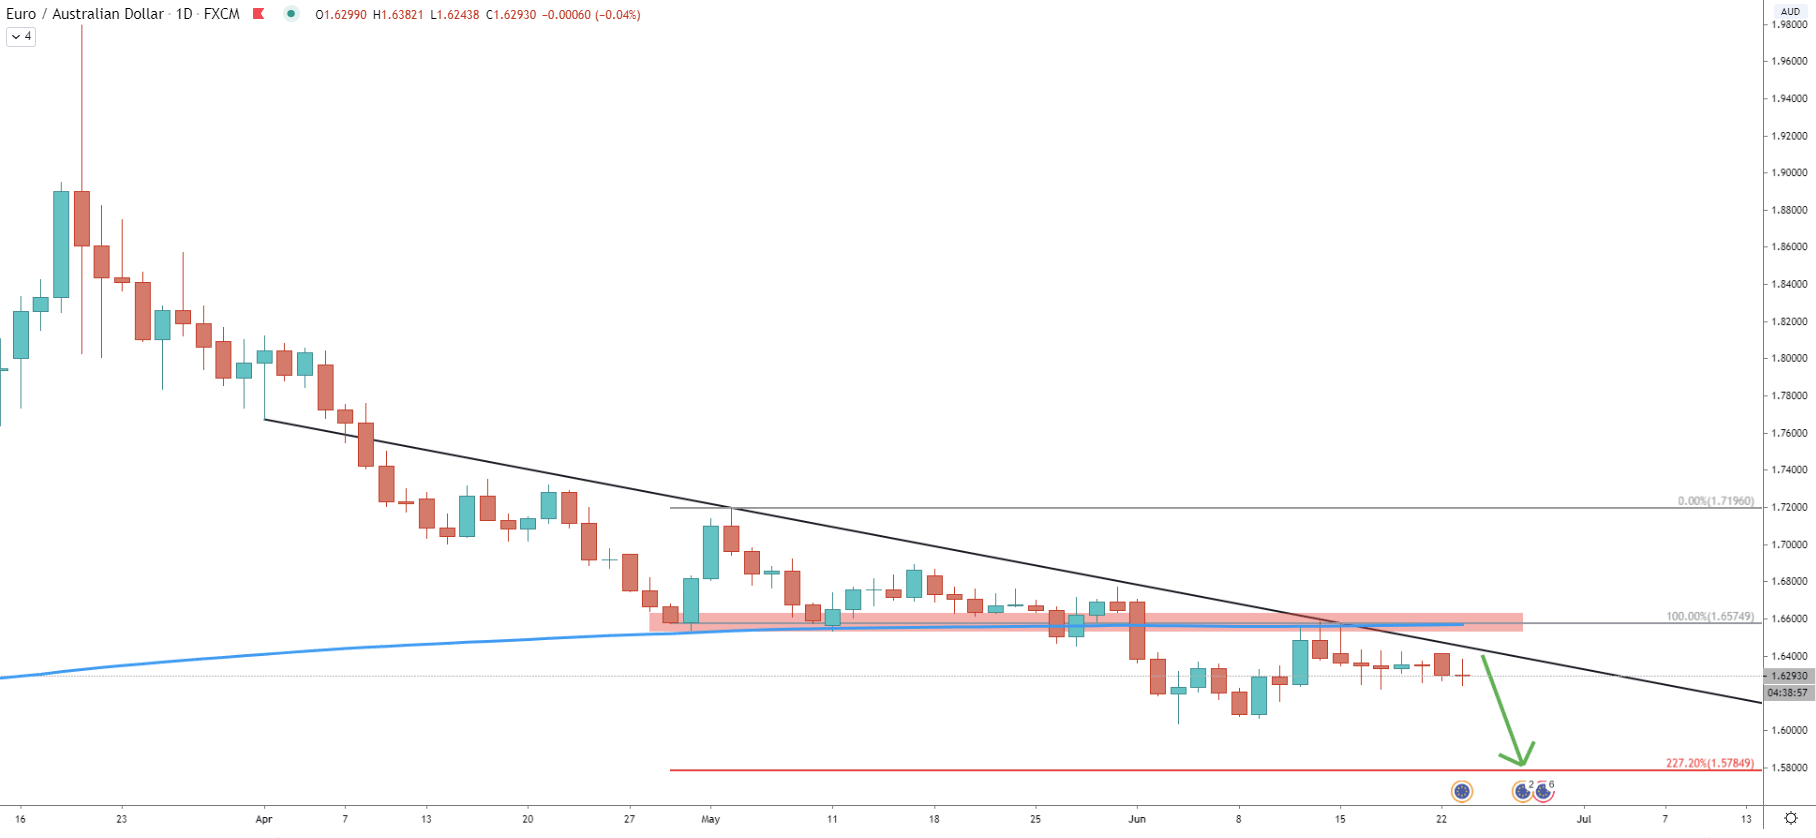
On the Daily chart, the long term downtrend becomes very obvious. Since March 19, EUR/AUD has been steadily declining, and during the period of 54 trading days, the price dropped by nearly 20%, 19.02% to be precise. EUR/AUD went from 1.9799 high, down to the 1.6033 low, established on June 3. Overall, the EUR lost 3,765 pips during this downtrend, and it seems that there is more room for decline.
On this chart, we have applied an average price downtrend trendline, which shows that the last point of rejection occurred on June 12, when the price tested 1.6586 high. At the same time, the 200 Exponential Moving Average was rejected. There is an extremely strong resistance area formed near 1.6600, which previously was key support, and obviously it became the resistance, rejected by the EUR/AUD. There is a high probability that after this rejection the long term downtrend will continue and price can drop by more than 500 pips. Because the support is seen near 1.5800 psychological price area, specifically at 1.5781. This support is confirmed by 227.2% Fibonacci retracement level applied to the point of the first bounce off the trendline. Let’s move on and see why this support is so important.
On June 12, EUR/AUD cleanly rejected the downtrend trendline, while the price remained below the 200 Exponential Moving Average. This confirms the validity of the downtrend and price might be about to initiate the next downside impulse. Today there was a rejection of the 50 EMA, and clearly, after rejecting the downtrend trendline EUR/AUD started to produce lower lows and lower highs.
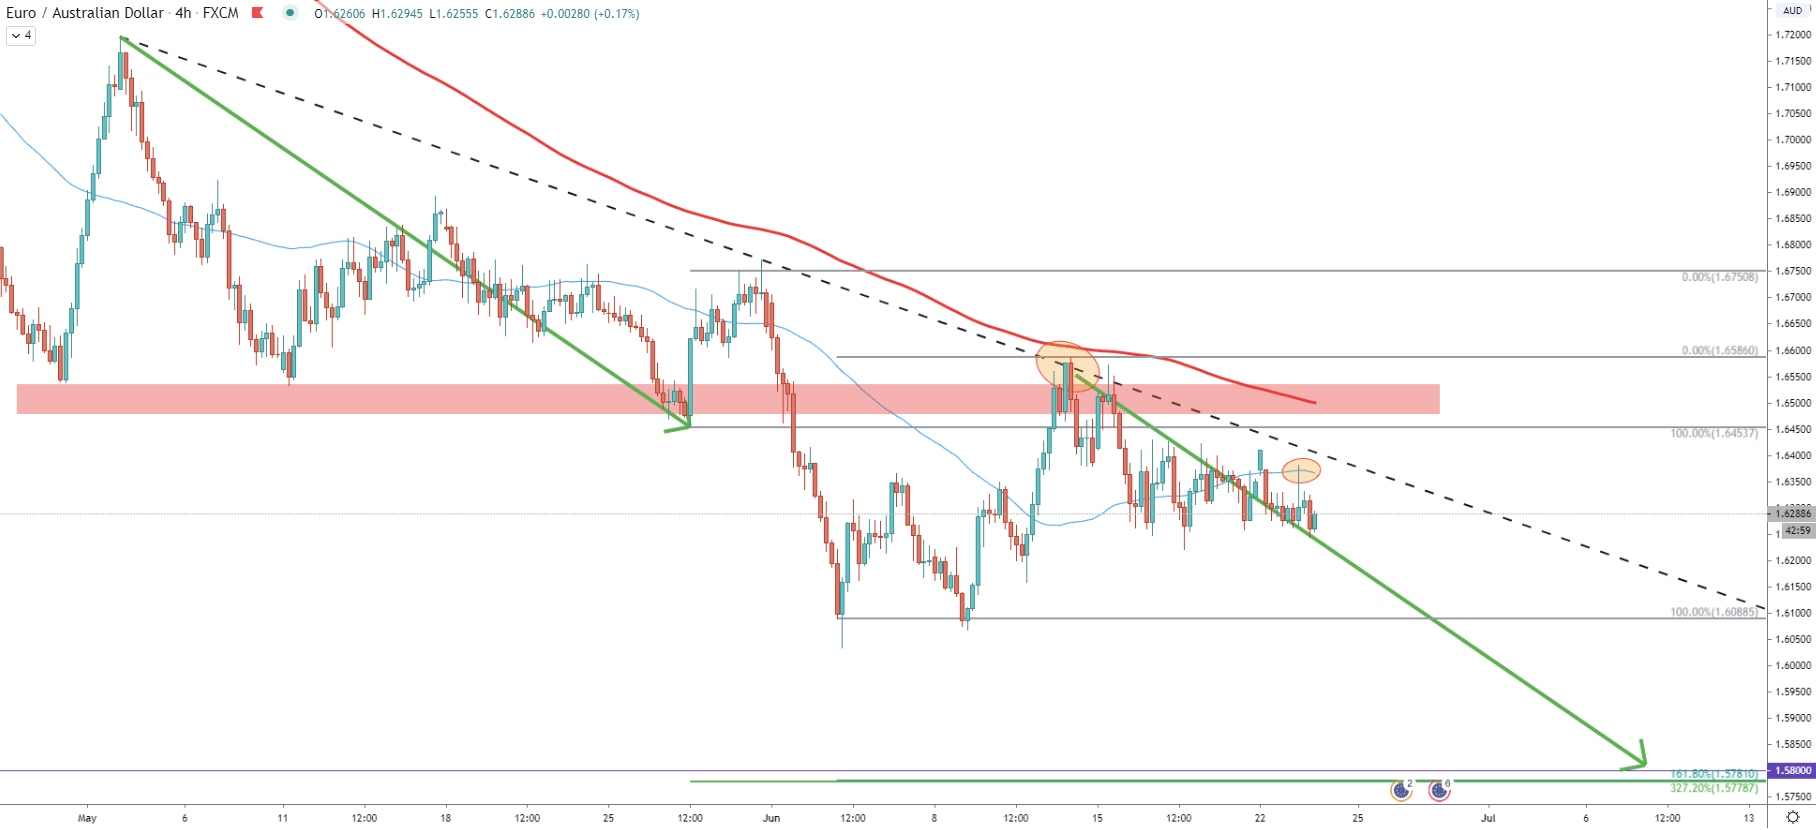
If we compare the previous wave down, where price reached the 1.6500 support area, the ongoing wave down, could be just the same size. In this case, 1.5800 psychological support, could be a perfect profit-taking point for the bears. On the 4-hour chart, the downside target is also confirmed by 161.8% Fibs applied to the corrective wave up where the trendline was rejected. It goes perfectly in line with the 327.2% Fibs, applied to the corrective wave up when price bounced off the 1.6500 support area. And finally, both of these Fibs correspond to 227.2% retracement level as per the Daily chart. This makes 1.5800 price area extremely strong support and a potential demand zone if reached.
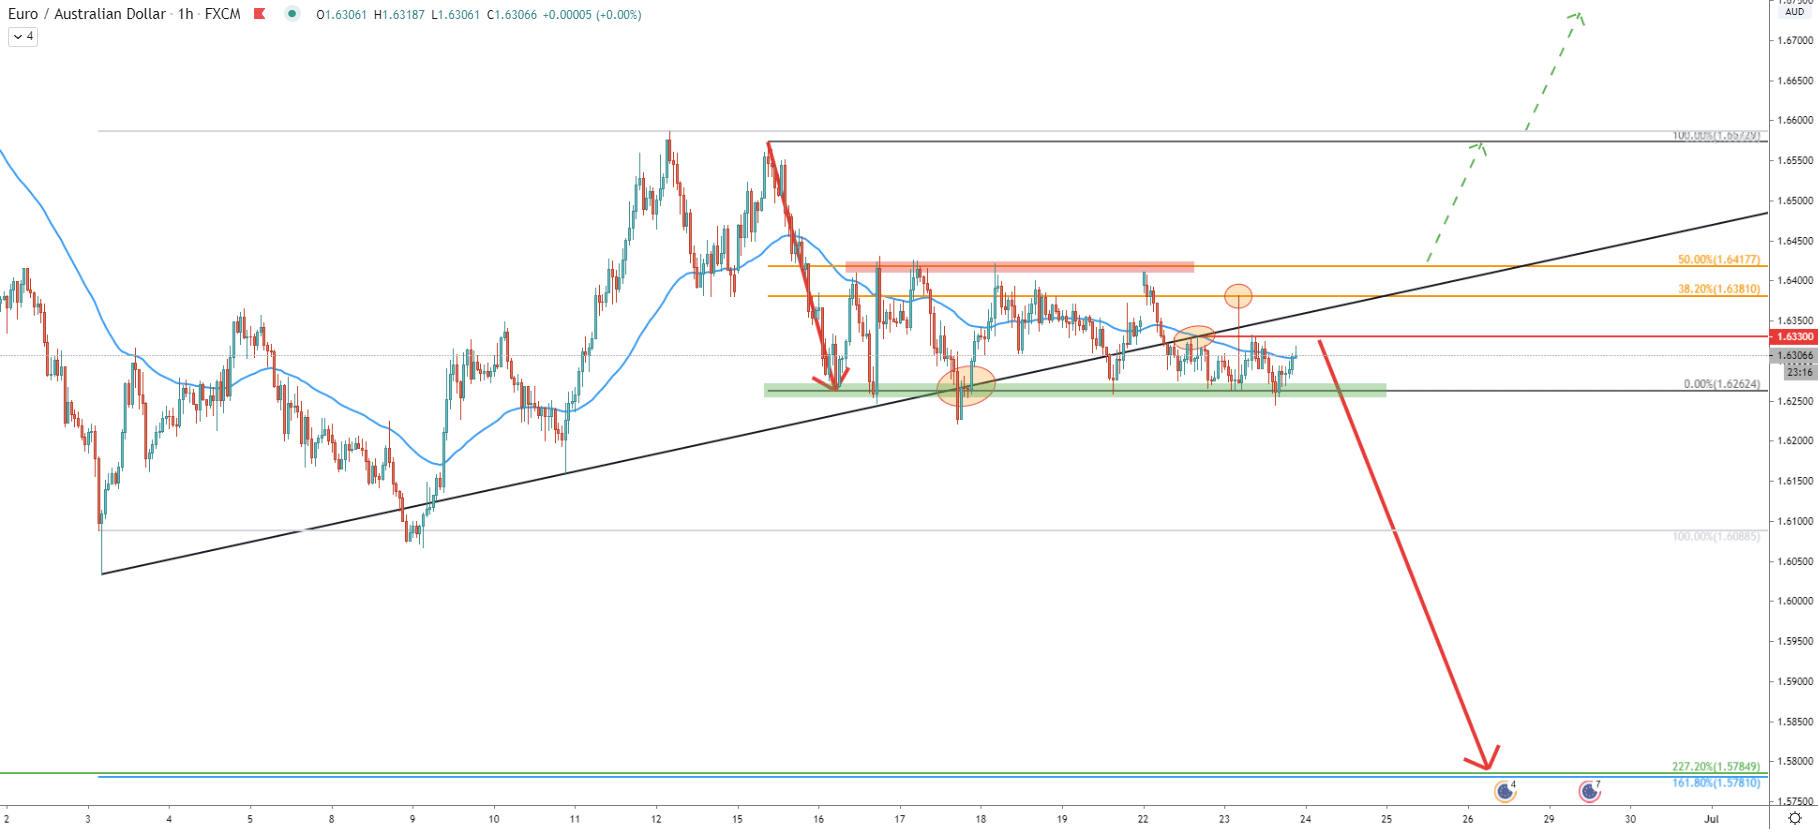
On the hourly chart, price broke below the uptrend trendline, after which consolidation has started. EUR/AUD has been ranging between the 1.6417 resistance and 1.6262 support, making it a 200 pip wide range-trading. During the past 48 hours, the price rejected cleanly 38.2% Fibs applied to the first wave down. We can also see that the uptrend trendline is now acting as the resistance along with the point of rejection of the 50 EMA at 1.6330.
Therefore, as long as the price remains below 1.6381 - 1.6417 resistance area, a strong downtrend must be expected. Considering the length of consolidation, which took over 7 days, EUR/AUD can start falling at any time, even starting from today.
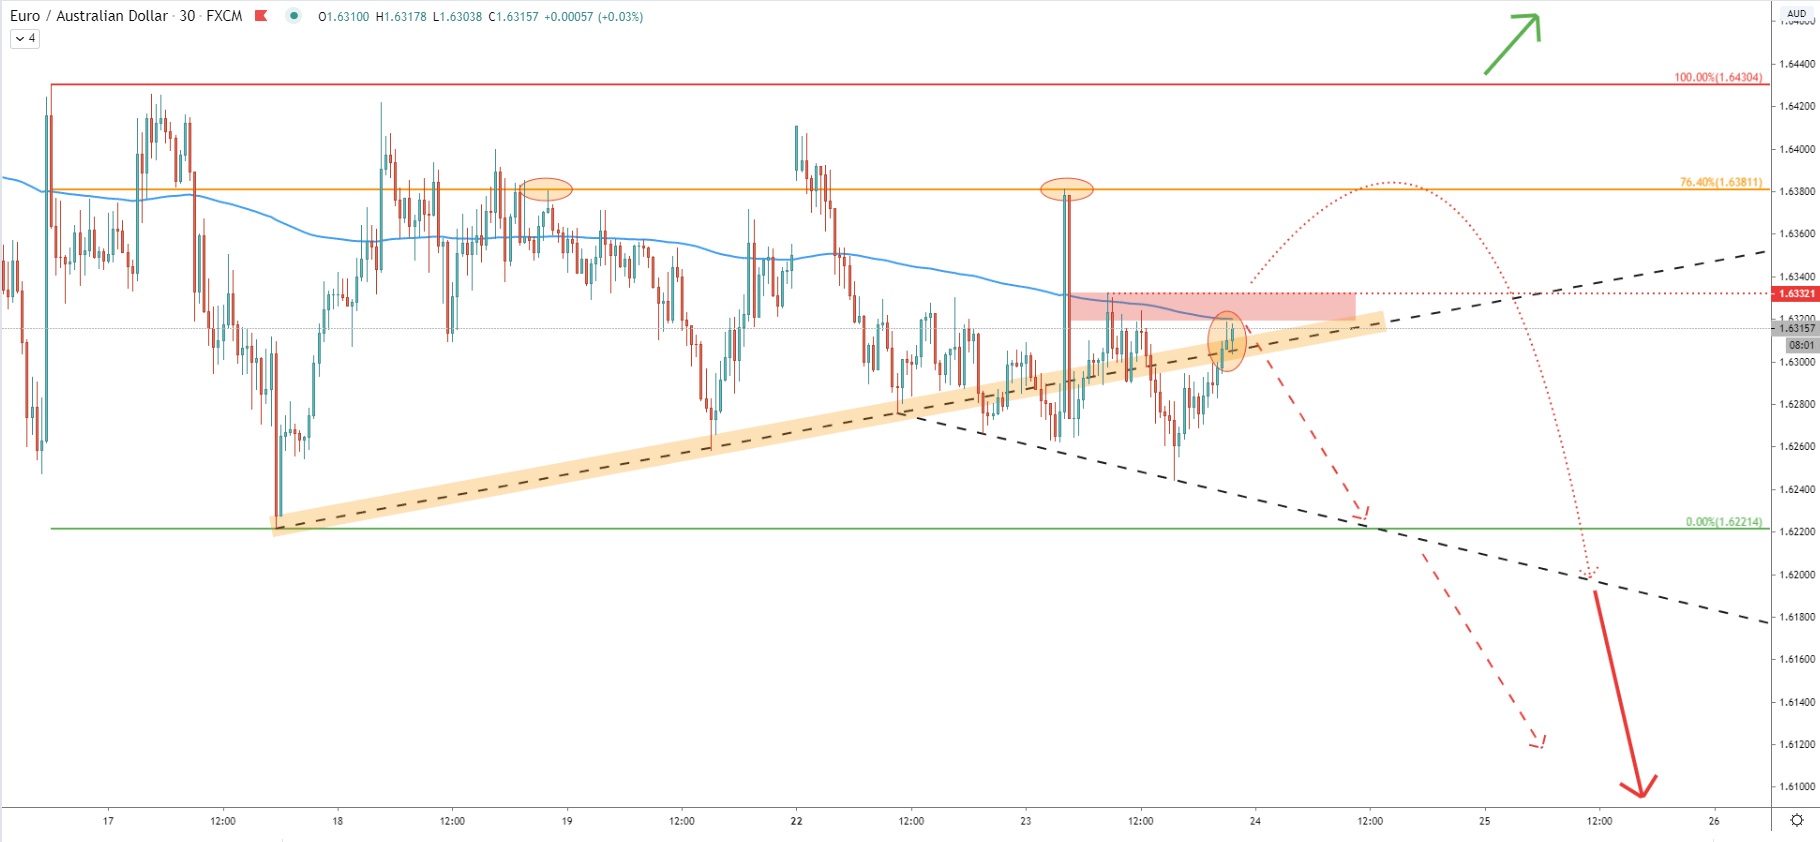
On the 30-minute chart, there is yet another uptrend trendline which also got penetrated. After the breakout price went up sharply and rejected the 76.4% Fibonacci retracement level at 1.6381. It was a very clean bounce, yet again confirming strong bearish domination. Currently, the price is rejecting the uptrend trendline along with the 50 EMA. It seems that 1.6320 is a key resistance area, which remains extremely attractive for sellers. However, it can remain attractive only as long as the price remains below 1.6332. Because if EUR/AUD will go higher, the consolidation phase could be extended further and the price is likely to re-test 1.6381 resistance area.
EUR/AUD has been consolidating for over a week, which suggests that another impulsive move is just around the corner. Based on our analyses, the price has a higher probability of moving down rather than reversing the trend to the upside. The potential for the downtrend is approximately 500 pips.
As per multiple Fibonacci retracement levels, the downside target is located near 1.5800, with the expectation of the move even lower, to test 1.5781. If there will be a daily break and close below 1.5781, perhaps sellers will continue to dominate for a longer period of time.
As per the 1-hour chart, the uptrend probability will become high only upon price moving above 1.6417. In this case, EUR/AUD can rise towards the 1.6585 resistance area, and even higher.
Support: 1.6262, 1.6088, 1.5800
Resistance: 1.6330, 1.6381, 1.6417