Published: May 26th, 2021
Unlike Bitcoin, Ethereum is more than a store of value. Thousands of decentralized applications hosted by the Ethereum network that keep it at the core attraction to investors.
Ethereum passed 2020 with a massive user adoption while institutional capital and maturity of DeFi projects pushed the price at a record high. Still, many crypto enthusiasts believe that Etheruem is the future and has more versatility than BTC blockchain.
As a result, Ether became the center of the decentralized economy. According to the latest report, almost 7 million new accounts with funds were created in the first four months of 2021. The Ethereum network faced a congestion problem due to the enormous numbers of transactions through the network. But, ETH developers enacted multiple upgrades and increased the scalability of the network to the maximum level. Besides, Non-fungible tokens are another strength of the Ethereum investors where artists write into a smart contract and sell it through the NFT.
Despite all of these indications, Ethereum crashed below the $2,400 level with an impulsive bullish pressure. Can buyers’ take the price higher? Let’s see the upcoming price direction from the Ethereum technical analysis:

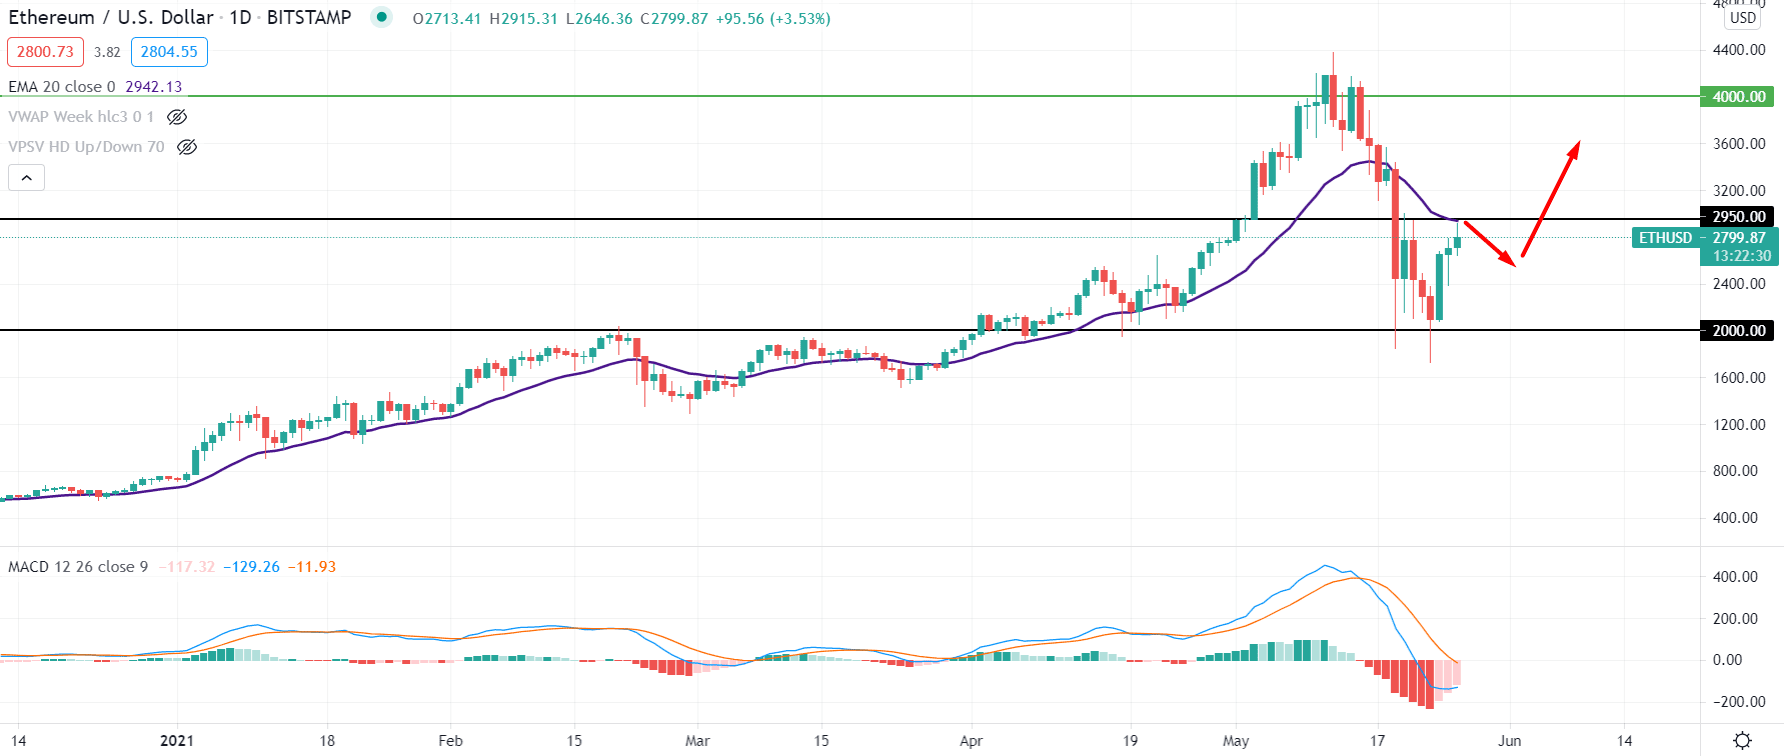
Ethereum started 2021 with a bullish sentiment that allowed the crypto asset to test the all-time high at the $4390.47 level before crashing down towards the $1730.04 level. However, bears failed to hold the price below the psychological $2,000 support level with a daily close. Therefore, as long as the static $2,000 level supports the price, the upcoming price action would be bullish for Ether.
In the above image, we can see the daily chart of ETH/USD where the price rejected the $2000 level multiple times and had a strong bullish daily close, covering all sellers’ attempts. However, the price reached the near-term resistance at $2950 and facing resistance from the dynamic 20 EMA.
As the price rejected the $2000 level with an impulsive bullish daily close, any further D1 close above the $2950 level may resume the long-term bullish trend of the price. On the other hand, any bullish rejection from the $2950 level may start a correction to the price before setting further price direction.

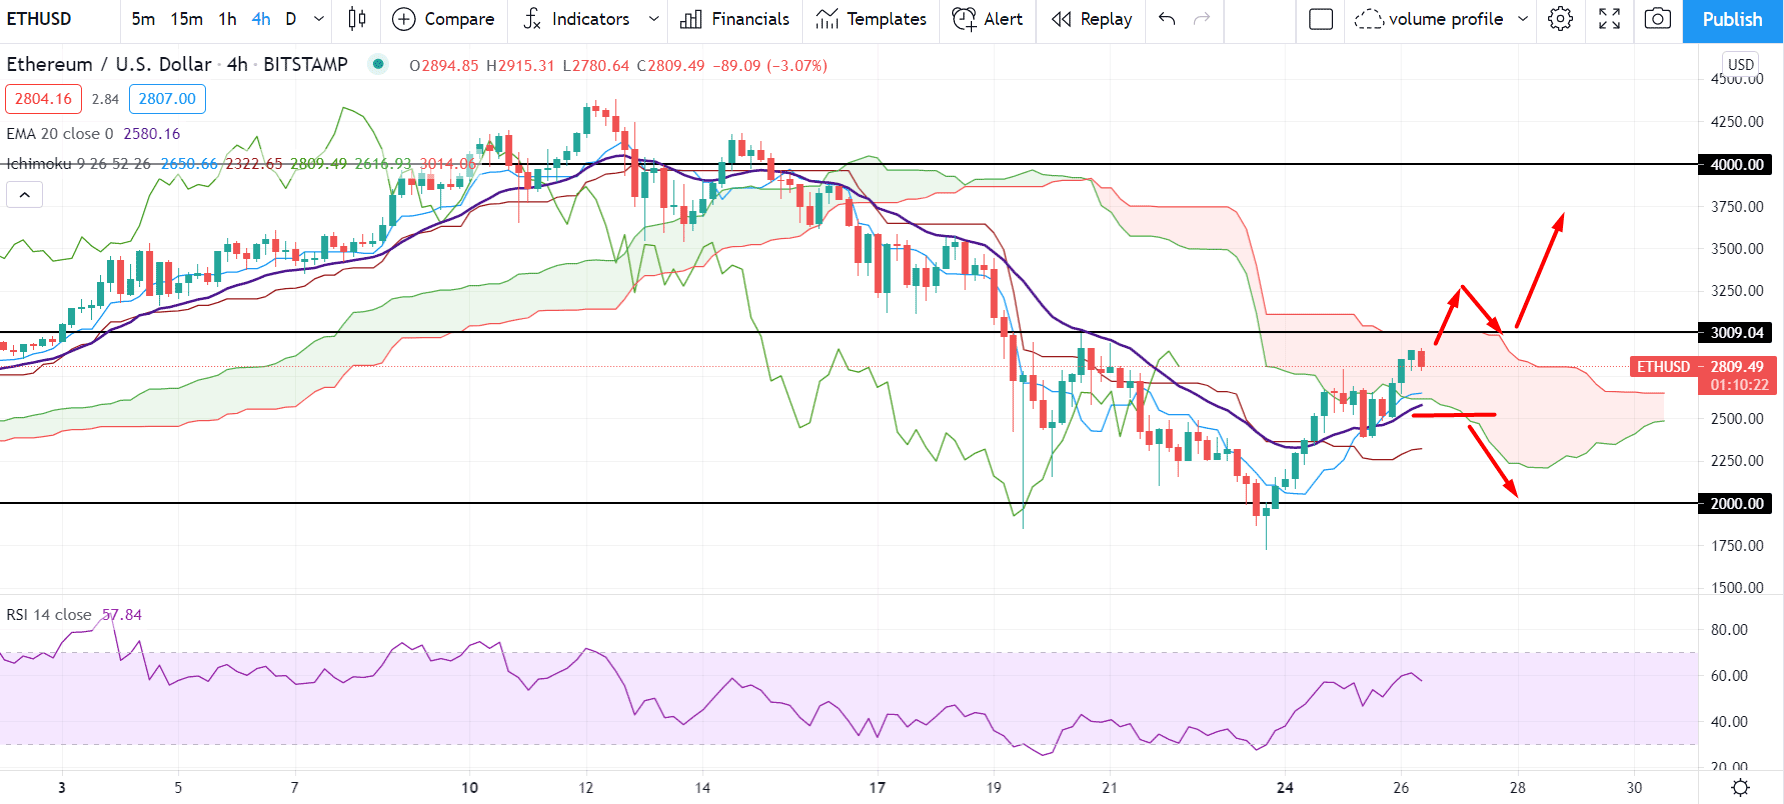
If we plot the Ichimoku Cloud to the ETH/USD H4 chart, we would see that the price is trading within the Kumo Cloud, indicating no specific direction. In this market condition, traders should wait for a decisive breakout before taking any trading decision.
In the above image, we can see the H4 chart of ETH/USD where the price is trading above the dynamic Tenkan Sen and Kijun Sen. Moreover, in the future cloud, Senkou Span A is below the Senkou Span B but pointing up, which is a sign of buyers’ presence to the price. Besides, Chikou Span is above the price, and RSI is above the 60 levels.
In this price condition, if the price breaks above the $3,009.04, Cloud resistance, it has a higher possibility to continue the bullish pressure towards the $4,000 level. On the other hand, any bearish H4 close below the dynamic Kijun Sen may resume the most recent bearish trend where the primary target is towards the $2,000 level.

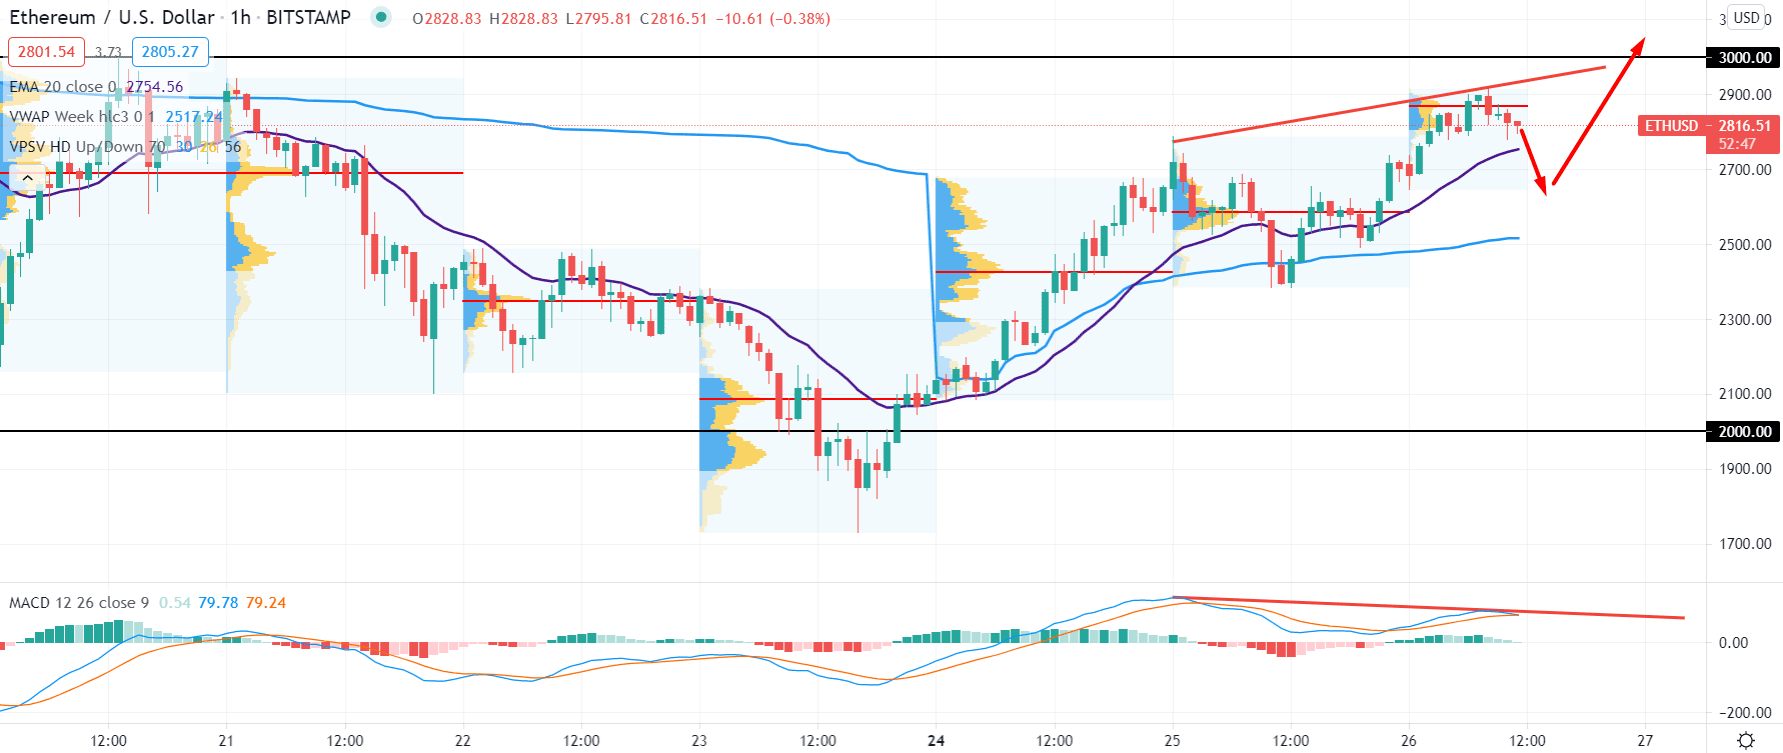
In the Ethereum intraday chart, buyers managed to create 4 consecutive highs of intraday high-volume level. Moreover, the price moved above the dynamic 20 EMA and weekly vwap level. Currently, the dynamic 20 EMA is just below the price and pointing an upward pressure.
Based on the price action in the H1 chart, the price is currently trading below the intraday high volume level of $2869.22 level. As the price failed to move above the important $2869.22 level, followed by a potential regular divergence with the MACD, the price has a higher possibility to correct lower towards the vwap area at the $2522.21 level.
On the other hand, any strong bullish breakthrough above the $3000 psychological resistance level may alter the current bearish scenario and resume the long-term bullish trend with the target of $4000 level.
As of the above discussion, we can say that Ethereum has multiple bearish rejections at the $2000 level, despite the current regular divergence in the H1 chart. Therefore, investors should wait for a stable price above $3009.04 Cloud resistance to consider the bullish trend as strong.
Conversely, any strong bearish H1 close below the dynamic 20 EMA may increase the bearish possibility to the price where the primary target would be the $2000 level.
Lastly, investors should keep an open eye on Ethereum’s industrial demand, where any sign of development in the DeFi sector may create strong bullish pressure on the price.