
Published: October 13th, 2020
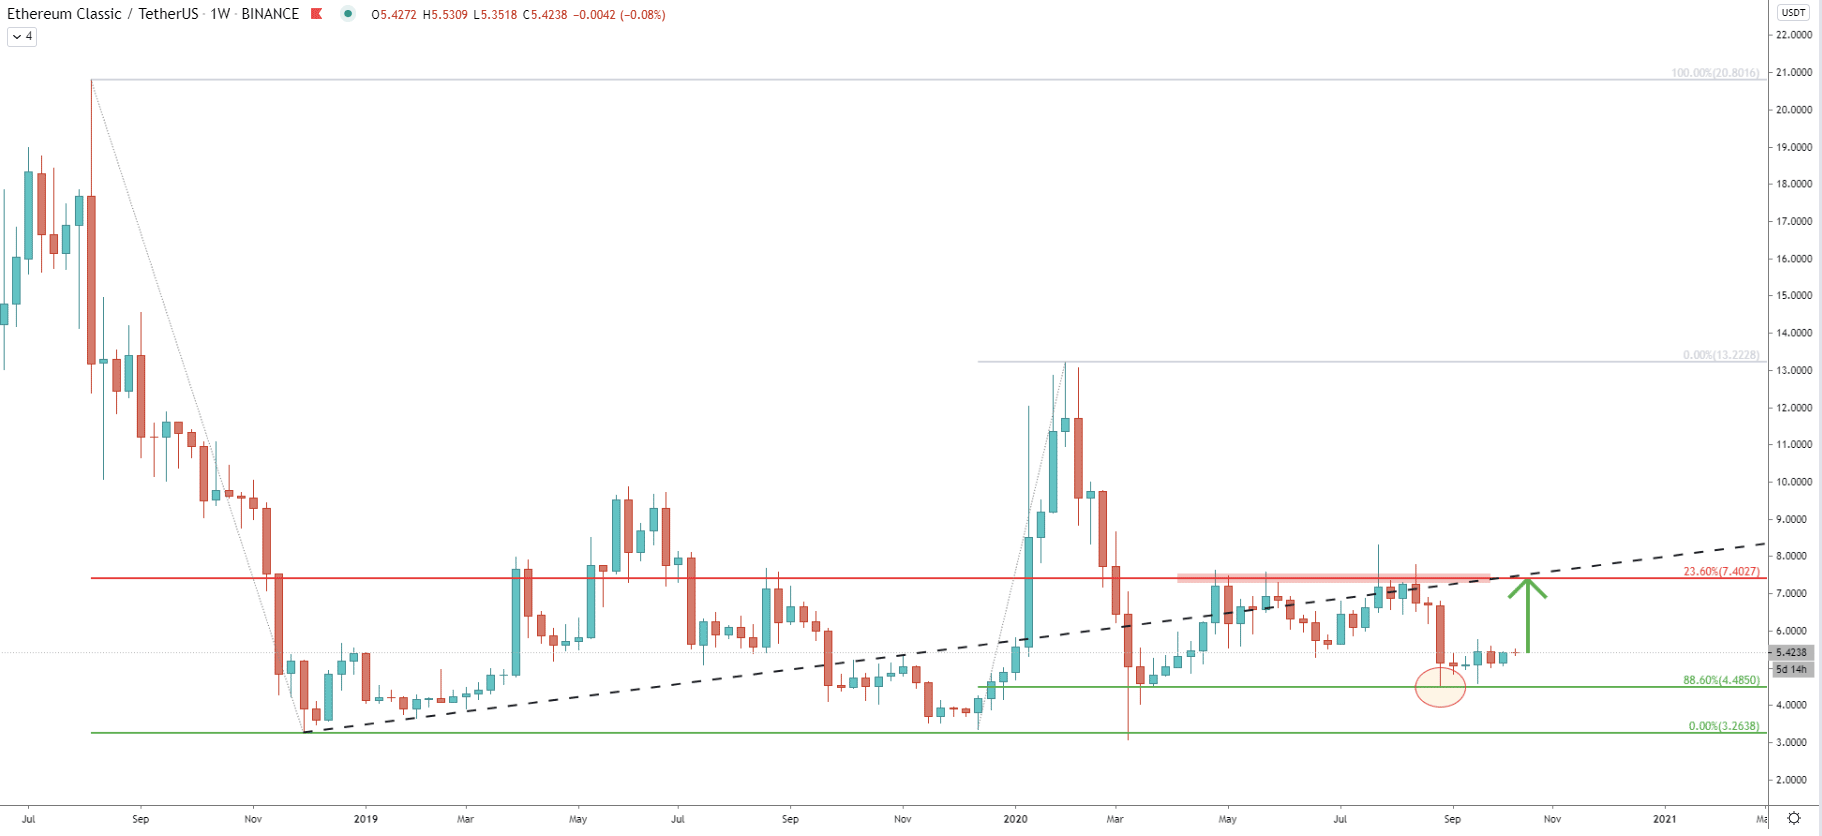
As can be seen on the weekly chart, the Ethereum has formed major support at 3.26, which has been rejected several times during the past few years. But looking at the price action since this year, it can be seen that the ETC is stuck between the 4.48 support and 7.40 resistance level. The support is confirmed by 88.6% Fibs while the resistance is confirmed by 23.6% Fibs applied to the overall downtrend that occurred back in 2018.
The support has been rejected cleanly just 6 weeks ago, although afterward consolidation has started. During the past 1.5 months ETH/USDT has been trading around $5 mark but now it seems that this consolidation could have come to an end based on the following analysis of lower timeframes. For now, price is expected to start moving north, to re-test the key resistance at 7.4, which also corresponds to the average-price uptrend trendline.
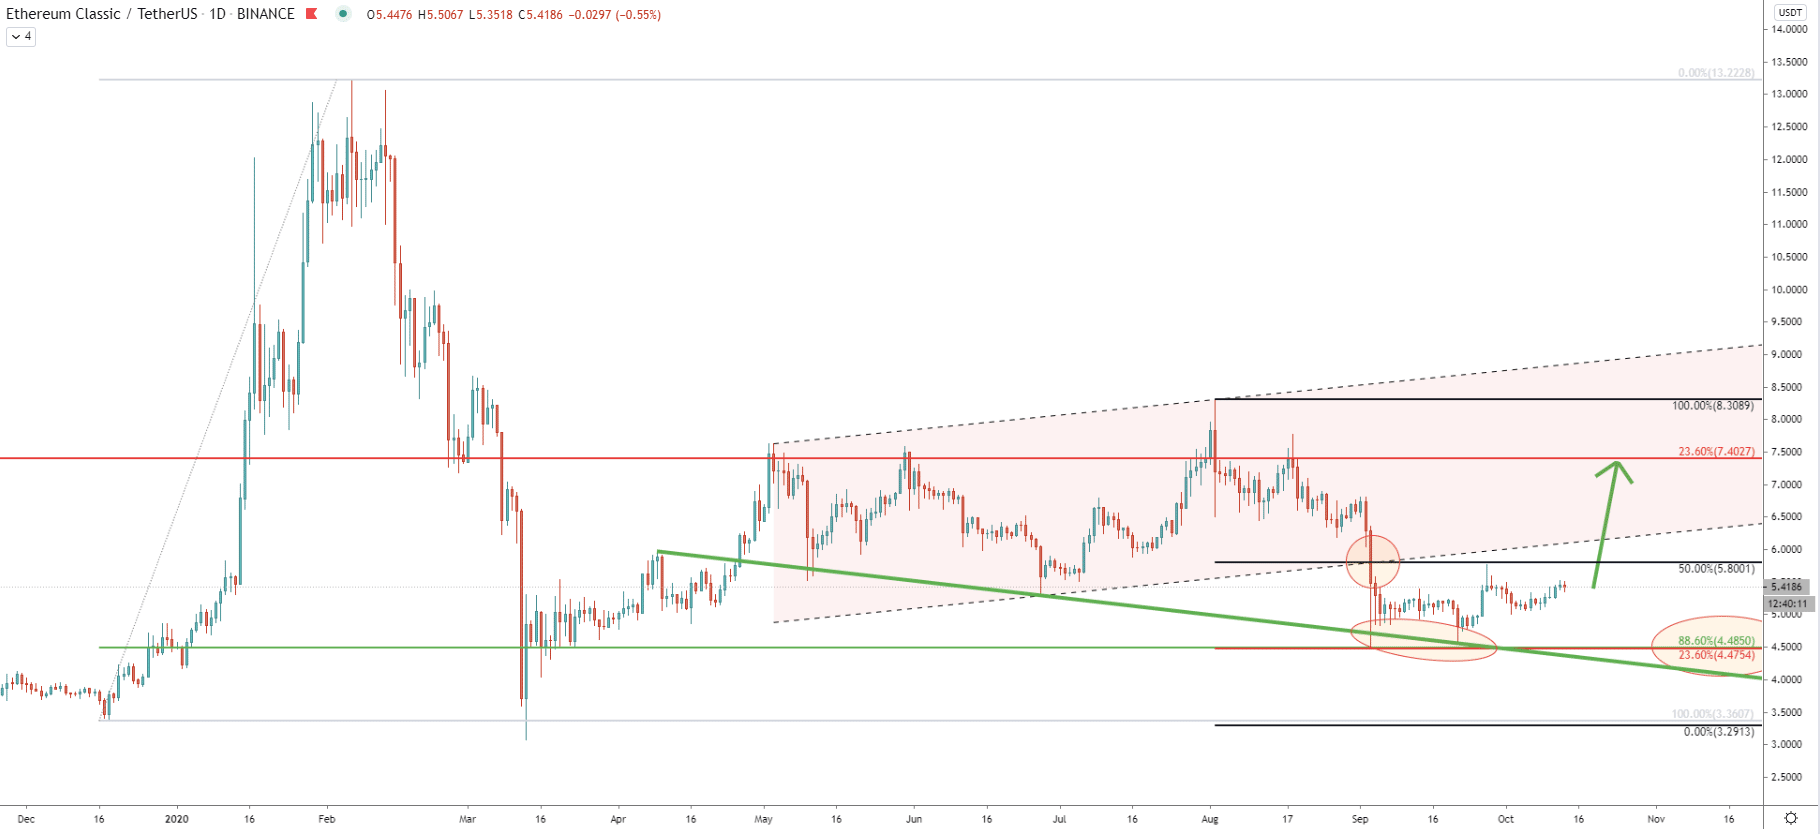
Since May 2020 price has been moving within the ascending channel, but then in September, it broke to the downside. Fibonacci was applied so that 50% is placed at the breakout point and it shows that 23.6% Fibs exactly corresponds to the previously shown support at 4.48. Along with the rejection of the Fibonacci levels, ETC rejected cleanly the support downtrend trendline and then produced a higher high. This goes to show the importance of the 4.48 and how strongly bulls were defending it. Therefore, as long as daily closing prices remain above this support, Ethereum Classis will most definitely continue rising towards the 7.4 resistance.
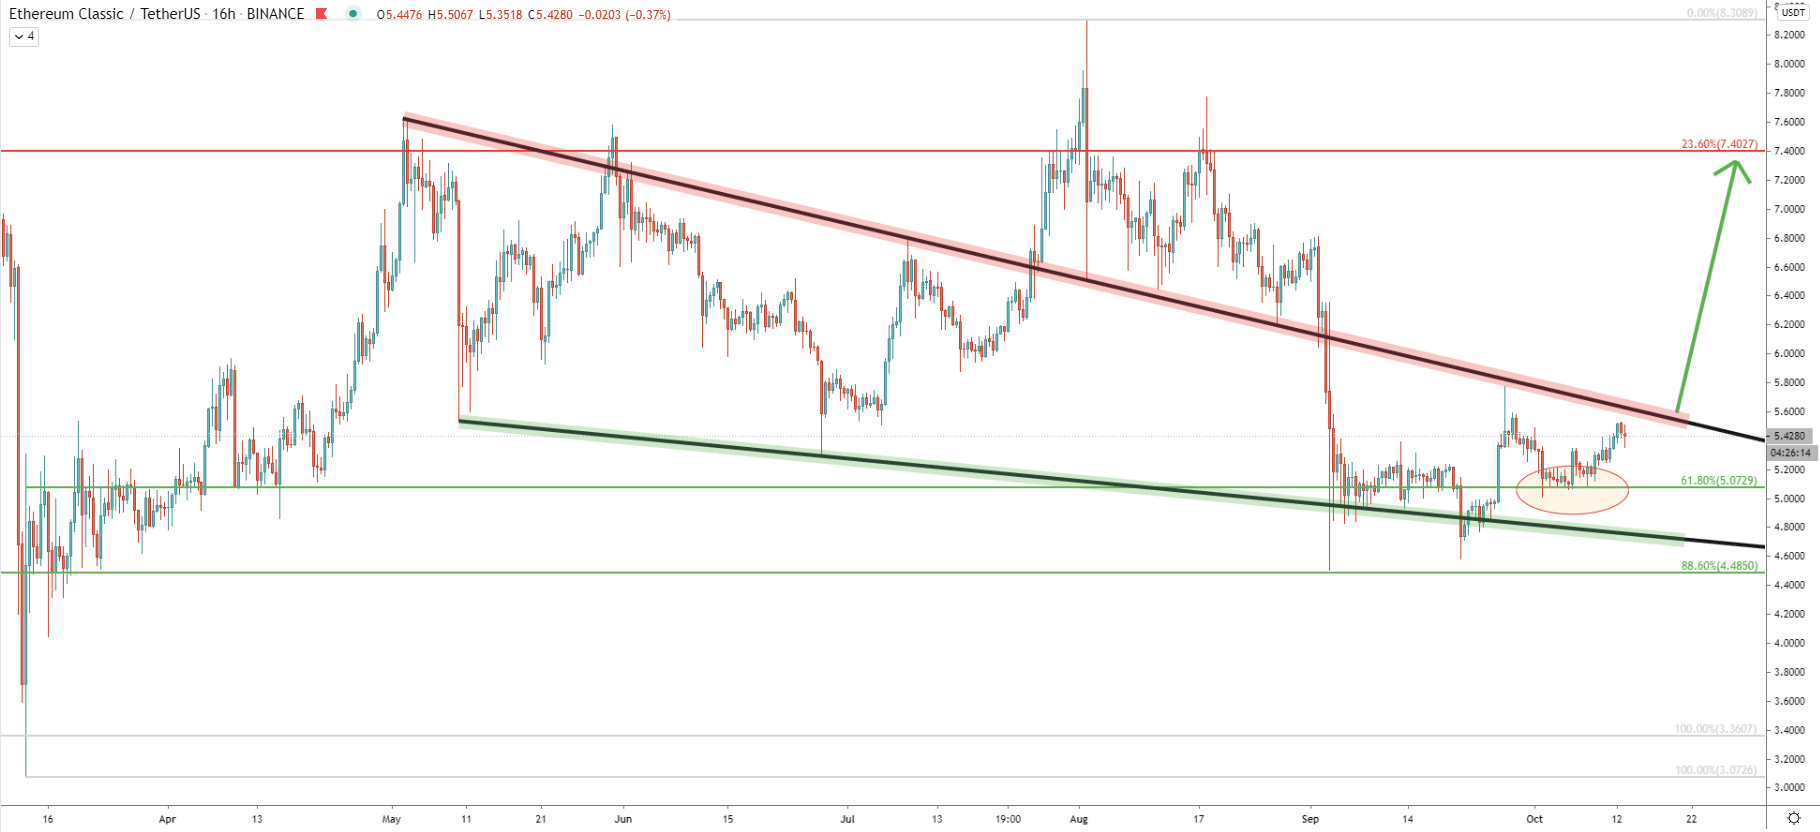
It is clearly visible that the price has rejected the 88.6% Fibs along with the support downtrend trendline. The most recent price action shows a continuous rejection of the 61.8% Fibs as well, at 5.07. Right now ETC/USDT seems to be stuck between this support and the average price downtrend trendline resistance. It is highly likely that the buying volume will start increasing substantially upon the break and close above the resistance trendline. Then, a fast and exponential move to the upside might follow.
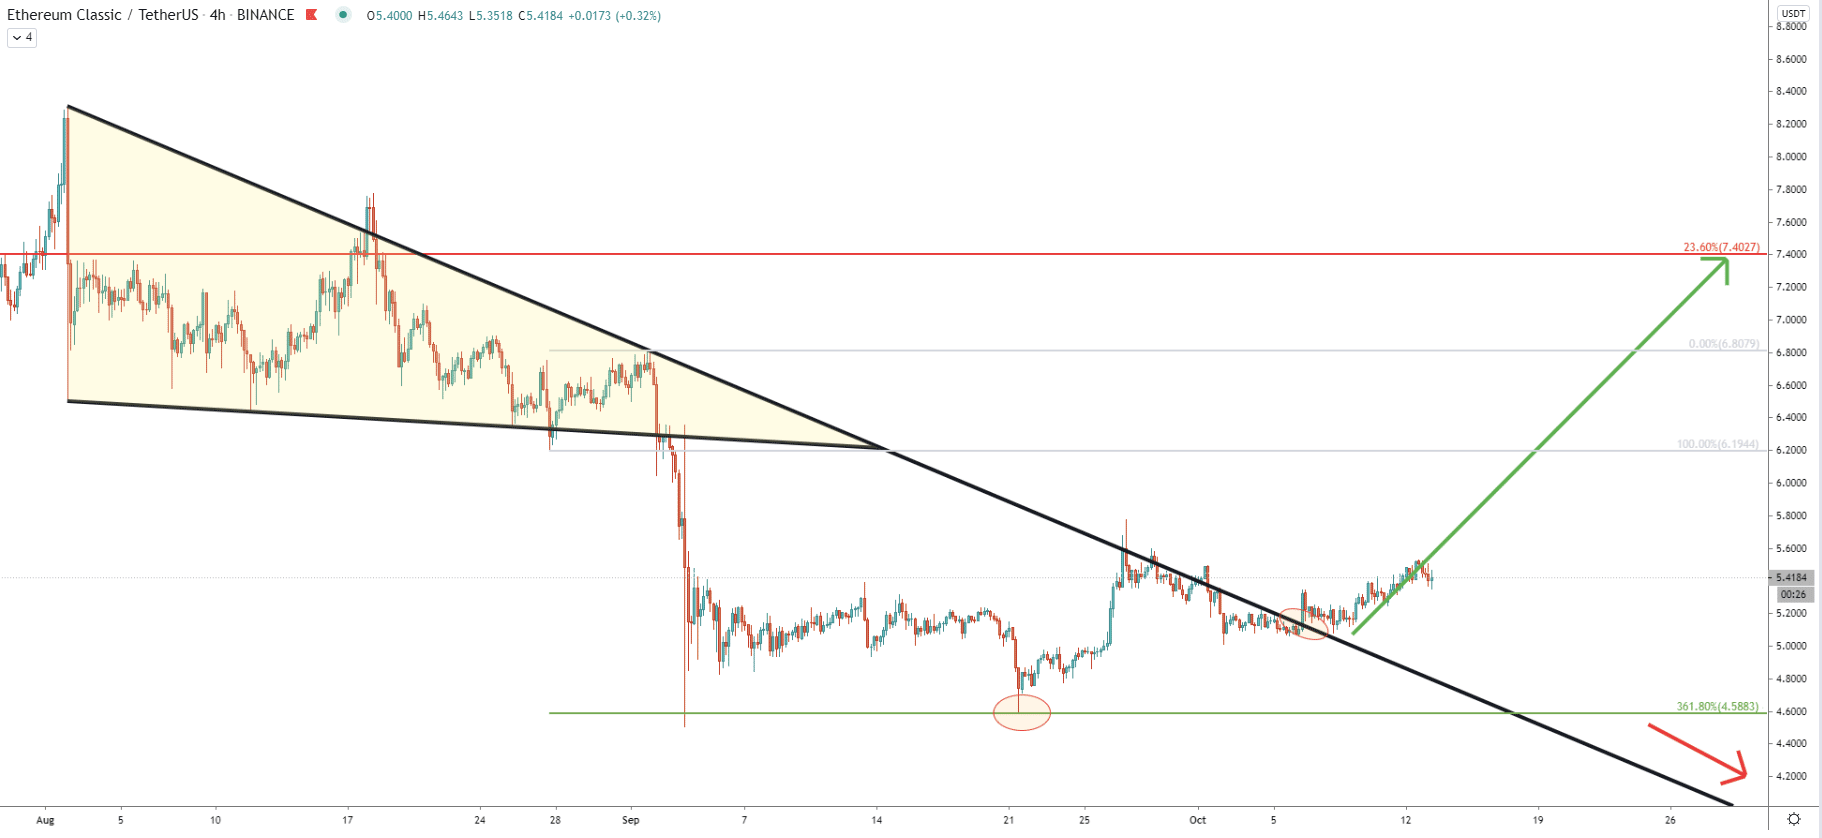
On the contrary to the 16-hour chart, on the 4-hour timeframe price broke above the downtrend trendline. Since then the price has been rising slowly, but steadily. There was a very precise rejection of the 4.58 support, which is the 361.8% Fibs applied to the corrective wave up after breaking below the support downtrend trendline. Both of these facts are in favor of the uptrend, but obviously, as long as the support is being respected.
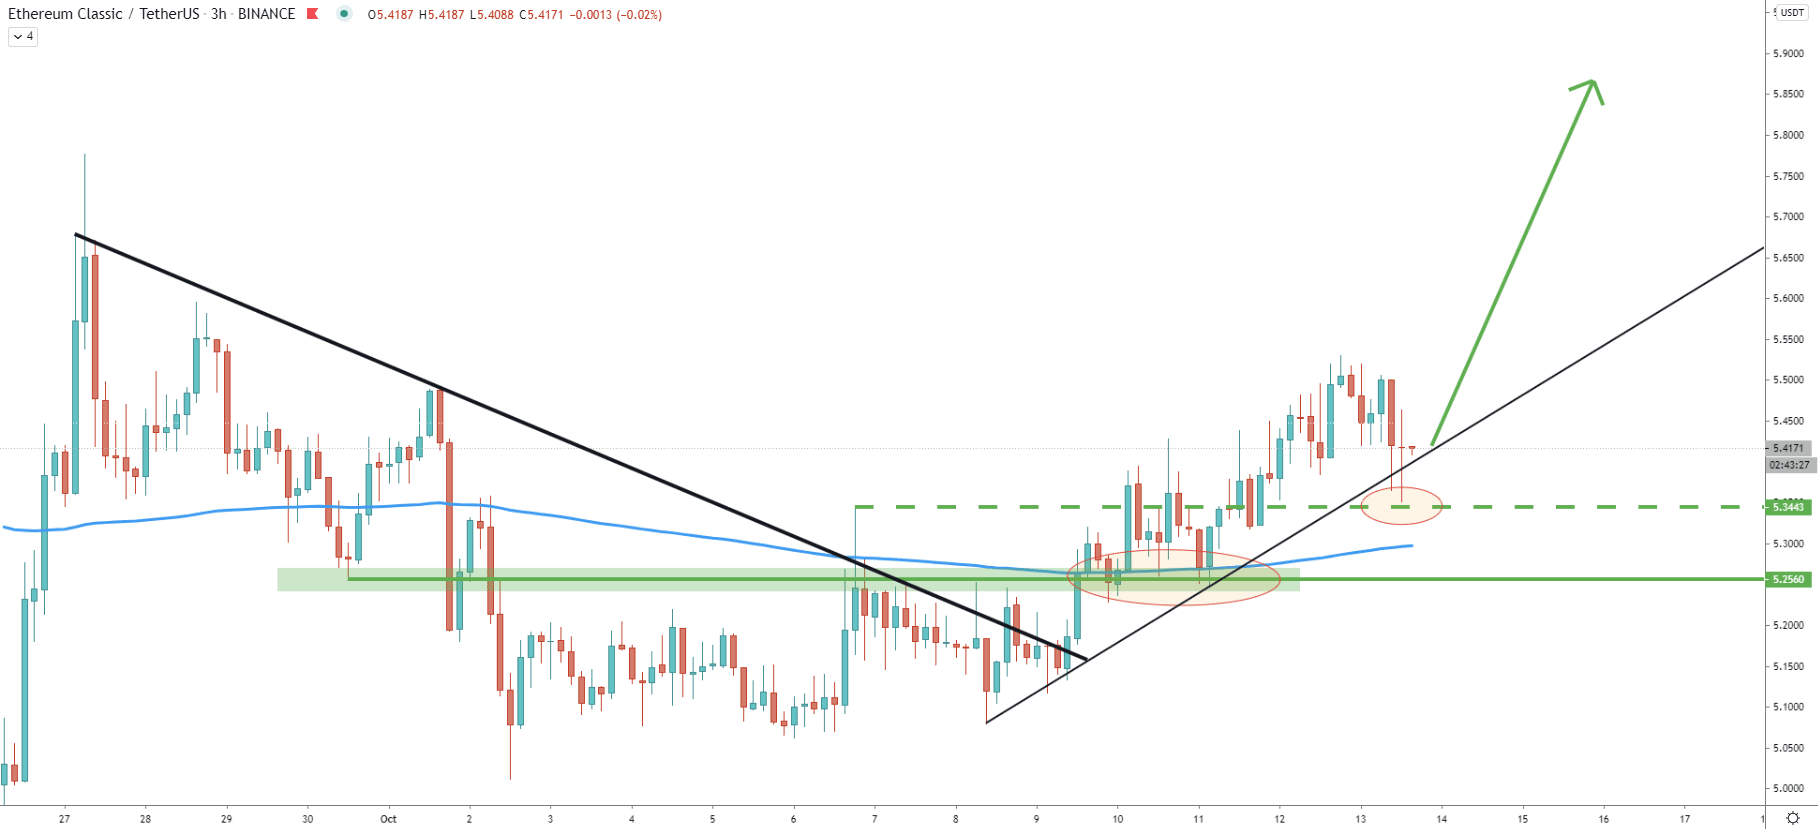
On the hourly chart, the price found the support at 5.25, which previously acted as the supply/demand level. This is where price also rejected the 200 Exponential Moving Average and then confirmed the breakout of the downtrend trendline. The price went above the key resistance at 5.34 suggesting strong bullish intentions. Right now ETC has corrected back and re-tested the previous resistance at 5.34, which now could be acting as the support. If this support holds, buyers are likely to step in once again, but this time with more power. Thus, the price could be starting to rise exponentially as long as ETC will not go anywhere below 5.25.
ETC/USDT continues to range on the weekly chart, although on lower timeframes price is rejecting the support and bouncing off the trendlines suggesting the beginning of the upside wave. As long as the support holds, price is expected to rise towards the top of the range as per the weekly chart.
The key supply zone and the potential upside target is located at 7.40 and is confirmed by the 23.6% Fibonacci retracement level as well as the average-price uptrend trendline.
As per the daily chart, the key support level is located at 4.48, which is confirmed by two Fibonacci levels and supports the downtrend trendline. Only daily break and close below will completely invalidate the bullish forecast, which at this stage seems a highly unlikely scenario.
Support: 5.34, 5.25, 4.48
Resistance: 5.80, 6.19, 7.70