
Published: August 27th, 2020
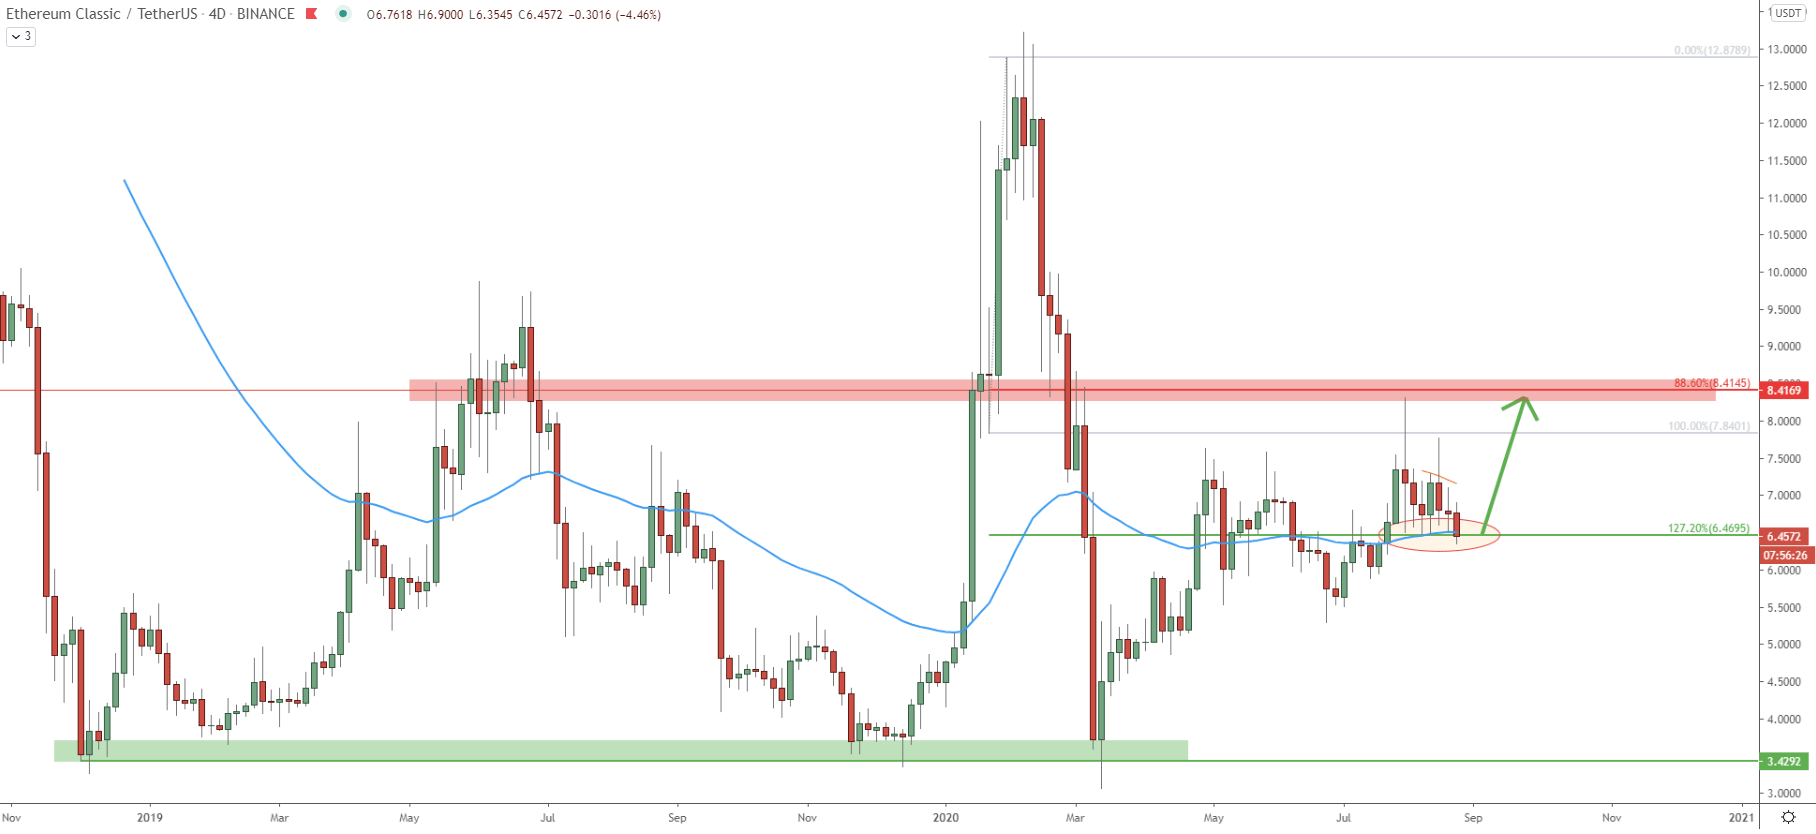
ETC/USDT found the bottom near $3.42, which is the key support area formed during the period of the last two years. The bottom was tested on March 13, when the price reached the $3.07 low. Since then ETC has been rising consistently, producing higher highs and higher lows. Fibonacci applied to the last upside wave up, shows that currently, the price is at the 127.2% Fibonacci retracement level, which is located at $6.46. This support level is being rejected along with the 50 Exponential Moving Average. It will be important to see the Weekly closing price because if it manages to stay above 6.15, the uptrend is likely to continue.
The nearest resistance is located at 88.6% Fibs, which is $8.41, making the upside target 30% away from the current price. This is a long term price forecast and it could take weeks or even months for the target to be reached if support holds. On the following charts, we’ll look more into the importance of the $8.41 resistance.
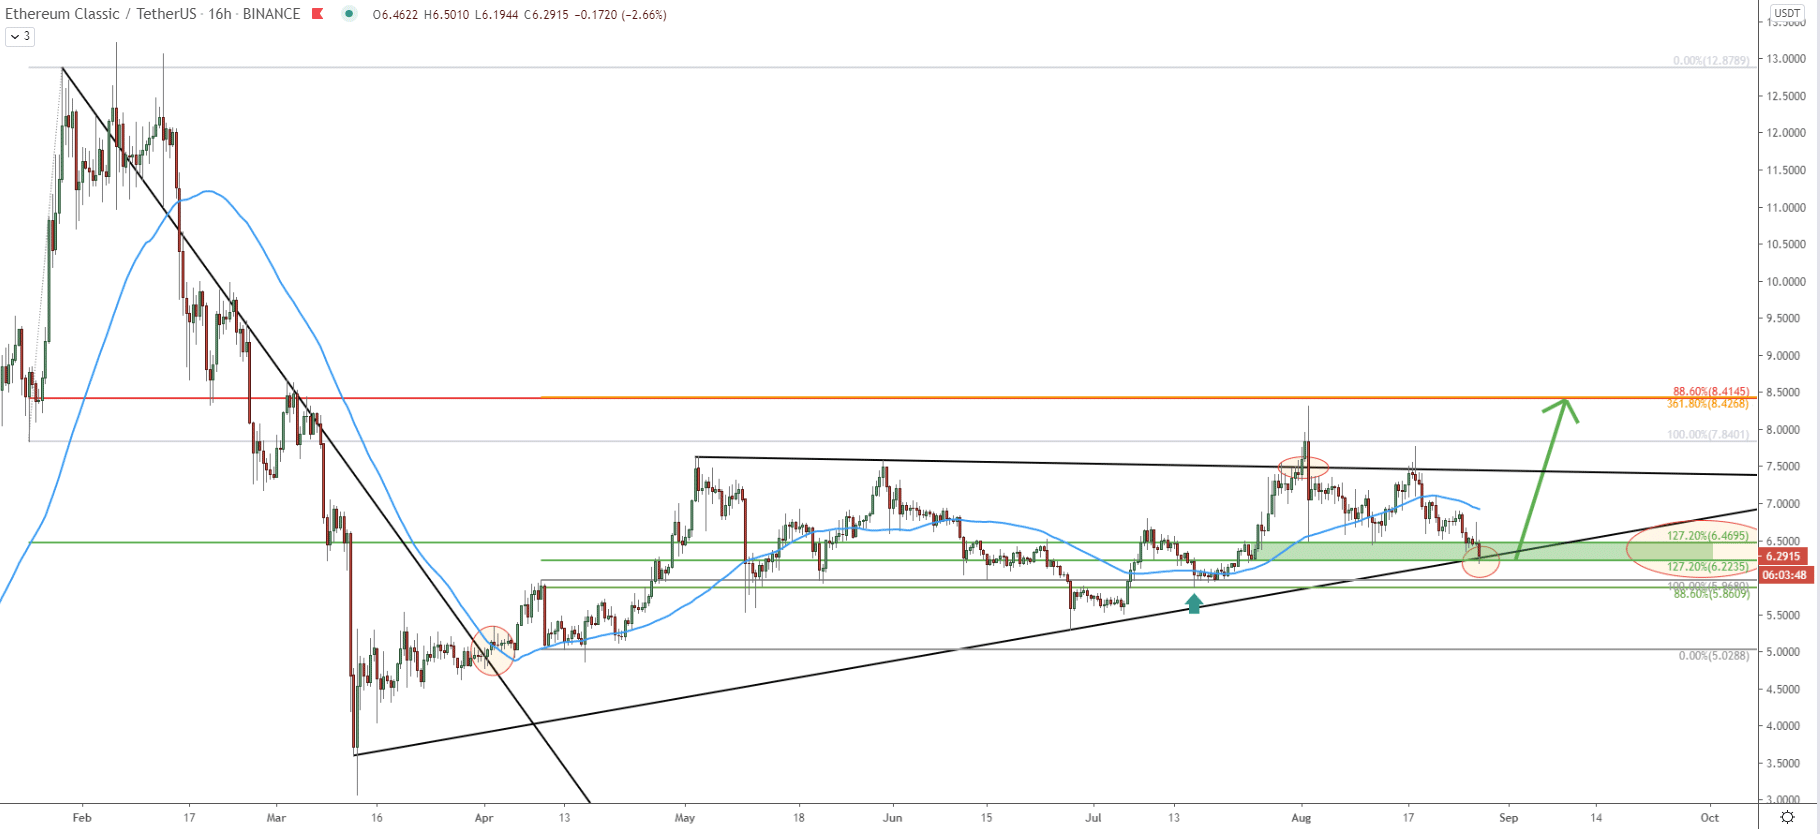
On this chart, we are getting back to the point where the downtrend trendline was broken, back in April this year. We have used a pullback after the breakout to apply the Fibonacci retracement indicator. The previously mentioned upside target at $8.42 cleanly corresponds to the 361.8% Fibs, making it an important supply zone. Also, we can see that previously price rejected the 88.6% Fibonacci support at $5.86, which occurred on July 16. After this rejection, the price went up and broke above the downtrend trendline, nearly testing the $8.42 resistance. But ETC failed to reach it and the price started to correct down.
Currently, we might be witnessing the end of an ABC correction, based on the Elliot Wave theory. At the same time price is rejecting the uptrend trendline and remains in the strong support area between $6.22 and $6.46. This support zone is confirmed by 2x127.2% retracement levels taken from both Fibonacci applied on this chart.
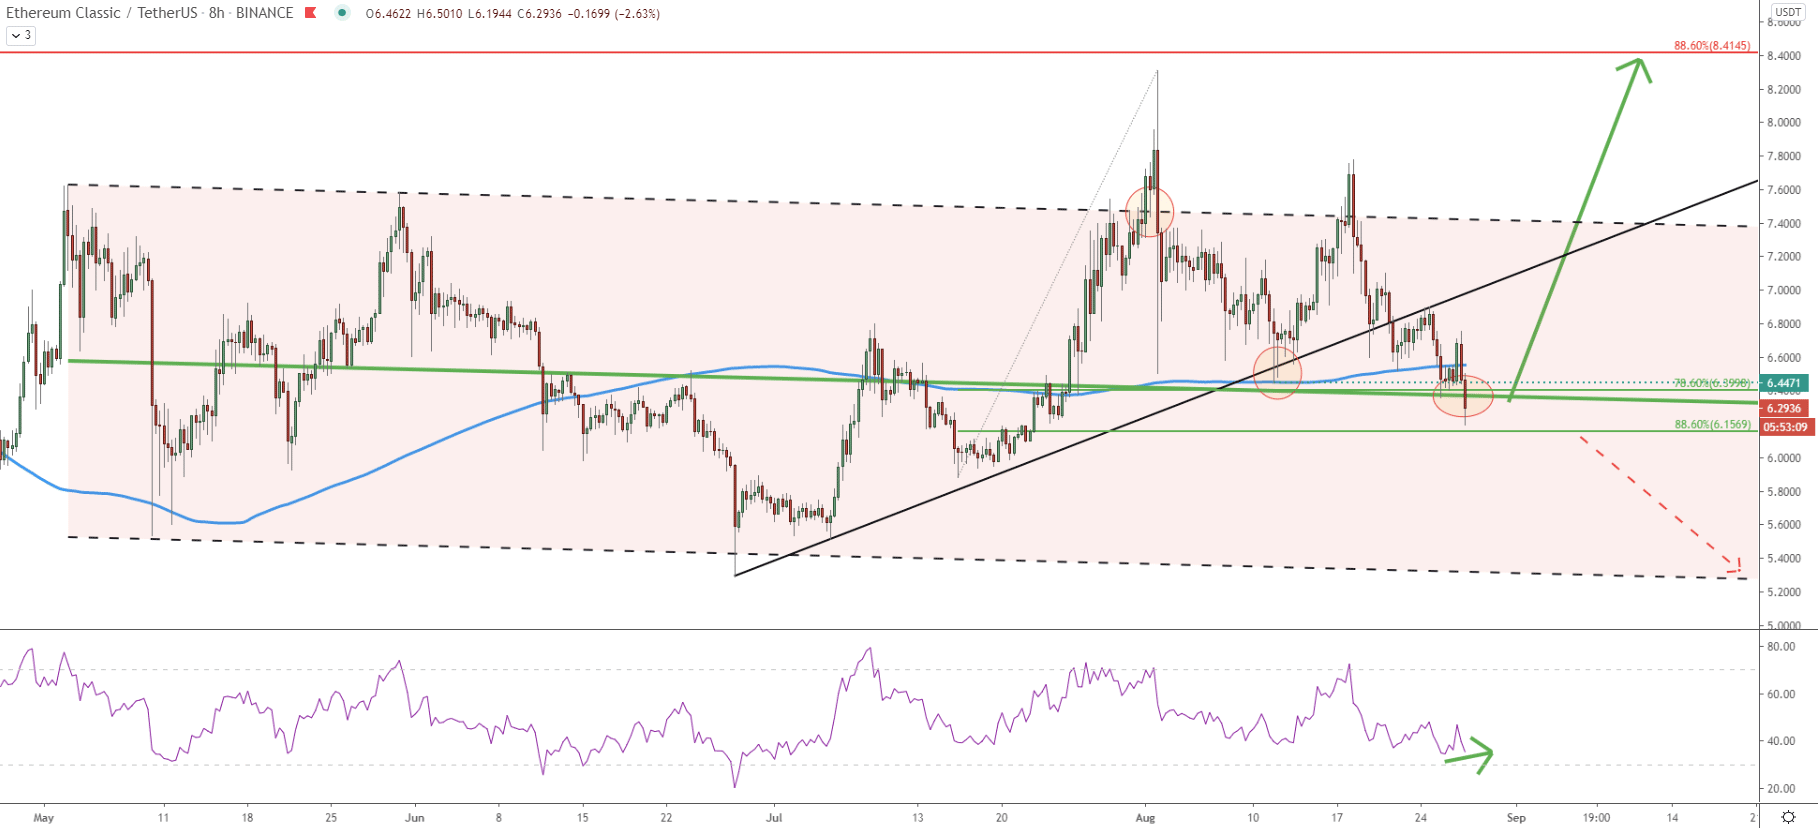
Ethereum Classic clearly broke above the descending channel suggesting further upside growth. Right now pair is testing the middle trendline of the channel which is acting as the support along with the 200 EMA. The EMA was rejected cleanly back on August 11, and since then there was no close below $6.44 level where the bounce off the EMA occurred. We can also see the formation of the bullish divergence on the RSI oscillator, which might be suggesting the end of the downside correction.
In case of an uptrend continuation, the worst-case scenario is that price will test 88.6% Fibs at $6.15 and only then will continue moving up. But if the price will decide to initiate a downtrend, there must be a break and close below $6.15 support.
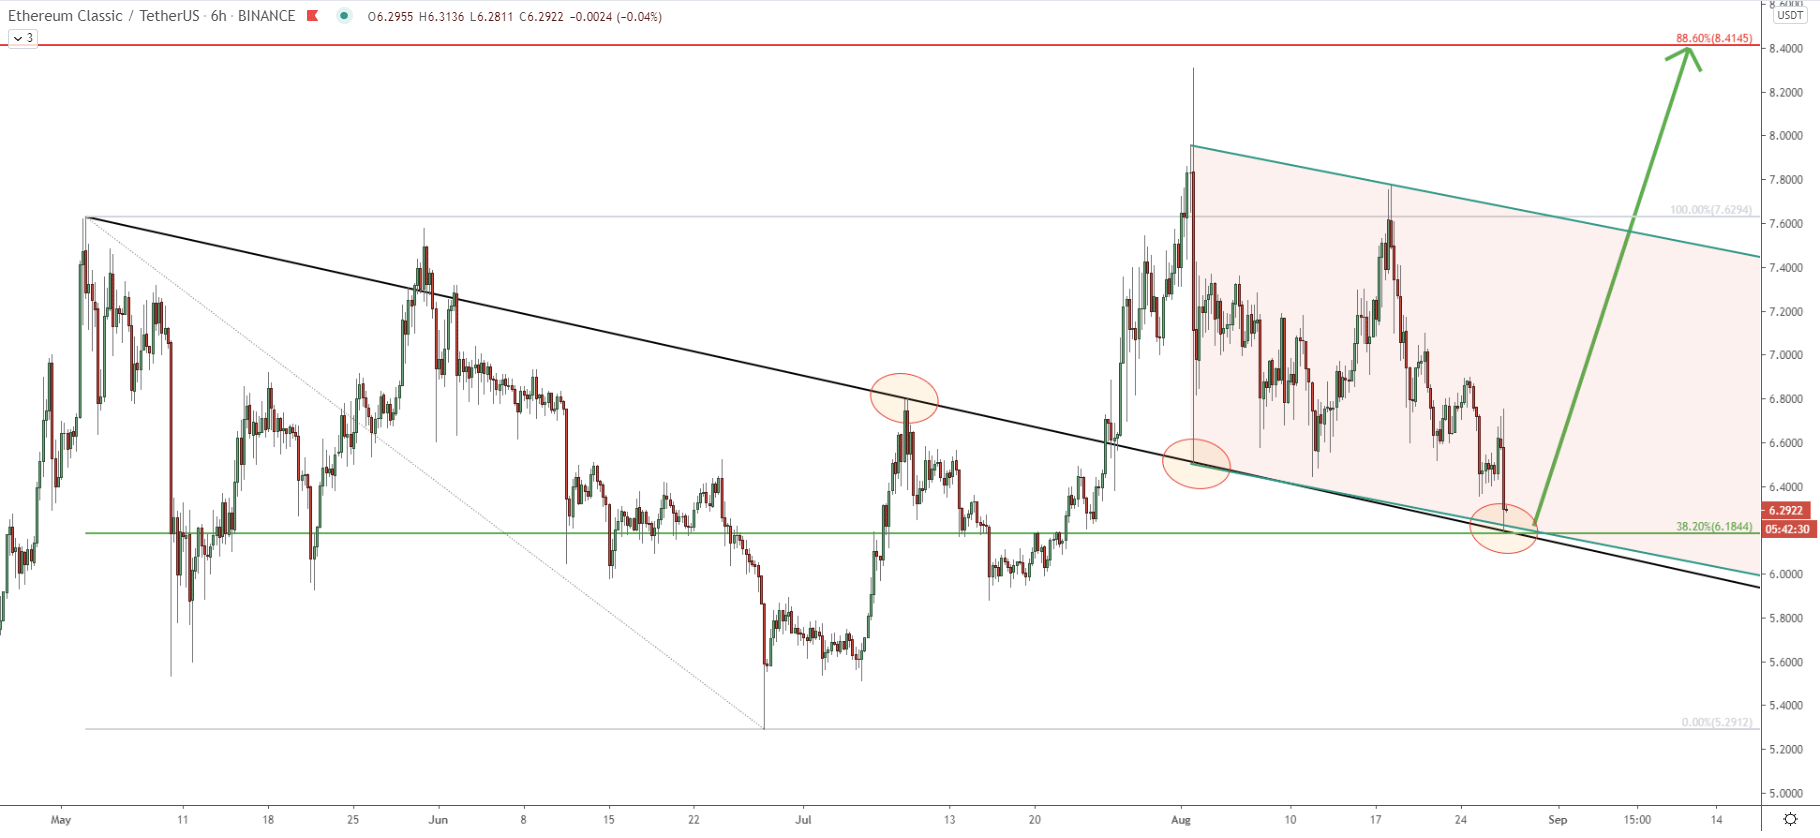
The average-price downtrend trendline today was rejected cleanly, along with the 38.2% Fibonacci retracement level at $6.18, At the same time price is right at the bottom of the descending channel, which should result in a strong bullish pressure this week. But this can only be expected as long as weekly close remains above the support. Therefore, buyers could be waiting for confirmation and will only take action early next week.
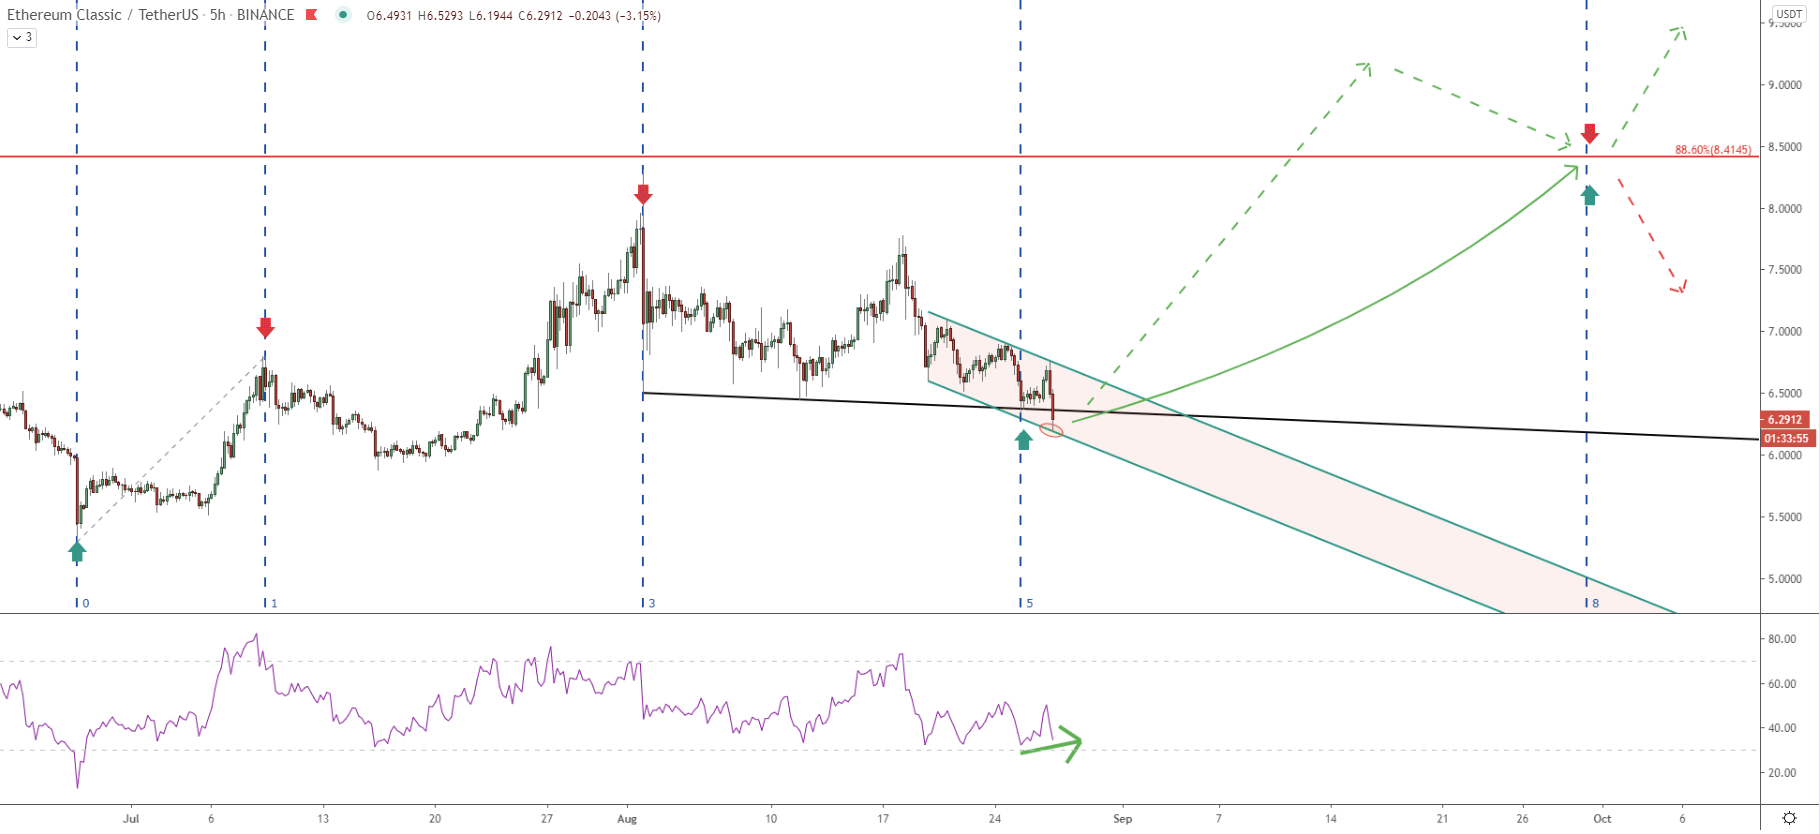
On this chart, the Fibonacci cycles indicator was applied to the beginning of an uptrend. A few days ago, ETC has entered a new cycle, which based on the current price action is likely to be very bullish. Price has reached the bottom of the descending channel and the RSI oscillator is forming a bullish divergence as price produced a new lower low and RSI produced a new higher low.
This cycle ends between the end of September and the beginning of October, which means that the upside target could be tested within just one month from now. But this might also be the beginning of yet another bull cycle if the upside target will be broken before the end of September.
Ethereum Classic could be providing an extremely good buying opportunity with a 30% growth potential within just one month. Weekly close must stay above current support in order to confirm ETC/USDT bullish intention.
As per the 4-day and 16-hour chart, the key resistance is seen at $8.41 and is confirmed by two Fibonacci retracement levels.
As per the 8-hour chart, weekly break and close below $6.15 support, will invalidate bullish scenario, and ETC/USDT with high probability will start to move down, towards the $5 key psychological support.
Support: $6.46, $6.22, $6.15
Resistance: $7.62, $7.77, $8.41