
Published: January 5th, 2022
Bank stocks showed an amazing movement from Monday as long-term treasury bills showed an upside pressure. It is a positive sign for lenders, expecting the loan yields to tie with these rates. Moreover, the hawkish expectation from the Fed regarding the rate hike in 2022 also benefited bank stocks to grow.
However, there were no specific price-driving events for Citigroup stock, but it is an attractive investment opportunity due to its deep discounted price. This stock is trading at 80% of its tangible book value (TBV). However, the recent performance of this instrument was not effective that was a frustrating factor for investors.
The selling pressure came after Citigroup’s announcement to pause the share repurchase program in Q4. However, the management hinted to resume the stock buyback program in Q1 of 2022. Therefore, the discounted price with a potential upside pressure made this instrument a potential investment opportunity.
Let’s see the upcoming price direction from the Citigroup stock (C) technical analysis:
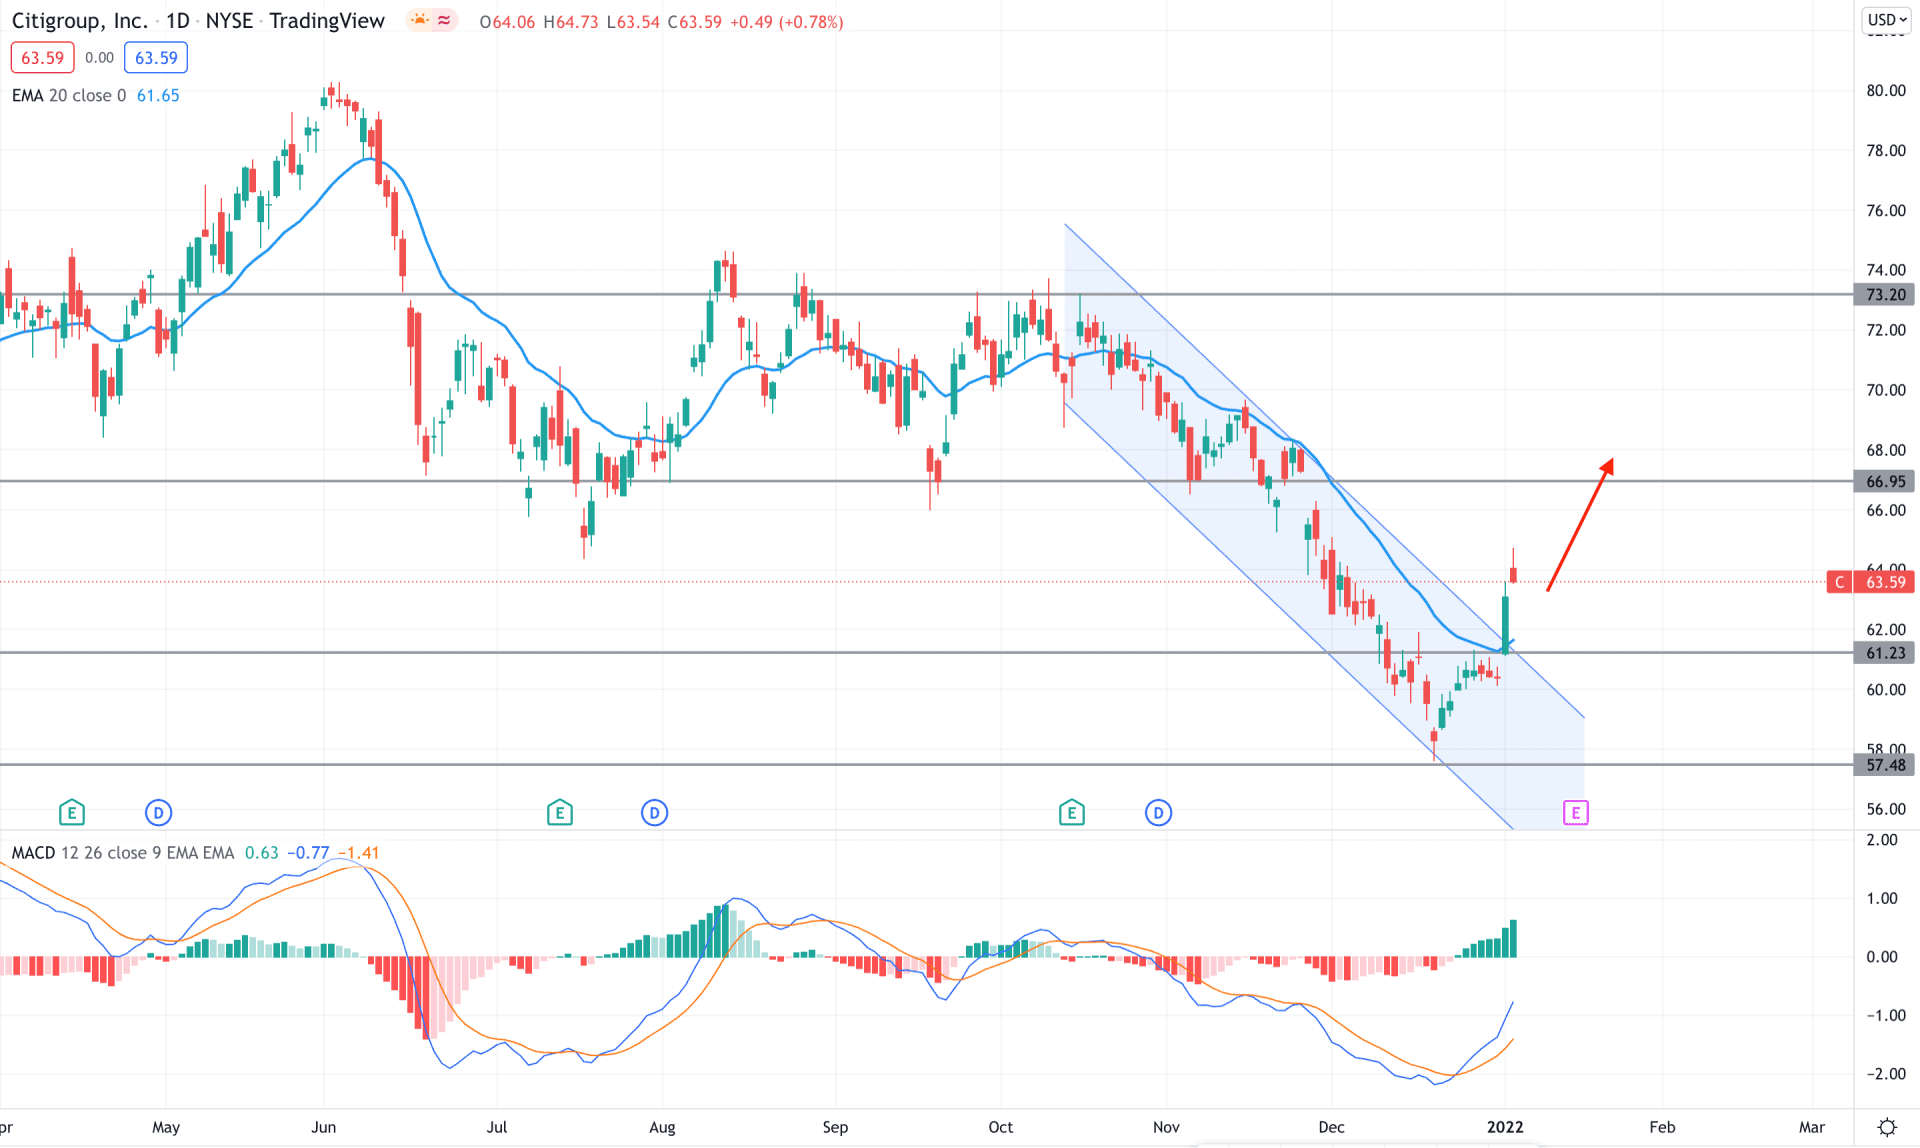
Citigroup stock (C) showed a deep correction in recent months where the price moved lower from 80.00 to 57.48 level while other bank stocks moved higher. The reason behind the divergent movement was the inability to show profitable quarters where fund transfer to the wrong entity and exiting CEO’s retirement were the main reasons. However, the devastating situation is likely to be over, and the banks have stepped into a new year where the share repurchase program is likely to happen. Therefore, the recent bearish channel breakout with stable price action above the dynamic 20 EMA is the primary sign that bulls are interested in this instrument.
The above image shows how the MACD Histogram turned bullish and aimed higher by creating consecutive higher highs. Moreover, the recent bullish channel breakout was supported by the dynamic 20 EMA and static 61.23 level. In that case, the buying possibility in this stock is valid as long as it trades above the 61.23 support level.
Based on the recent market context, the bullish possibility in this instrument is active where the primary target is 66.95 level. On the other hand, further discounts in the stock price below the 57.48 level might alter the current market structure and lower the price towards the 54.00 level.
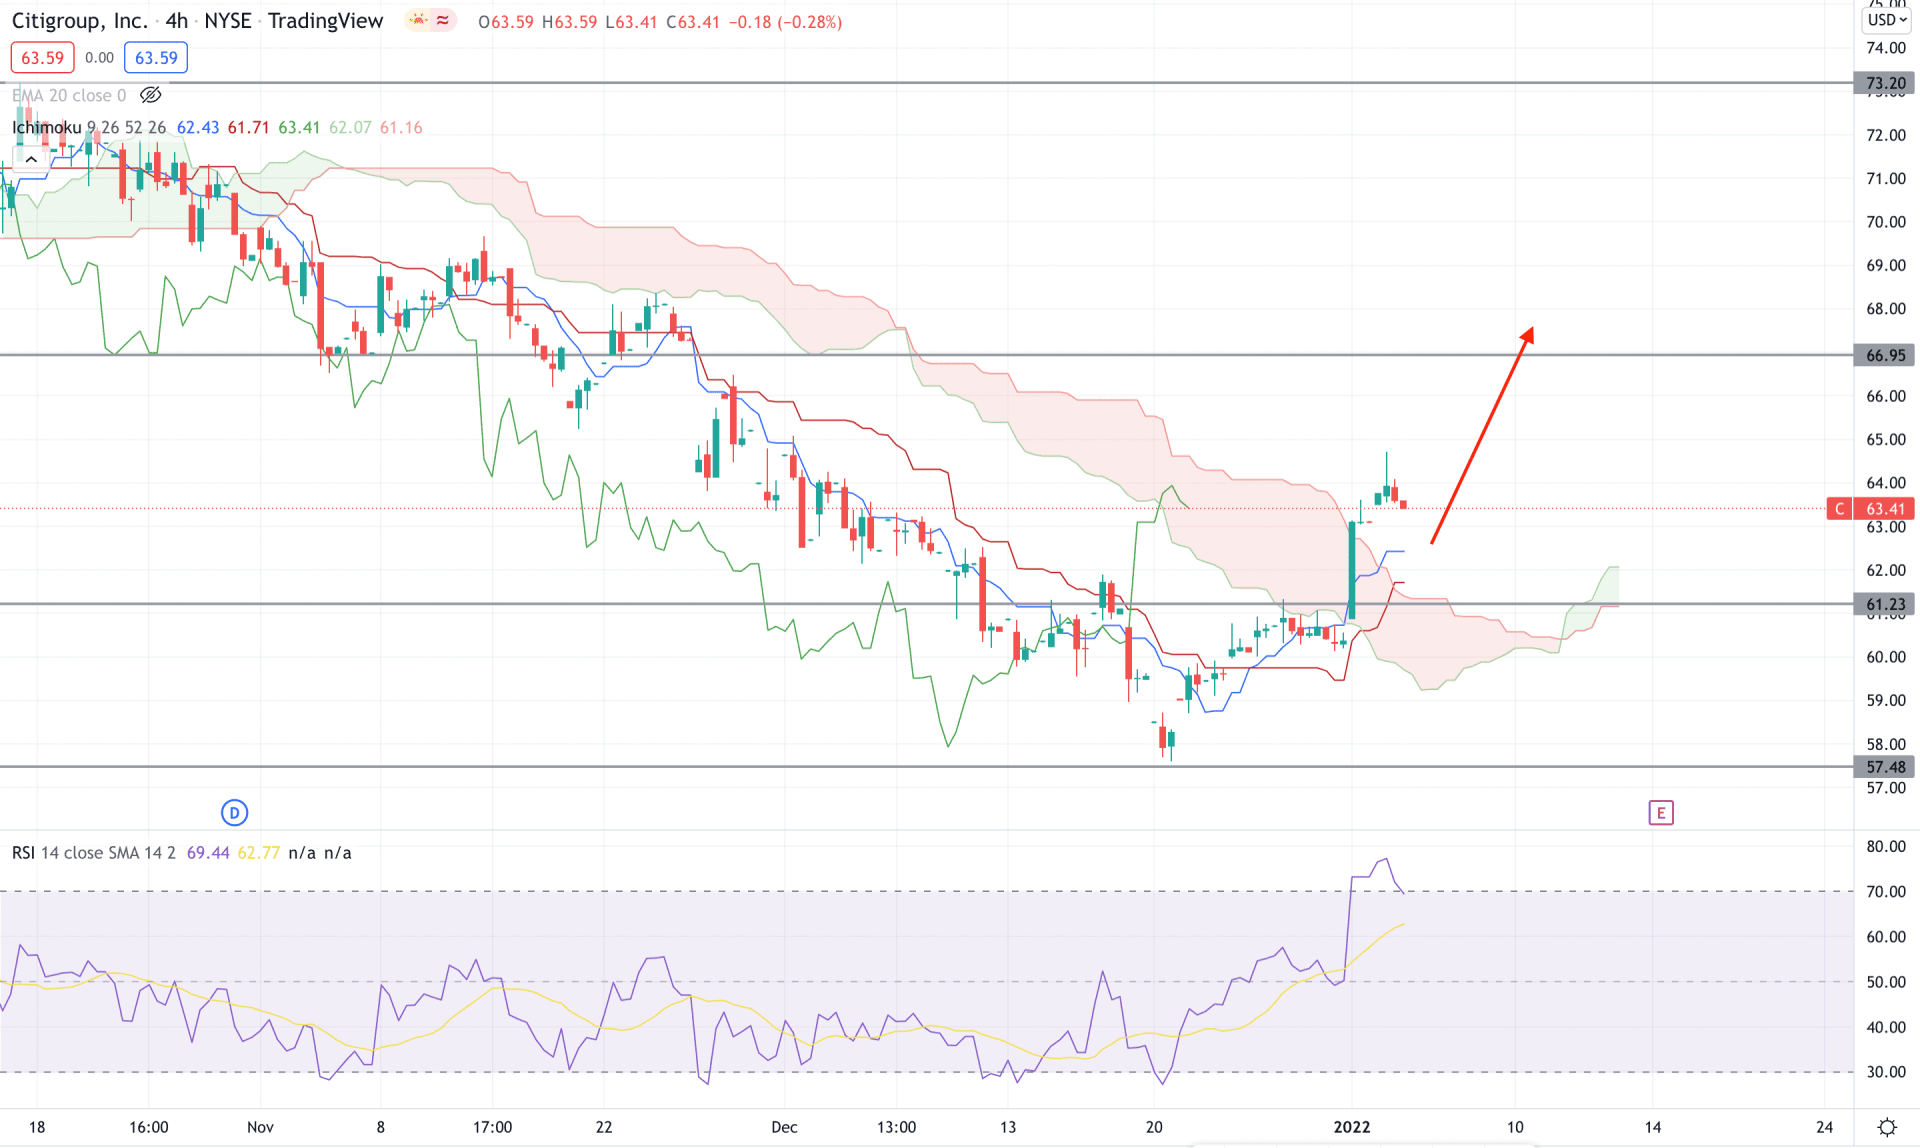
According to the Ichimoku Cloud, the Citigroup Stock showed a decent bullish breakout where the price moved above the Kumo Cloud with an impulsive bullish pressure. Moreover, the buying pressure took the price above dynamic Tenkan Sen and Kijun Sen with a bullish crossover. Therefore, as the current price is held by bulls, it is more likely to show another upside pressure in the coming days.
The indicator window says that the RSI is above the 70 level, which indicates that bulls are aggressive in the price. Moreover, the recent price is trading above dynamic Kijun Sen and Tenkan Sen, and both of these tools are surging higher.
Therefore, based on the H4 context, any bearish correction would be a buying opportunity in this pair, where the primary target would be at the 66.95 resistance level. However, a break below the Kumo Cloud with an H4 close would alter the current market structure and lower the price towards the 55.00 area.
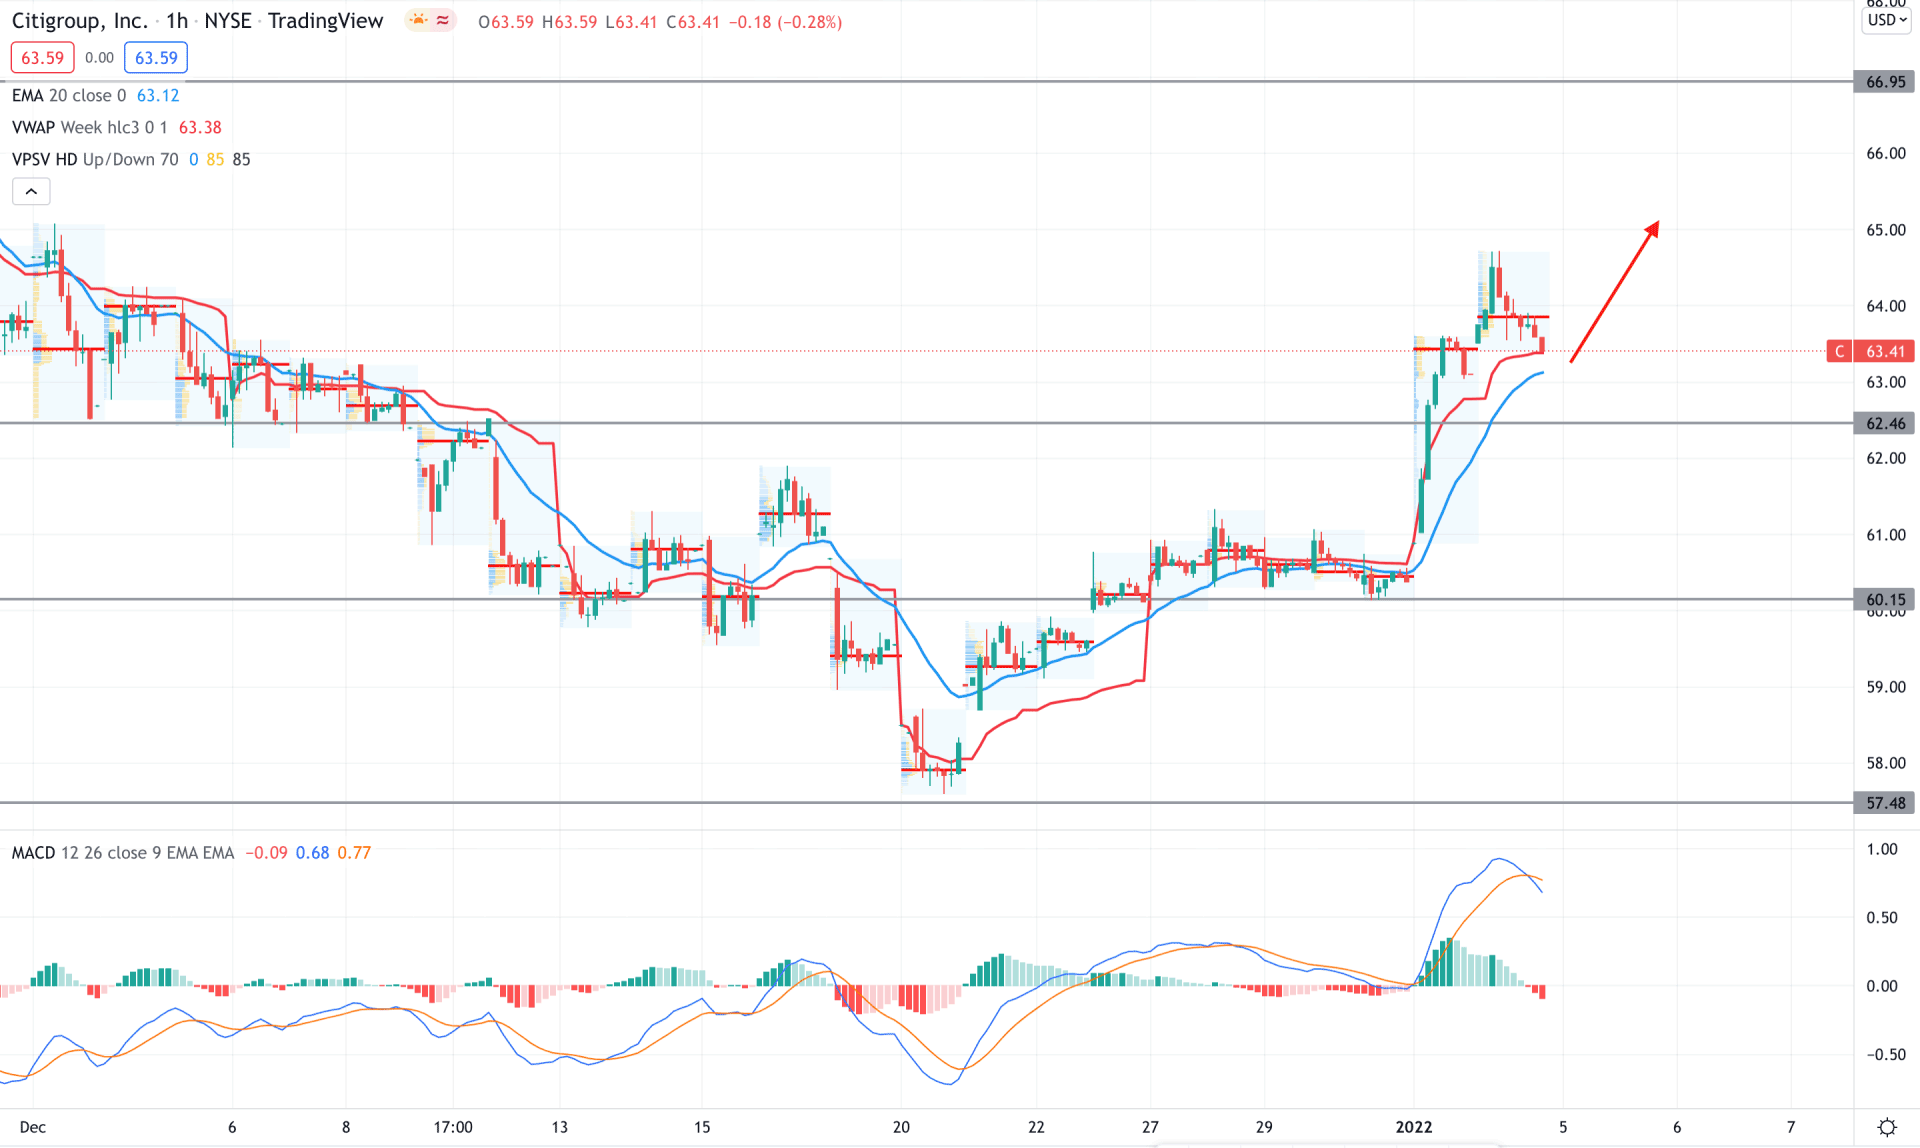
In the intraday chart of Citigroup stock, the recent price action was a sign of buyers’ interest where a bullish breakout appeared above the 60.15 resistance level. Moreover, the recent price moved above the dynamic 20 EMA with an aggressive buying pressure, pointing out further bullish pressure in the price.
The above image shows a minor correction that appeared after the recent bull run where the MACD Histogram is bearish and dynamic weekly VWAP is bullish. In this context, any buying pressure from the dynamic VWAP or static 62.46 level would resume the current buying pressure towards the 66.95 area. Moreover, the deep discount to 60.15 would be another buying opportunity, while the 57.48 level is the invalidation level of this setup.
According to the current observation, Citigroup Stock (C) is more likely to extend the current bullish pressure in the coming days. In that case, investors should find buying opportunities in this instrument from the 63.00 to 61.00 area with an appropriate bullish signal. On the other hand, a break below the 57.48 level would alter the current bullish setup and initiate a selling pressure towards the 50.00 area.