
Published: April 7th, 2022
The broader crypto market tumbled where the widespread selling pressure pushed Ethereum, Bitcoin, and other large-cap tokens prices down. Moreover, Altcoins faced a bigger hit as the BTC price dipped to 43,400 area at the press time. Meanwhile, Ethereum's price dropped by 9.71% from the 3575.22 swing high. The bearish sentiment in the broader crypto market came from Fed governor Lael Brainard’s speech to shrink its balance sheet as early as May at a rapid pace. As a result, the market sentiment turned the direction towards the US Dollar leading to selling pressure in cryptos and stocks.
The latest Fed meeting minutes revealed that the bank has officially agreed to reduce the balance sheet by $95 billion per month. The minutes also said that the central bank policymakers are willing to raise the interest rate by further 25 basis points. Although the price moved lower, the Ethereum bullish factor is still optimistic as it made a new higher high in the daily chart, indicating a bullish break of structure. Moreover, the trading volume was supportive, where the last 24 hours' volume was $22,641,014,613, 5% up from the previous day.
Let’s see the future price direction from the ETH/USDT technical analysis.
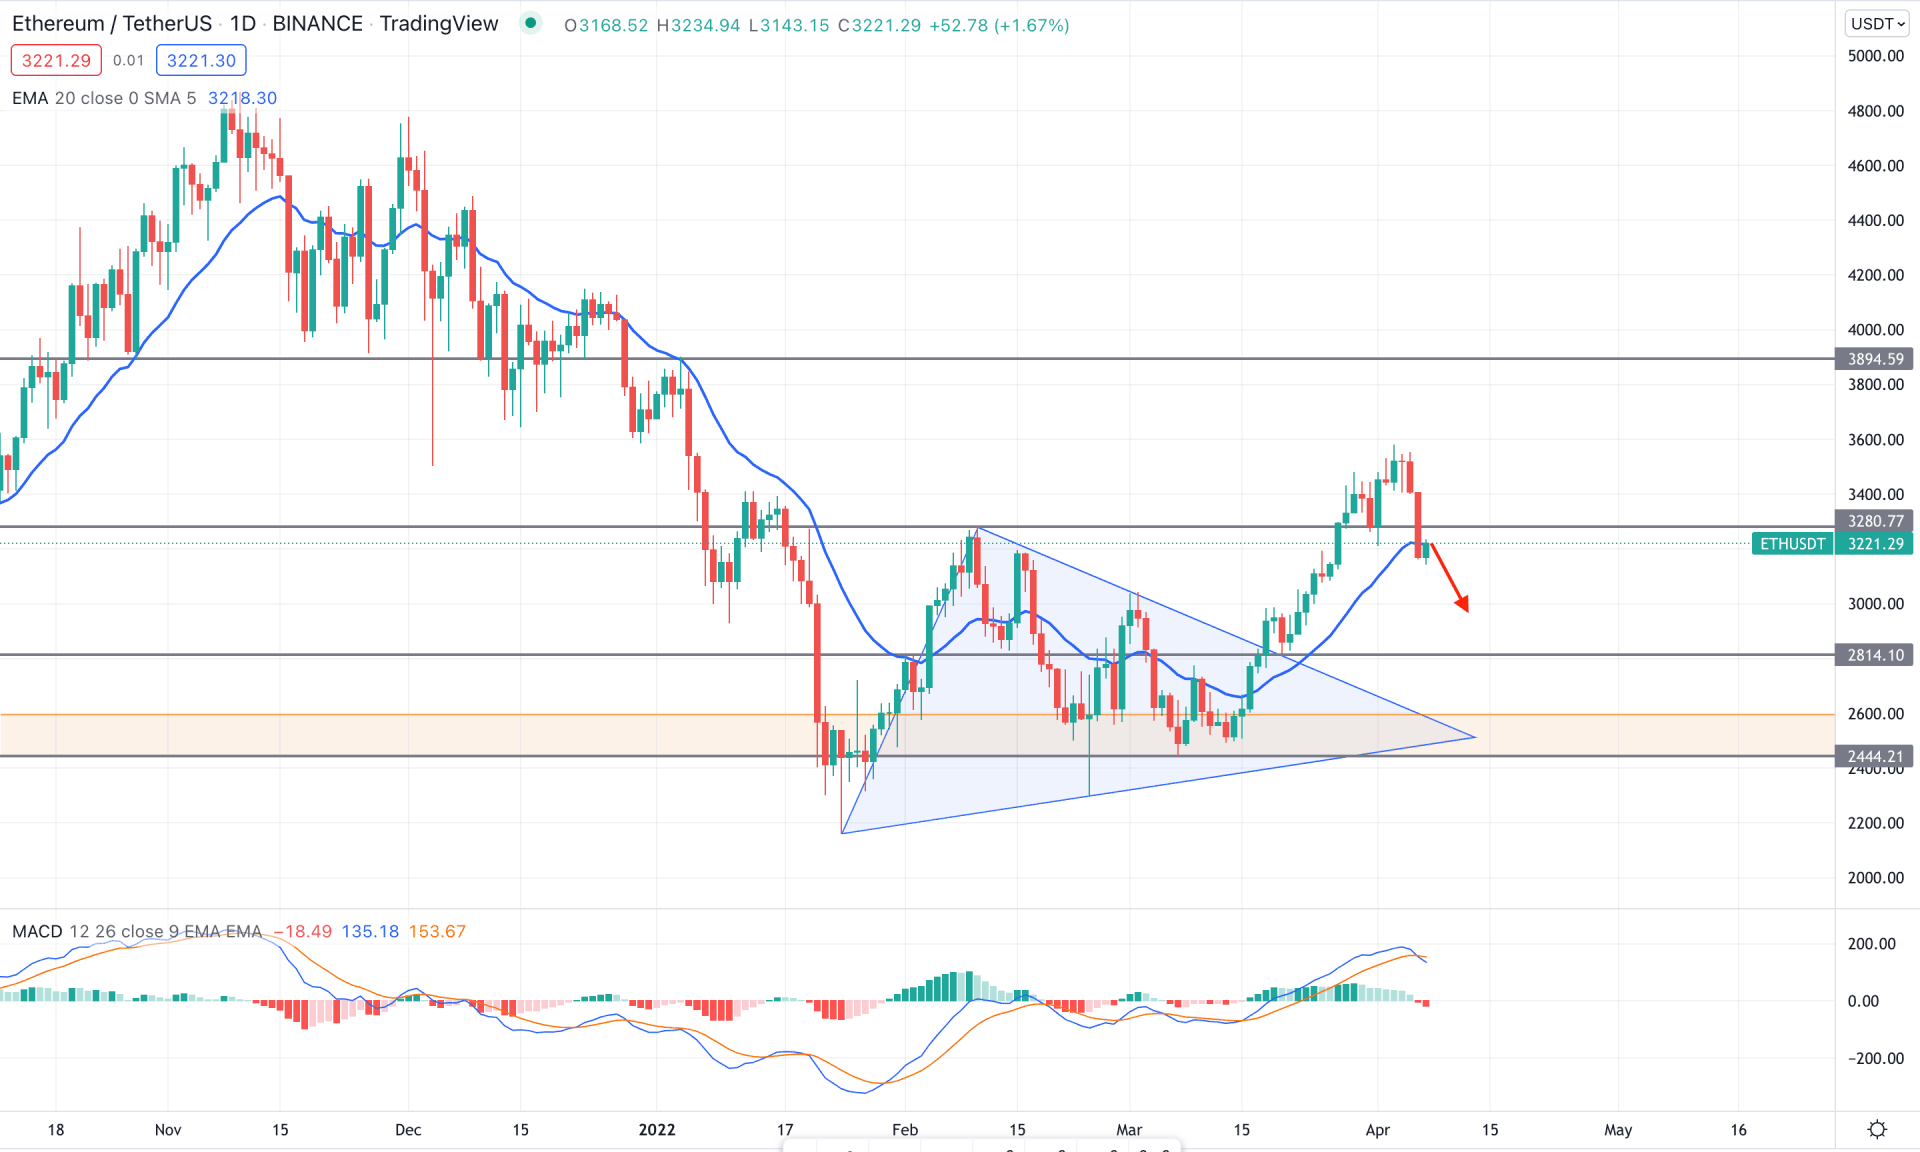
In the ETH/USDT daily chart, the most recent bearish pressure came from the 3575.22 level, which is the new swing high after the symmetrical triangle breakout. Moreover, after the triangle breakout, the price did not show any considerable correction, opening a possibility of corrective selling pressure. In that case, the upside momentum is still valid even if the FOMC driven selling pressure made a 9% loss to bulls.
The above image shows how the price made a new swing high above the 3280.77 level and remained corrective at the dynamic 20 EMA area. However, the price action above the 3280.77 level became extremely corrective, increasing the possibility of selling pressure in the coming days. The MACD Histogram turned bearish in the indicator window while the MACD line crossed the EMI line and aimed lower.
Based on the daily price structure, investors should closely monitor how the intraday price sets below the 3142.00 level. As long as bears hold the price below the 3280.77 level, the upcoming price direction would be bearish towards the 2814.00 support level.
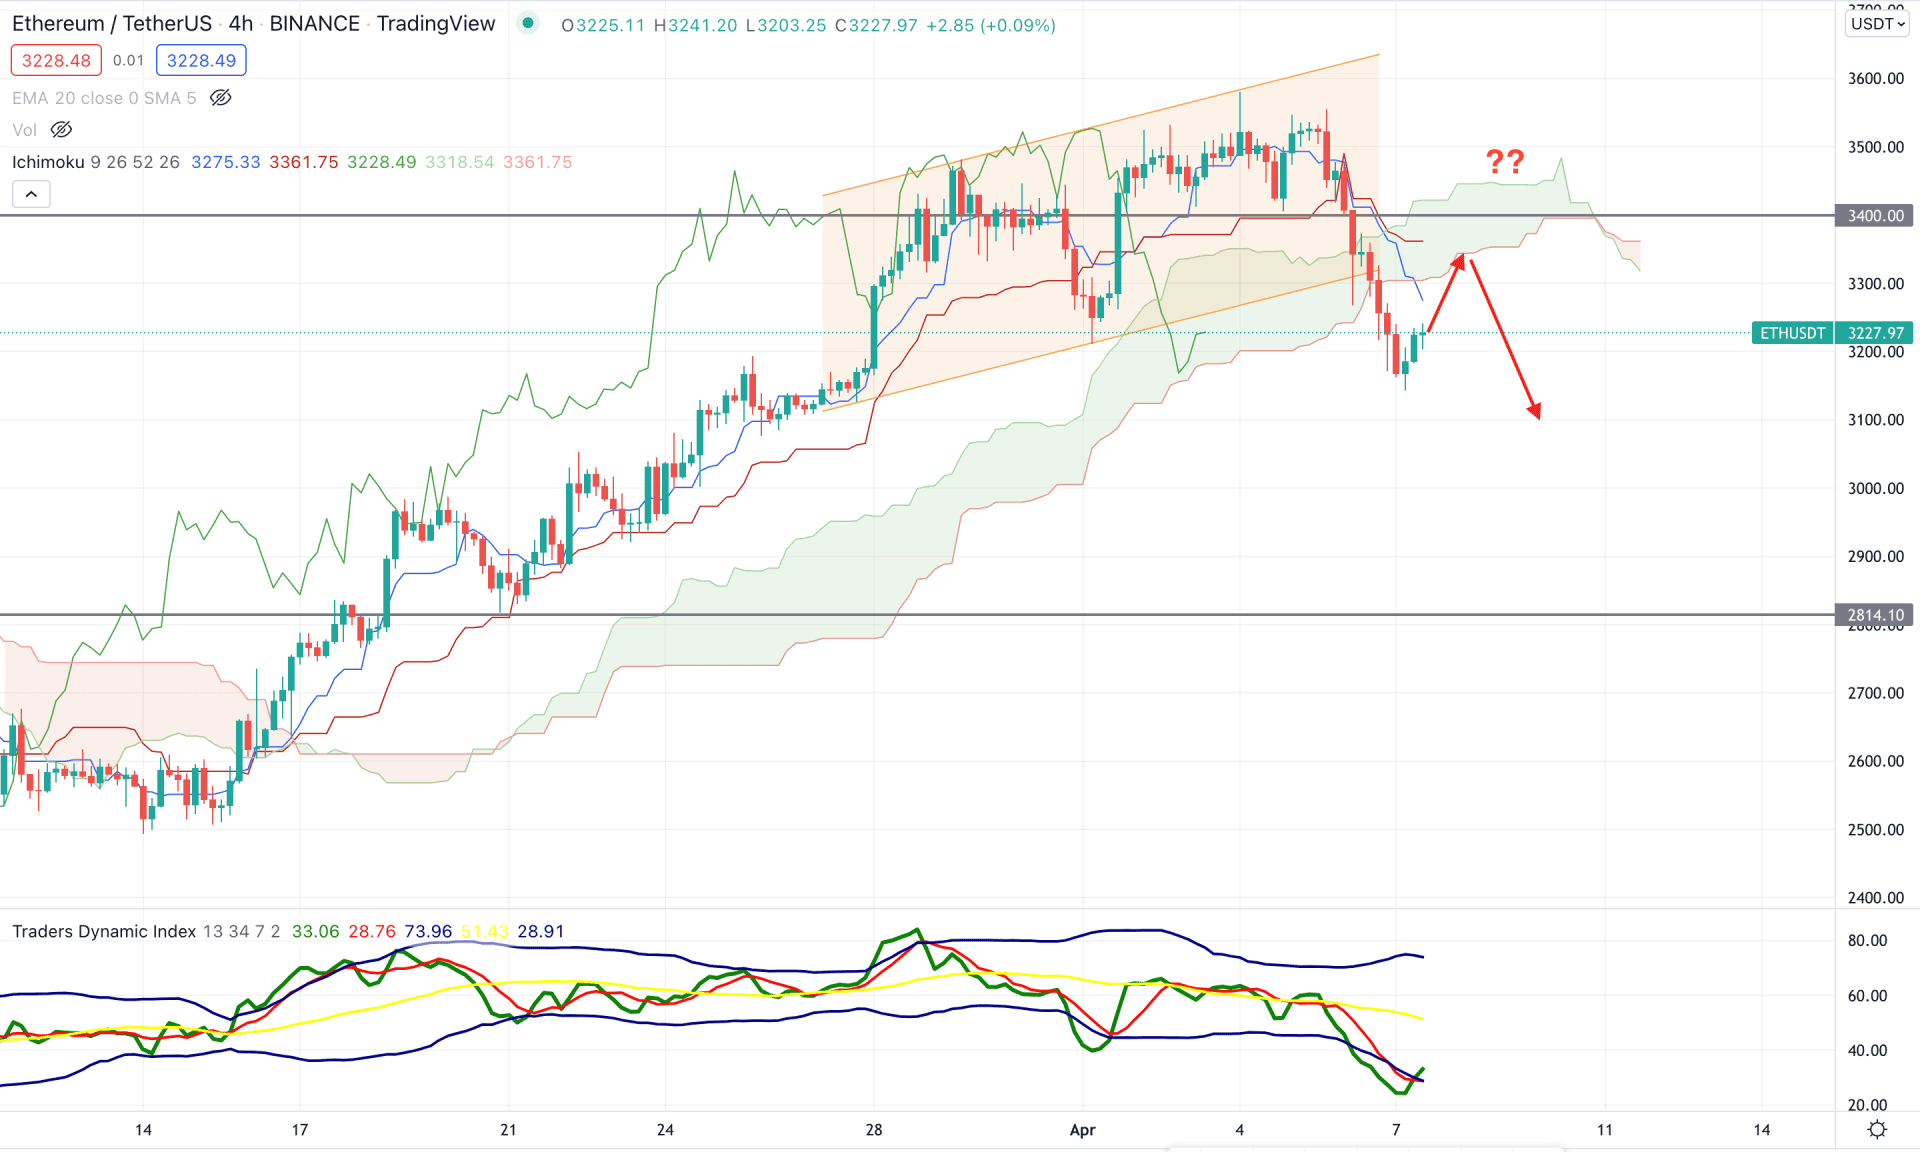
In the H4 chart, ETH/USDT showed a bullish channel breakout where the price shifted its position below the Kumo Cloud. Meanwhile, the price violated the most recent swing low of 3213.13 level and made a strong ground below the dynamic Tenkan Sen. Meanwhile, in the future Cloud, the Senkou Span A shifted its position below the Senkou Span B and aimed lower.
The above image shows how the TDI line moved below the lower band, indicating extreme selling pressure in the chart. Therefore, the rebound of the TDI line from the oversold position is a sign that bears may resume momentum after a correction. Moreover, the current price trades below dynamic Tenkan Sen and Kijun Sen, where the possibility of a correction toward the Kijun Sen line is pending.
Therefore, the H4 chart may provide a bearish opportunity from the 3280.00 to 3360.00 area if the price shows a bearish rejection from the dynamic Kijun sen. On the other hand, any bullish pressure above the 3400.00 level would alter the current market structure and higher the price towards the 3600.00 level.
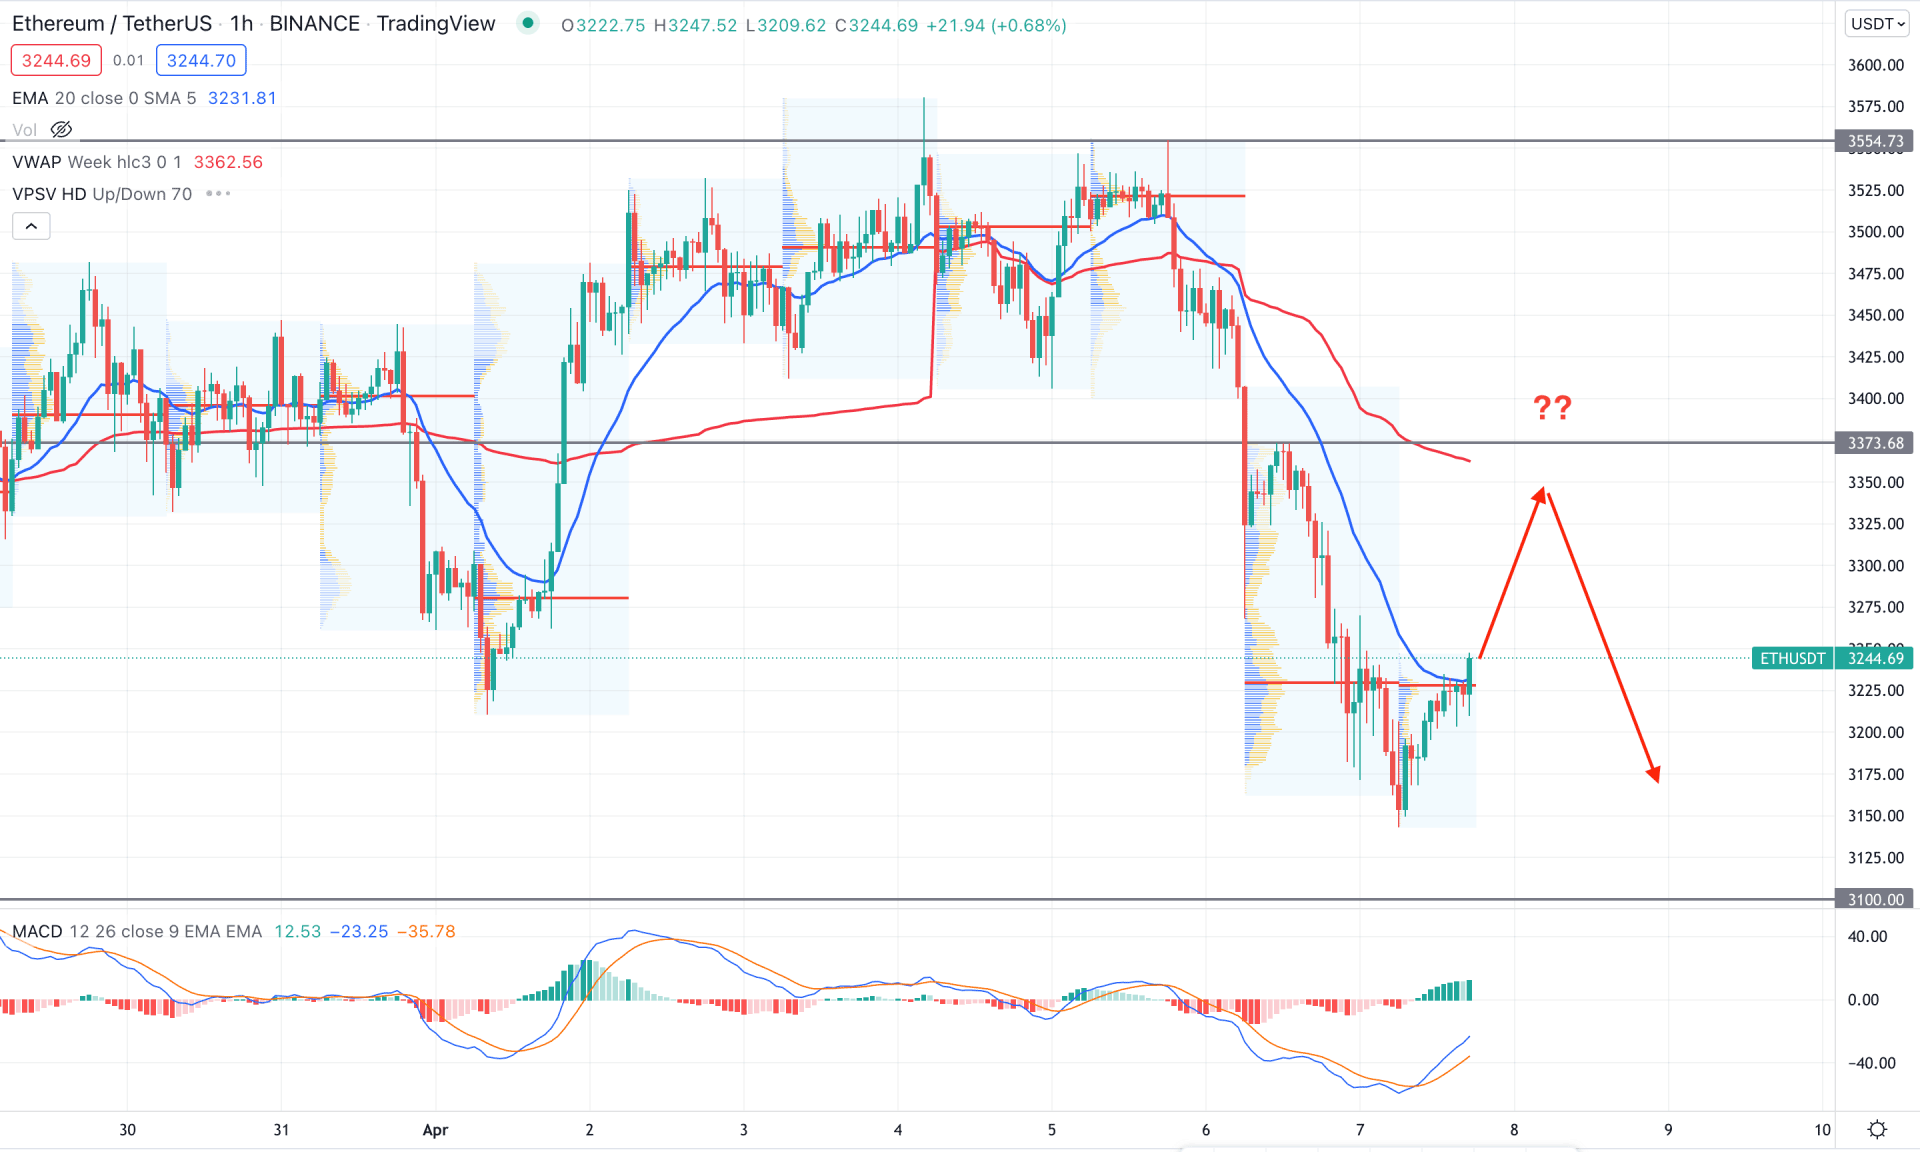
ETH/USDT is trading within an extreme selling pressure in the intraday chart, where the most recent price extended the gap with the weekly VWAP. Moreover, the price moved above the intraday high volume level of 3229.18 and formed a bullish H1 close.
The above image shows how the MACD Histogram turned bullish and aimed higher while the MACD line is below the Histogram with an upside momentum. In this context, any bullish H1 close above the dynamic 20 EMA would increase the buying possibility towards the 3373.78 static resistance level from where a bearish pressure may come. In that case, investors should find bearish rejection candles from 3373.78 to 3320.00 area before considering it as a sell. On the other hand, the breakout above the 3373.78 level would extend the buying pressure towards the 3554.73 level.
Based on the current multi-timeframe analysis, Ethereum has a higher possibility of extending the selling pressure to complete the correction followed by the symmetrical triangle breakout. In that case, any bearish opportunity in the intraday chart has a higher possibility of taking the price down, where the ultimate target is to test the 2814.10 level.