
Published: March 1st, 2022
CADJPY faced a lot of volatility from the current Ukraine-Russia crisis, where the Russian economy and the Canadian dollar are directly connected to the crude oil price. Russia is one of the prominent oil producers globally, where the uncertainty by blocking the country from the SWIFT payment gateway would make the oil price more uncertain.
Currently, WTI Crude is nearly at 7 years high where the daily chart is moving up with the support from dynamic 20 EMA. In that case, any bullish structure break above the 100.60 level would open new rooms for testing the 110.00 level. In that case, the Canadian Dollar has a higher possibility of benefiting while the Japanese Yen has faced pressure from the rising inflation.
The February preliminary PMI moved down in Japan with a drop in manufacturing and service sectors. Moreover, the employment index provided a weaker decline where the downside pressure came from the supply chain constraints. Now the Japanese economy is facing downside pressure due to the higher energy prices where the post-Covid recovery has slowed. In that case, investors should closely monitor how this week’s BoC monetary policy decision is coming, where the current expectation is a rate hike from 0.25% to 0.5%. In that case, CADJPY is more likely to show a breakout from the recent consolidation and make a new monthly high.
Let’s see the upcoming price direction from the CADJPY technical analysis:
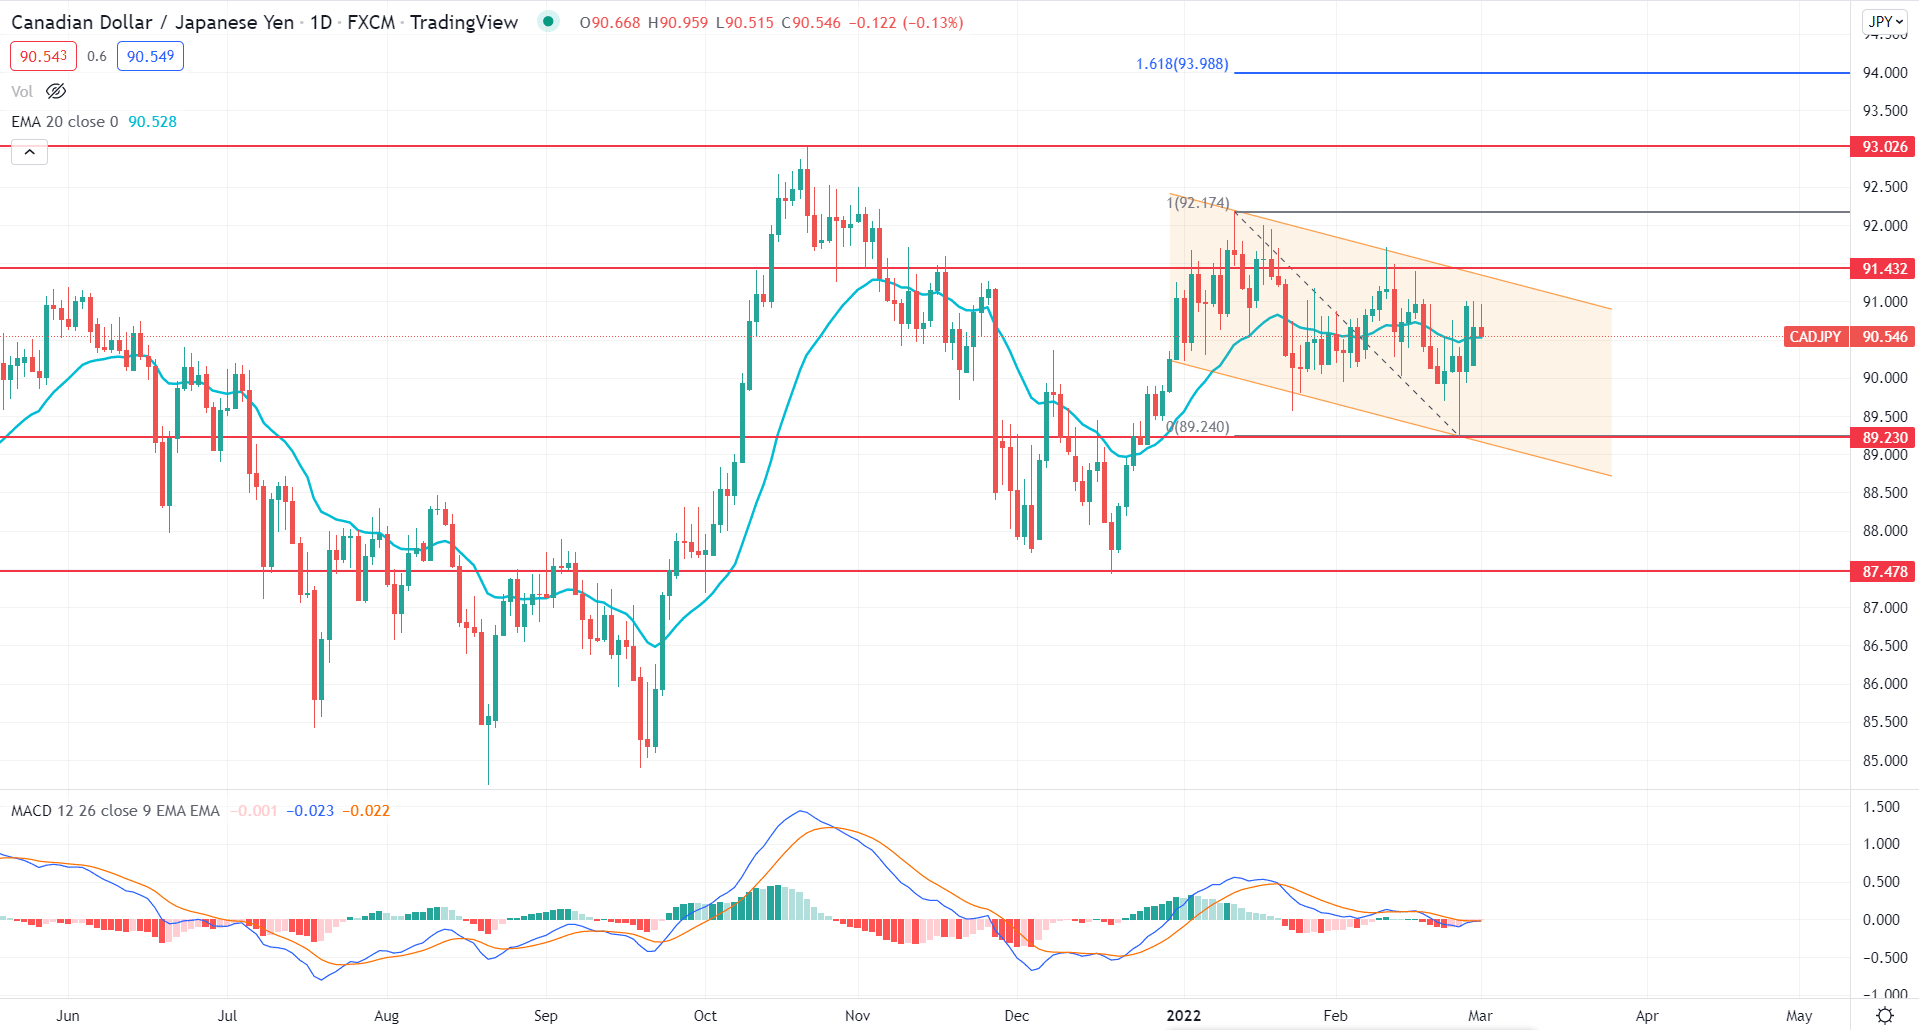
In the CADJPY daily chart, the broader market trend is bullish, where the recent price is trading within a bearish channel after breaching the 91.43 swing high. The excessive volatility made trading in this pair hard in the intraday chart, but the recent rejection from the 89.23 swings low opened a bullish trend trading opportunity in the higher timeframe.
The above image shows how the MACD Histogram remained corrective at the neutral zone while the price violates the dynamic 20 EMA multiple times. As the most recent price is punitive within the bearish channel, buying pressure with a bullish structure break can grab buyers’ attention.
The trading approach in CADJPY depends on how the price trades at the 91.43 static level, where any bearish rejection might extend the bearish channel towards the 88.50 area. On the other hand, a bullish daily candle above 91.43 would alter the current market structure where the primary aim for bulls is to test the 94.02 level, which is the 161.8% Fibonacci Extension of the recent bearish correction.
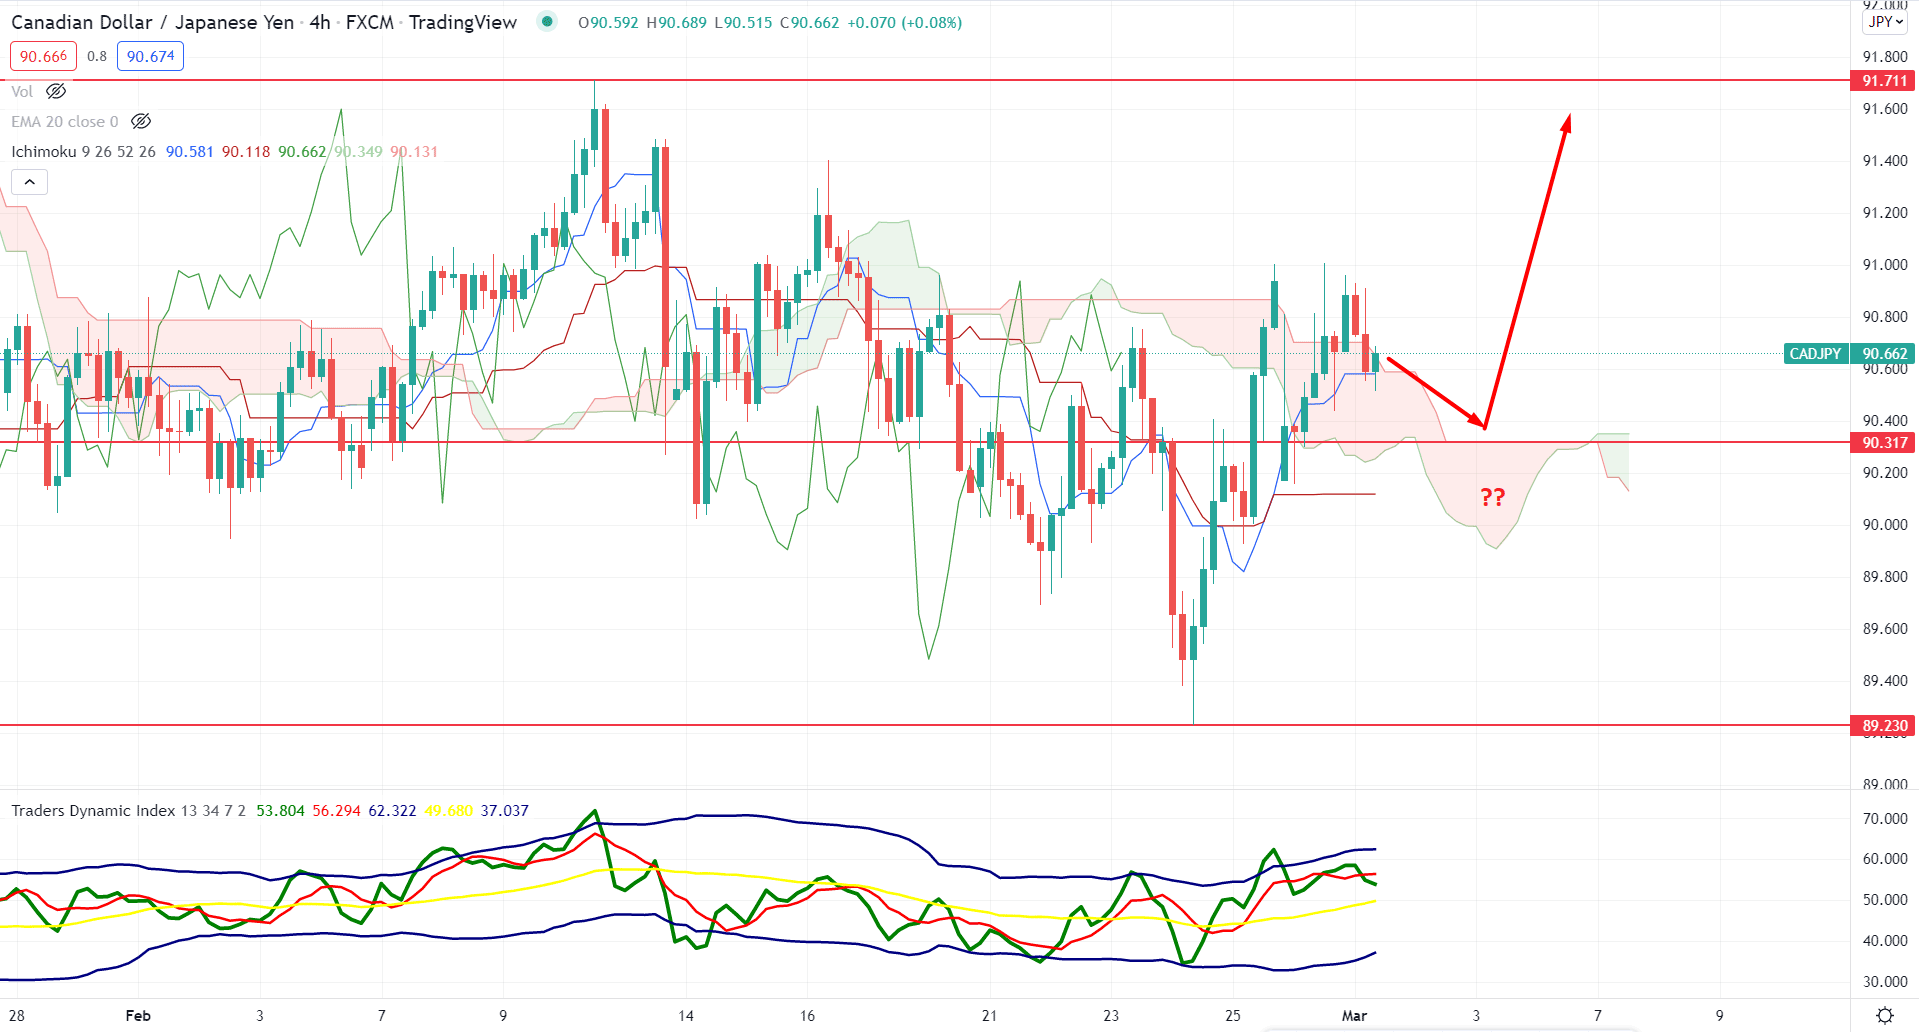
According to the Ichimoku Cloud, the broader market direction for the CADJPY H4 chart is indecisive as the recent price moved above the Cloud resistance but failed to hold the momentum. In that case, investors should pay close attention to the near-term price chart where any buying sign from the 90.31 support level would take the price up.
The above image shows how dynamic Tenkan Sen and Kijun Sen are bullish, followed by the buying sentiment in the future cloud. Meanwhile, the Traders Dynamic Index (TDI) moved above the 50 level and hovered at the upper band. It is a sign that the average traders' interest is taking bullish trades in this pair, intending to test the 70 level in TDI.
In this context, the primary approach is to find buying opportunities from the 90.60 to 90.30 area, from where a bullish H4 candle may take the price higher towards the 91.71 level. On the other hand, a break below the dynamic Kijun Sen with a bearish H4 candle would increase the bearish possibility towards the 89.20 support level.
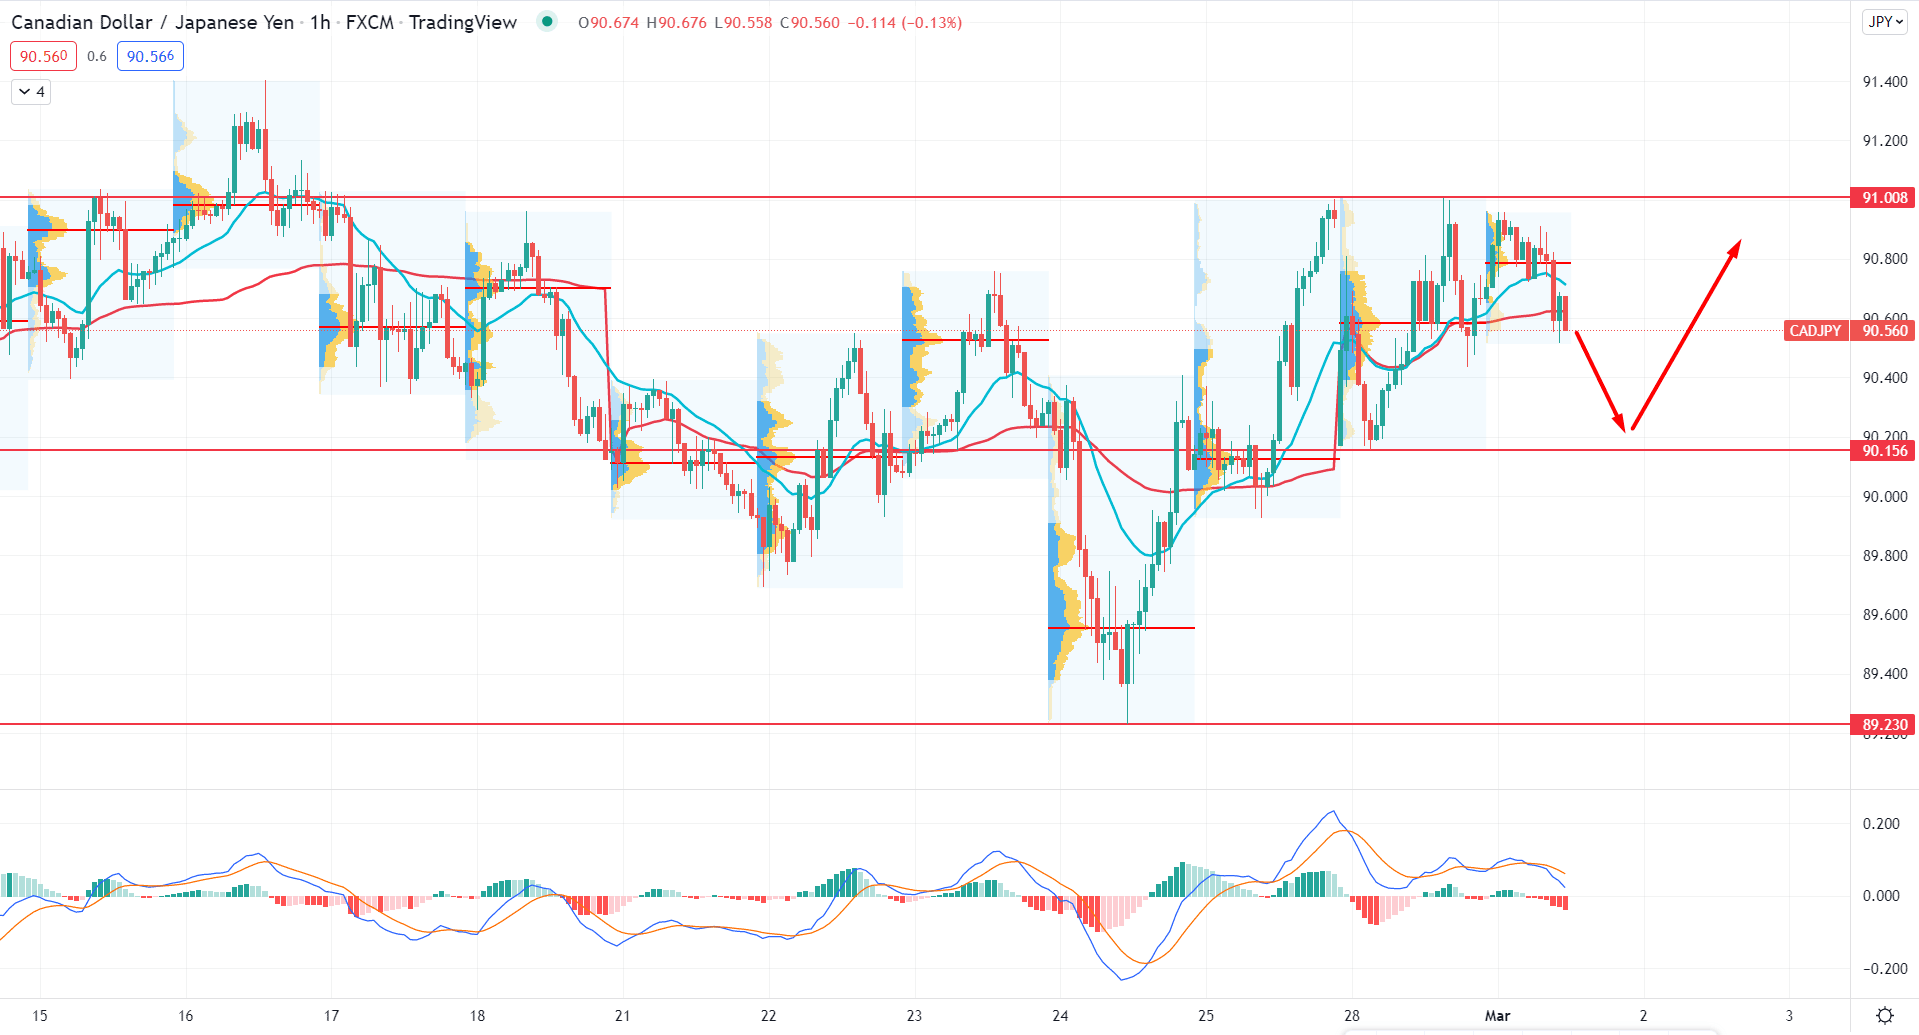
In the intraday chart, CADJPY is trading within a corrective momentum where the highest volume is above the price. Therefore, buyers’ failure to break the 91.00 resistance level is the primary barrier for taking a long position in this pair.
The above image shows how the MACD Histogram turned bearish with a solid selling pressure while the price remained stable below the dynamic 20 EMA. In that case, the selling pressure from the 91.00 level may extend towards the 90.15 level from where bulls may regain momentum. In that case, any rebound with a bullish H1 close above the dynamic weekly VWAP would be the most reliable buying opportunity in this pair.
As per the current market context, investors should closely monitor how the BoC interest rate decision comes where the current expectation is positive for the CAD. In that case, a rate hike and a bullish daily candle above the Channel resistance might increase the CADJPY price higher towards the 94.00 area.