
Published: October 1st, 2020
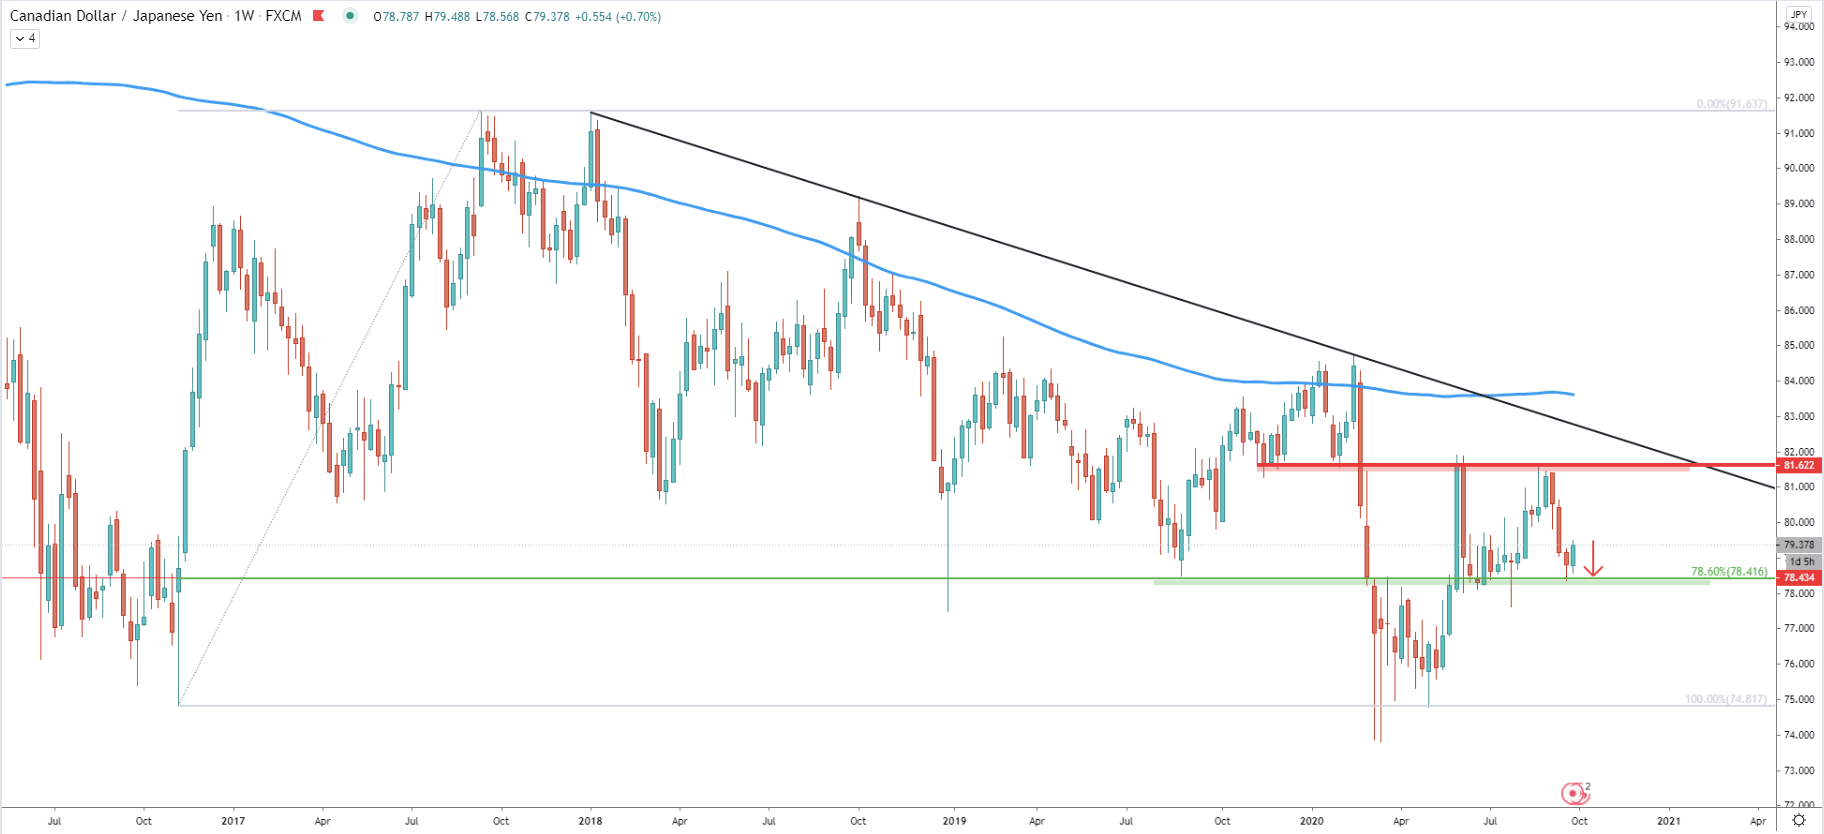
CAD/JPY trend remains bearish as the price continues to produce lower lows and lower highs. Based on the previous supply/demand zone, it can be said that the key long term resistance is at 81.62. On the other side, based on the 78.6% Fibonacci retracement level, the support is located at 78.41. Based on the following charts, the tendency remains bearish, and at this stage, it would be reasonable to assume that CAD/JPY might re-test the 78.41 support in a very short period of time.
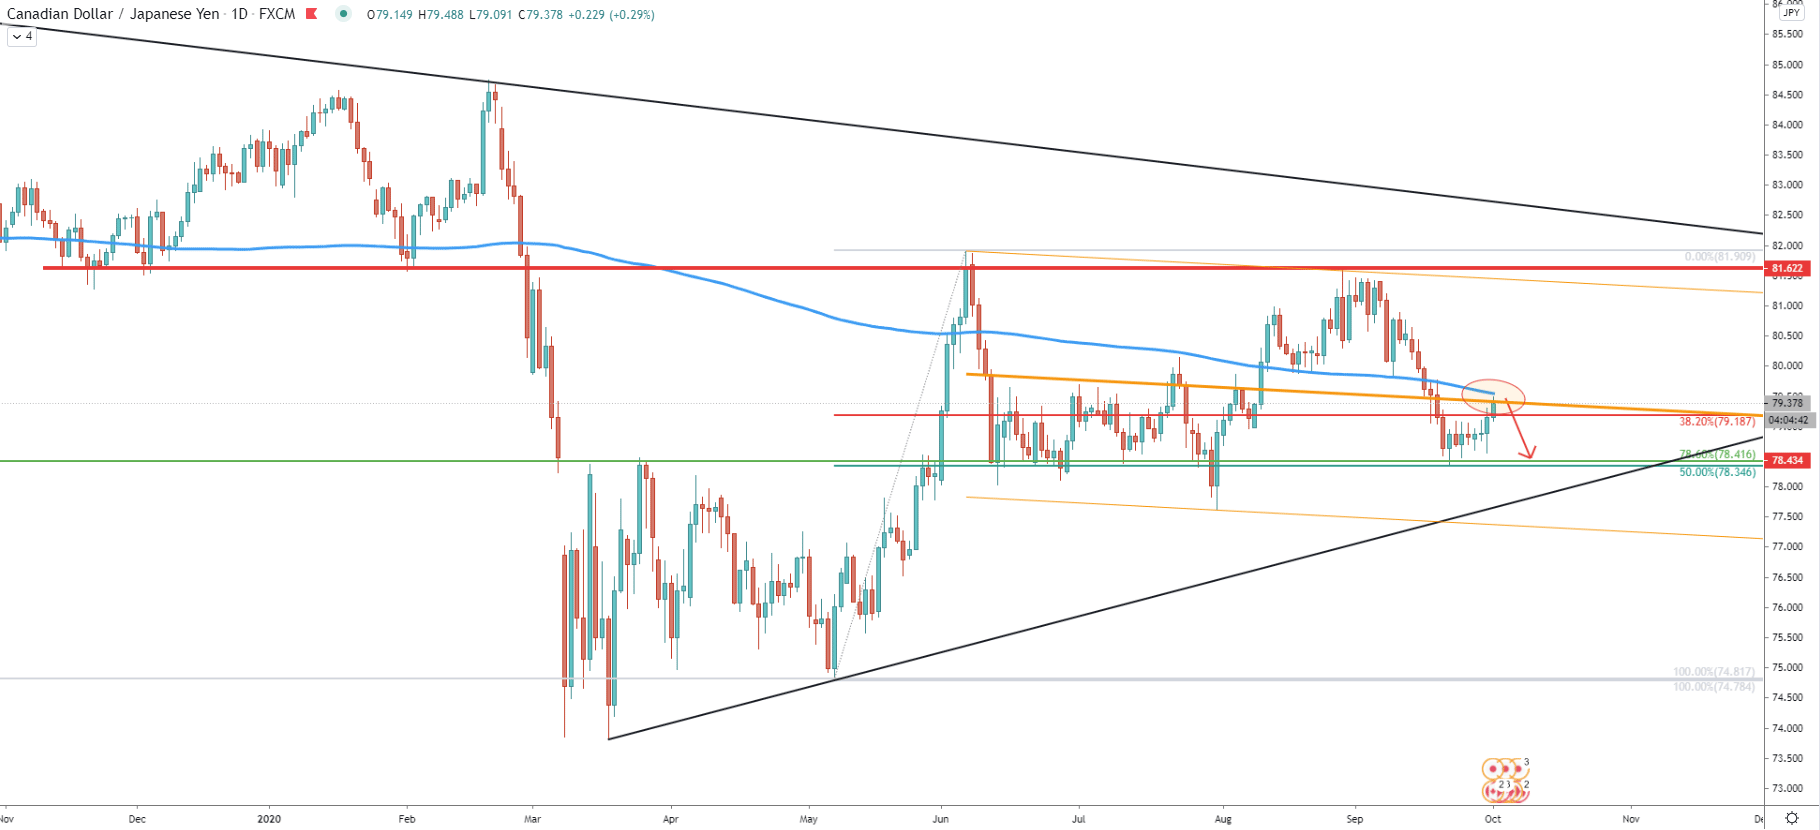
On the daily chart, today CAD/JPY has rejected the middle trendline of the descending channel as well as the 50 Exponential Moving Average. This might result in the increased selling pressure thought this and next week, but only as long as the price remains below the 50 EMA. The support on this chart is now confirmed by two Fibs, 78.6% as per the Weekly chart, and 50% Fibs applied to the last upswing occurred back in May.
In June, CAD/JPY broke below the downtrend trendline as well as the 200 EMA. The breakout point was at 79.46, which currently is acting as the resistance. This resistance also corresponds to the 127.2% Fibs, applied to the corrective wave up, after the breakout of the ascending channel. This makes 79.52 a key resistance to watch because as long as daily closing prices remain below, downtrend continuation should be expected. The downside target at 78.44 on this chart is now confirmed by a third Fibonacci retracement level, which is 227.2% as per the 16-hour chart.
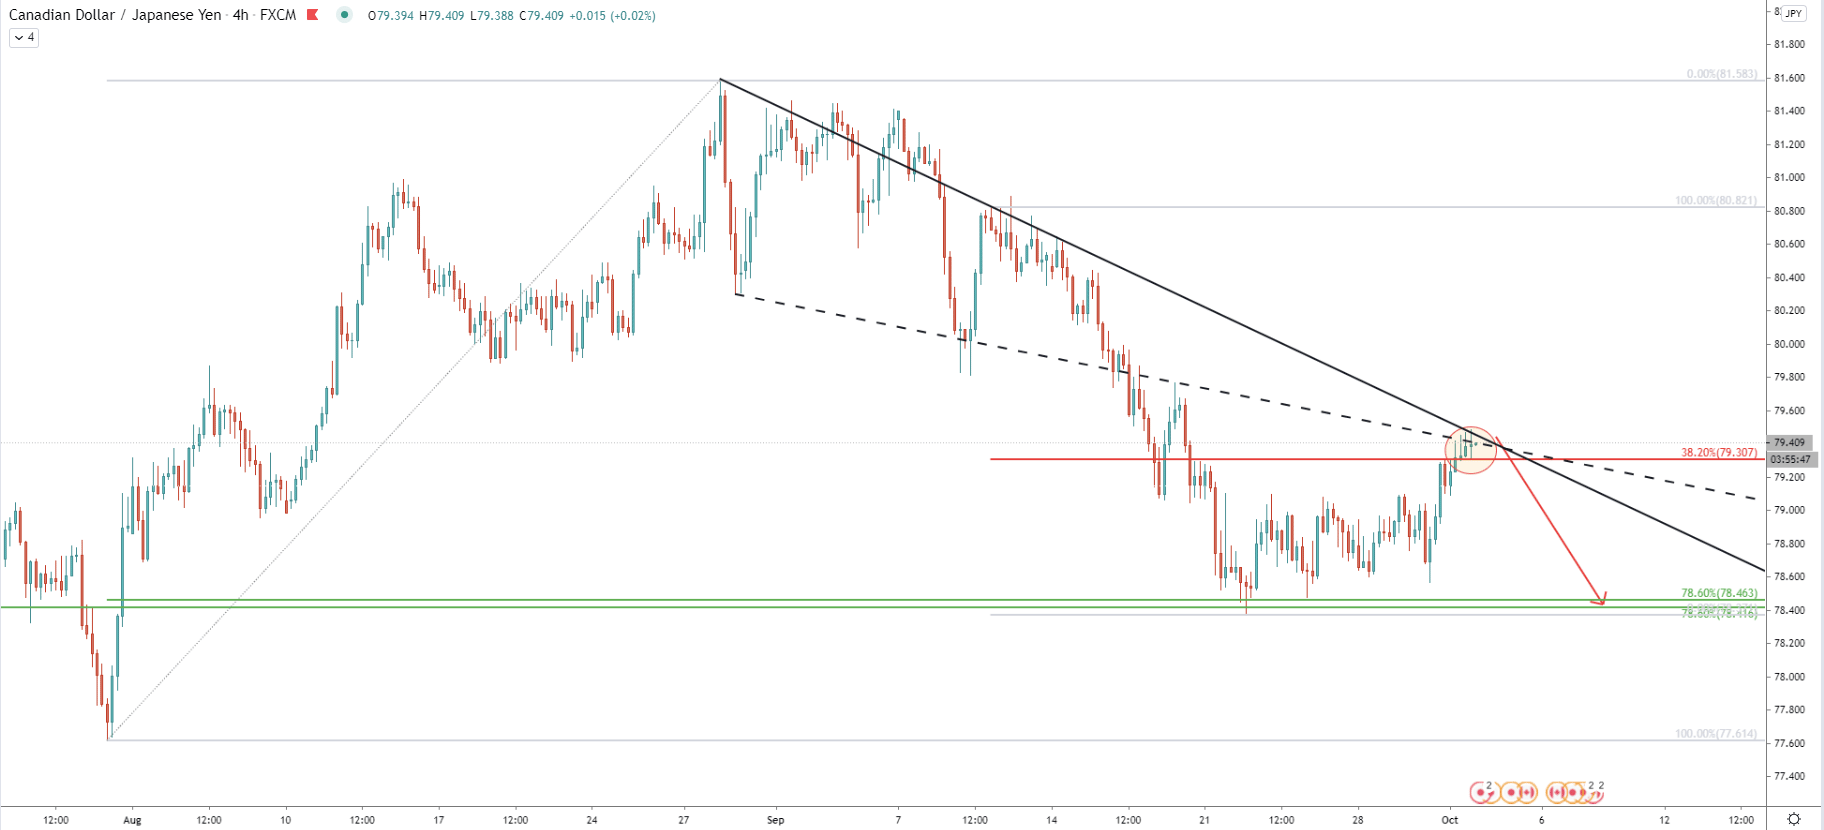
The downtrend trendline along with the average-price downtrend trendline was rejected today. At the same time, 38.2% Fibs at 79.30 were also rejected, as only spikes were produced without a clean break and close above. Now there is a resistance area between 79.30 and 79.52, which is likely to be very attractive for sellers.
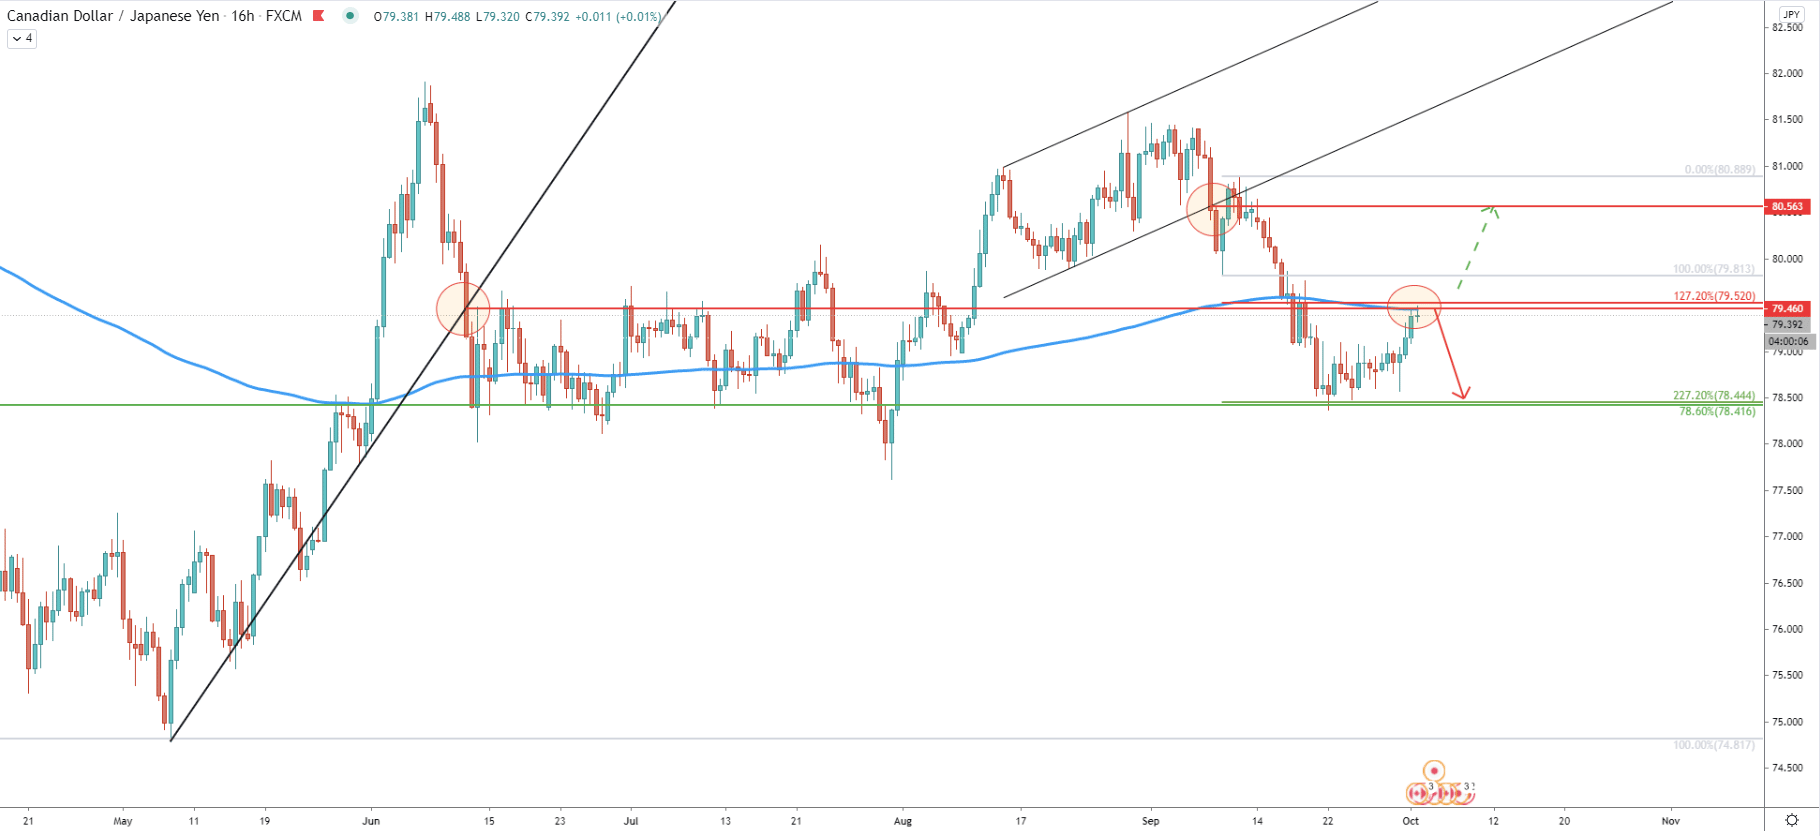
Yet another Fibonacci retracement indicator was applied to the August-September uptrend. It shows that 78.6% Fibs almost exactly corresponds to the previously mentioned support near 78.46.
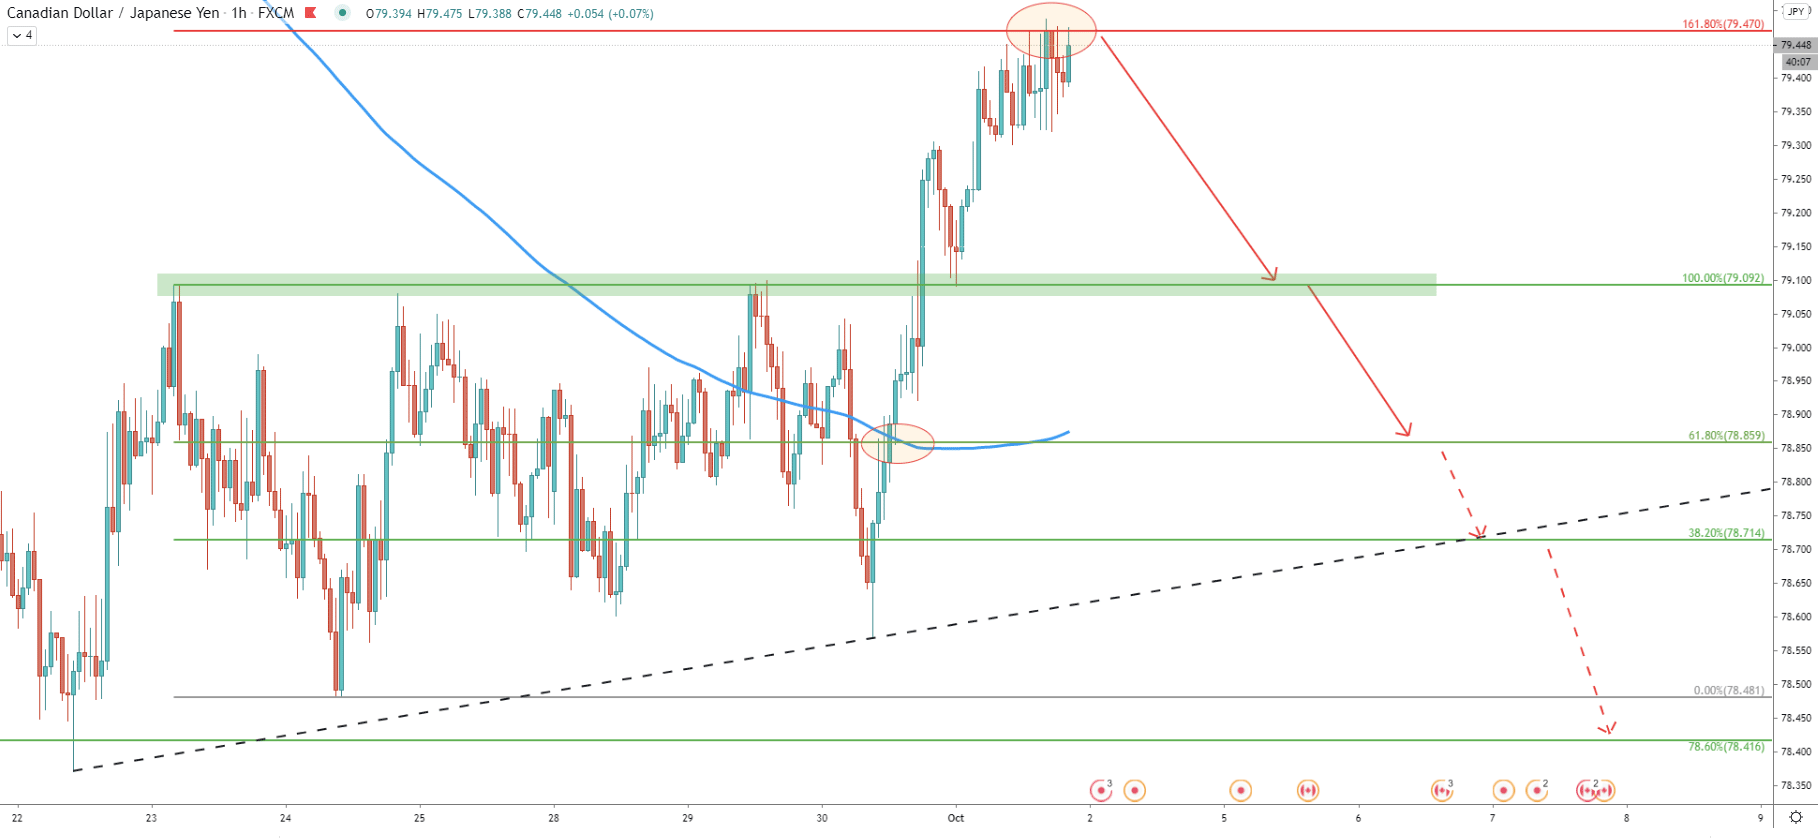
Today CAD/JPY has reached and rejected 161.8% Fibs applied to the corrective move down after the pair bottomed out. This resistance at 79.47 has been rejected cleanly, but then price produced a spike higher. Nonetheless, there was no 1h closing price above the 79.47, which makes the Fibonacci resistance valid. Perhaps CAD/JPY is at the very top and the downside move is just around the corner.
CAD/JPY has rejected multiple resistance indicators today, which might suggest that sellers will be stepping in, resulting in the price decline this or early next week.
There are multiple support levels to watch as per the 1-hour chart. The first is at 79.09, corresponding to the previous supply zone. Next is the 78.85, corresponding to the 200 EMA breakout point as well as the 61.8% Fibonacci retracement level. Then comes the 38.2% Fibs at 78.71, corresponding to the simple uptrend trendline. And finally, 78.41, which has been confirmed 4 different Fibonacci retracement levels.
As per the 16-hour chart, break and close above 78.52 will invalidate the bearish forecast, and CAD/JPY could be starting to move north, potentially to test the 80.56 resistance level.
Support: 79.09, 78.85, 78.71, 78.44
Resistance: 79.52, 80.56