
Published: October 26th, 2020
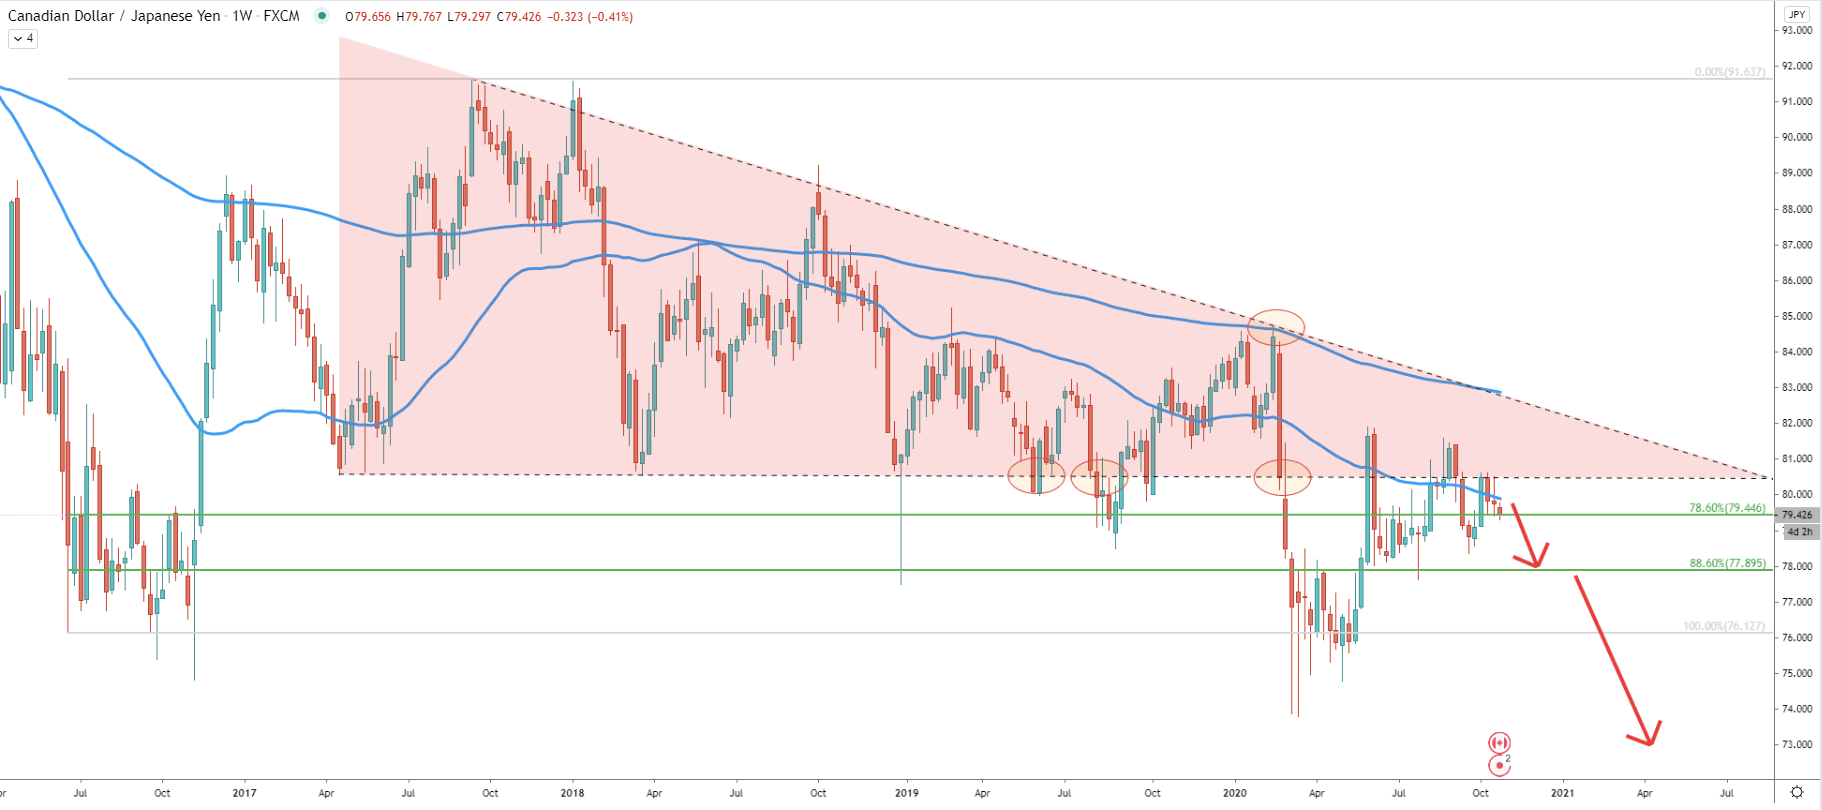
The weekly chart clearly shows a bearish pattern where lower lows and lower highs are being printed. Previously there was very strong support formed near 80.00 physiological level. It has been rejected multiple times throughout 2017 - 2020 showing the importance of this demand area. Although at the beginning of the 2020 CAD/JPY cleanly rejected the 200 Exponential Moving Average after which it went down extremely fast breaking below the 80.00 support.
The correction up followed and during the past 3 weeks price has been trading near 80.00, which this time could be acting as the supply area. Considering the fact that 50 EMA was rejected about a month ago, and currently rejecting 80.00 resistance, the price could be getting ready to produce another strong downside move.
However, the nearest support could be located near the 78.00 psychological level, which is confirmed by the 88.6% Fibonacci retracement level. Obviously, this might be the first target for the sellers and should be watched for either a break below or rejection if/when the price will get there.
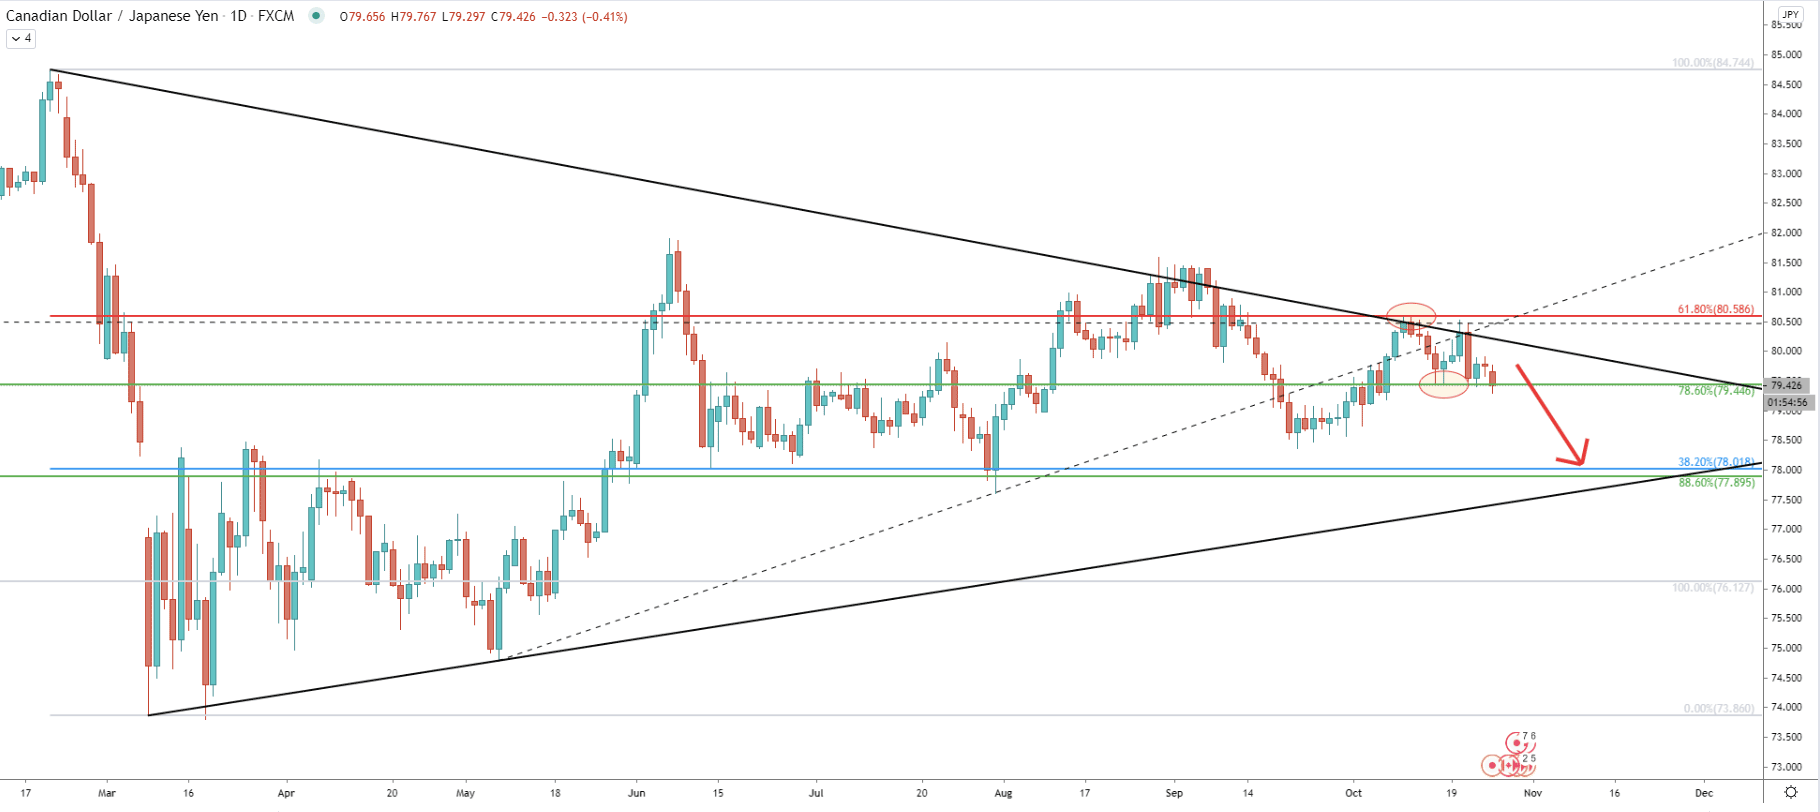
On October 9 CAD/JPY has reached and cleanly rejected the 61.8% Fibonacci retracement level at 80.58. Simultaneously the downtrend trendline was also rejected after which the price went down and found support at 79.44, which is 78.6% Fibs. Small pullback followed, and this time price bounced off the uptrend trendline which has been previously broken and acted as the resistance.
Today it can be seen that the 79.44 support level is being broken, but it could be important to see the daily close below this level in order to get an extra confirmation of the bearish trend. The downside target is now confirmed by two Fibs, 88.6% as per the weekly chart, and 38.2% Fibs right at the 78.00 psychological support.
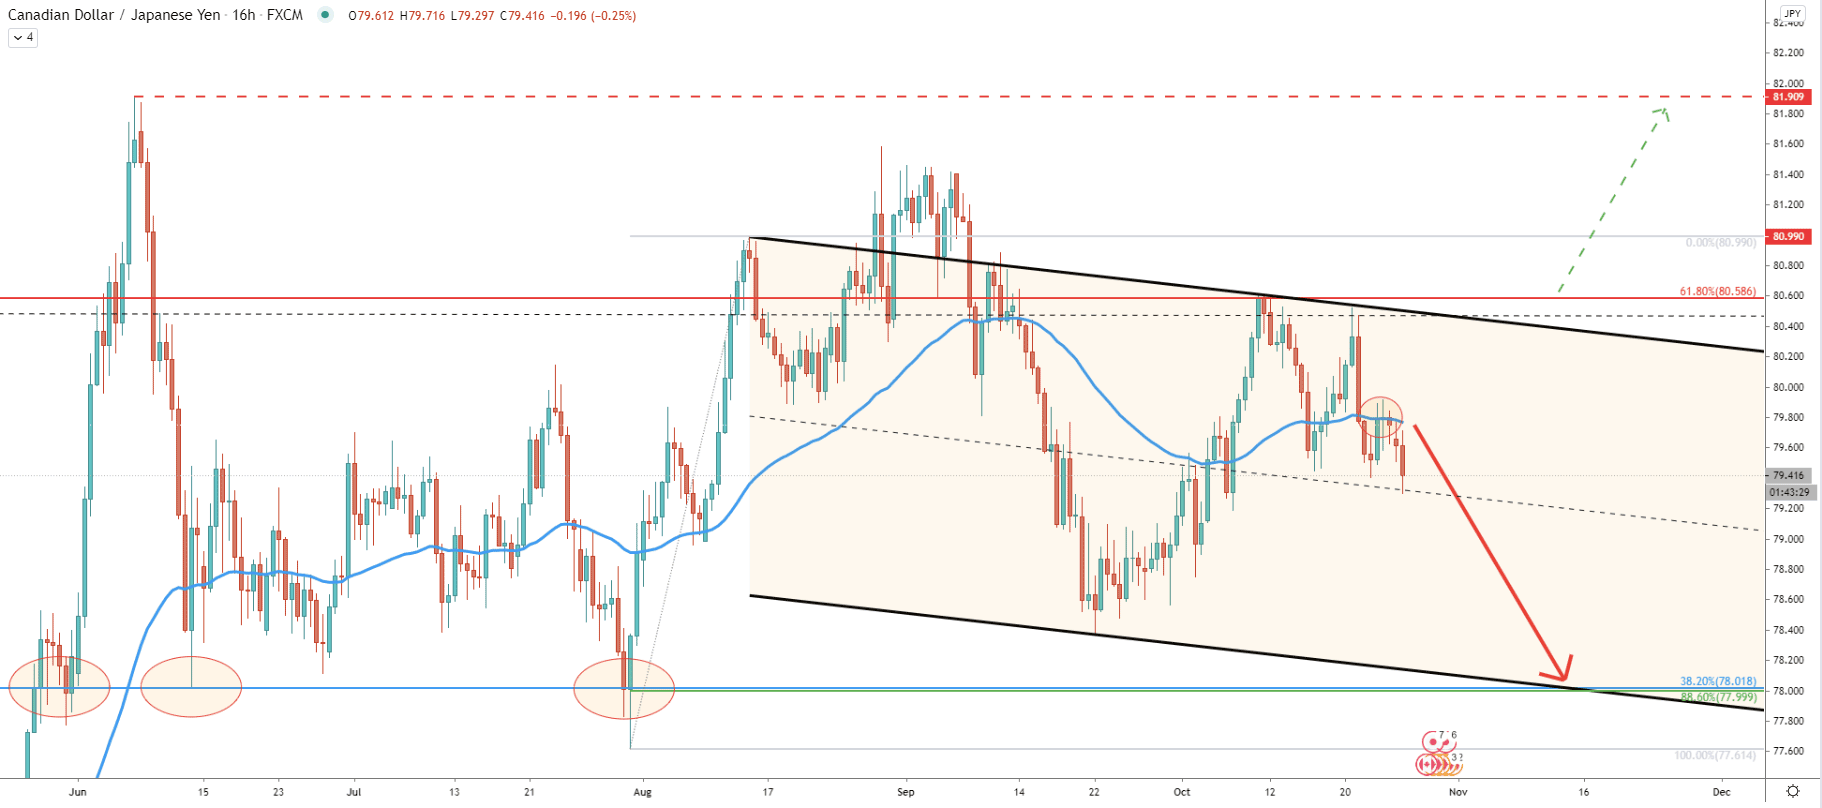
Today there was a rejection of the 50 Exponential Moving Average after which a lower low had been produced. At the same time price continues to trade within the descending channel, where the bottom of the channel corresponds almost exactly to the 78.00 support area. As can be seen, previously 78.00 was rejected multiple times, suggesting that there will be some buying pressure if the price will decline towards this area.
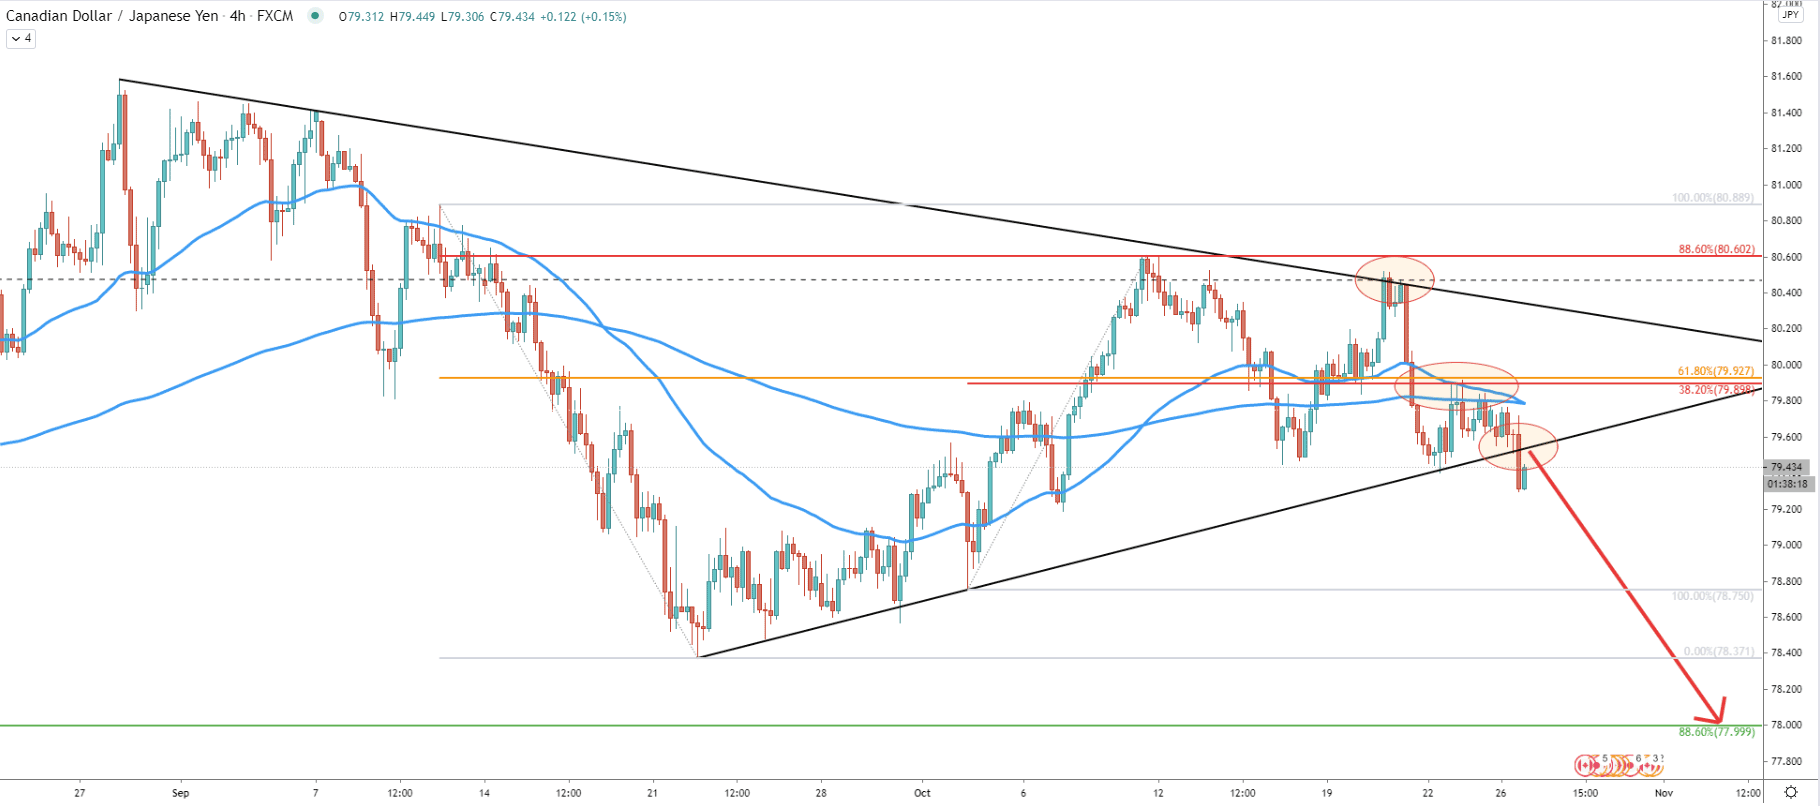
On the 4-hour chart yet another downtrend trendline was applied. On October 21 there was a rejection of it after which the price dropped fast. It found support at the uptrend trendline and on a small pullback rejected the 79.90 resistance area. This resistance is confirmed by 61.8% and 38.2% Fibonacci retracement level as well as the 50 and 200 Exponential Moving Average. This just emphasizes the importance of the 80.00 supply area and shows that bears are still defending it strongly.
Today there was a break and close below the downtrend trendline, which could be a strong sell signal for bears. This might suggest the beginning of the downside move, which can continue at any moment.
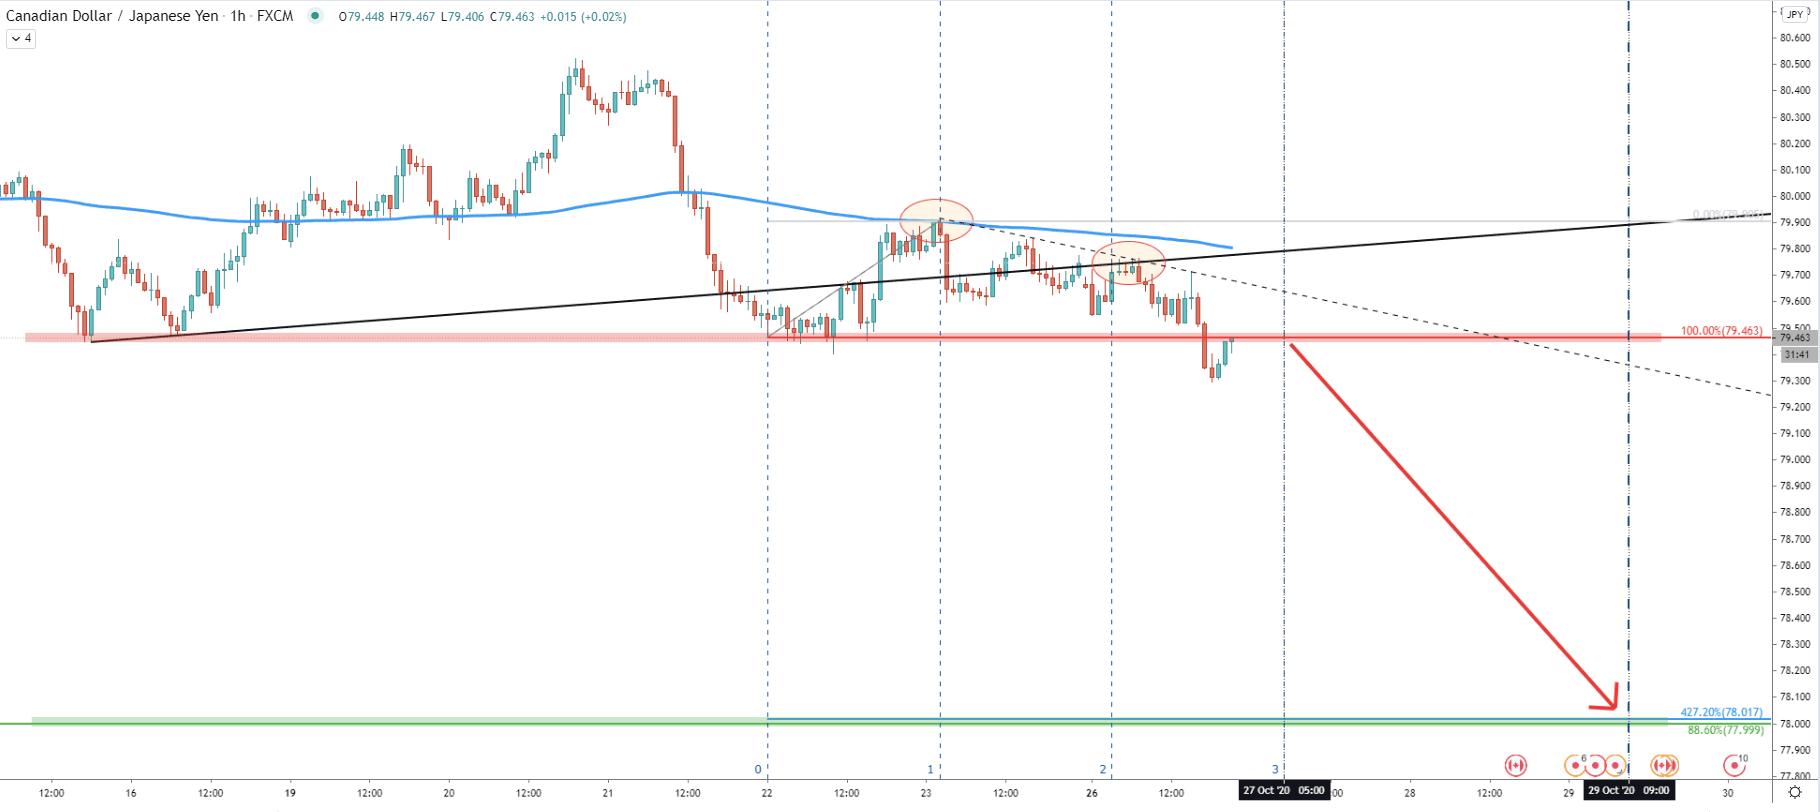
The hourly chart also shows the precise rejection of the 200 Exponential Moving Average, followed by rejection of the downtrend trendline. The 76.46 support level has been broken and right now is acting as the resistance. Fibonacci cycles suggest that the next bearish cycle could be starting early morning on October 27 and might be ending on October 29. It means that trend will be relatively fast and can take only a few days for the price to test the 78.00 support level. Also, this support is now confirmed by 427.2% Fibs applied to the corrective move up where 200 EMA got rejected.
Technically speaking the CAD/JPY downtrend could have started as there are multiple confirmations for such a scenario. It is expected to be a fast price decline, of 150 pips which might take only 48 hours.
As per the weekly, daily, 16-hour, and 1-hour charts, the key support area, and potential demand zone is located near the 78.00 psychological level and is confirmed by 4 different Fibonacci retracement levels as well as the bottom of the descending channel.
As per the 16-hour chart, only daily break and close above 80.60 resistance will invalidate the bearish forecast. Then and only then price can be expected to continue rising, potentially towards the 81.90 resistance area.
Support: 79.44, 78.00
Resistance: 79.44, 79.92, 80.60