
Published: December 9th, 2020
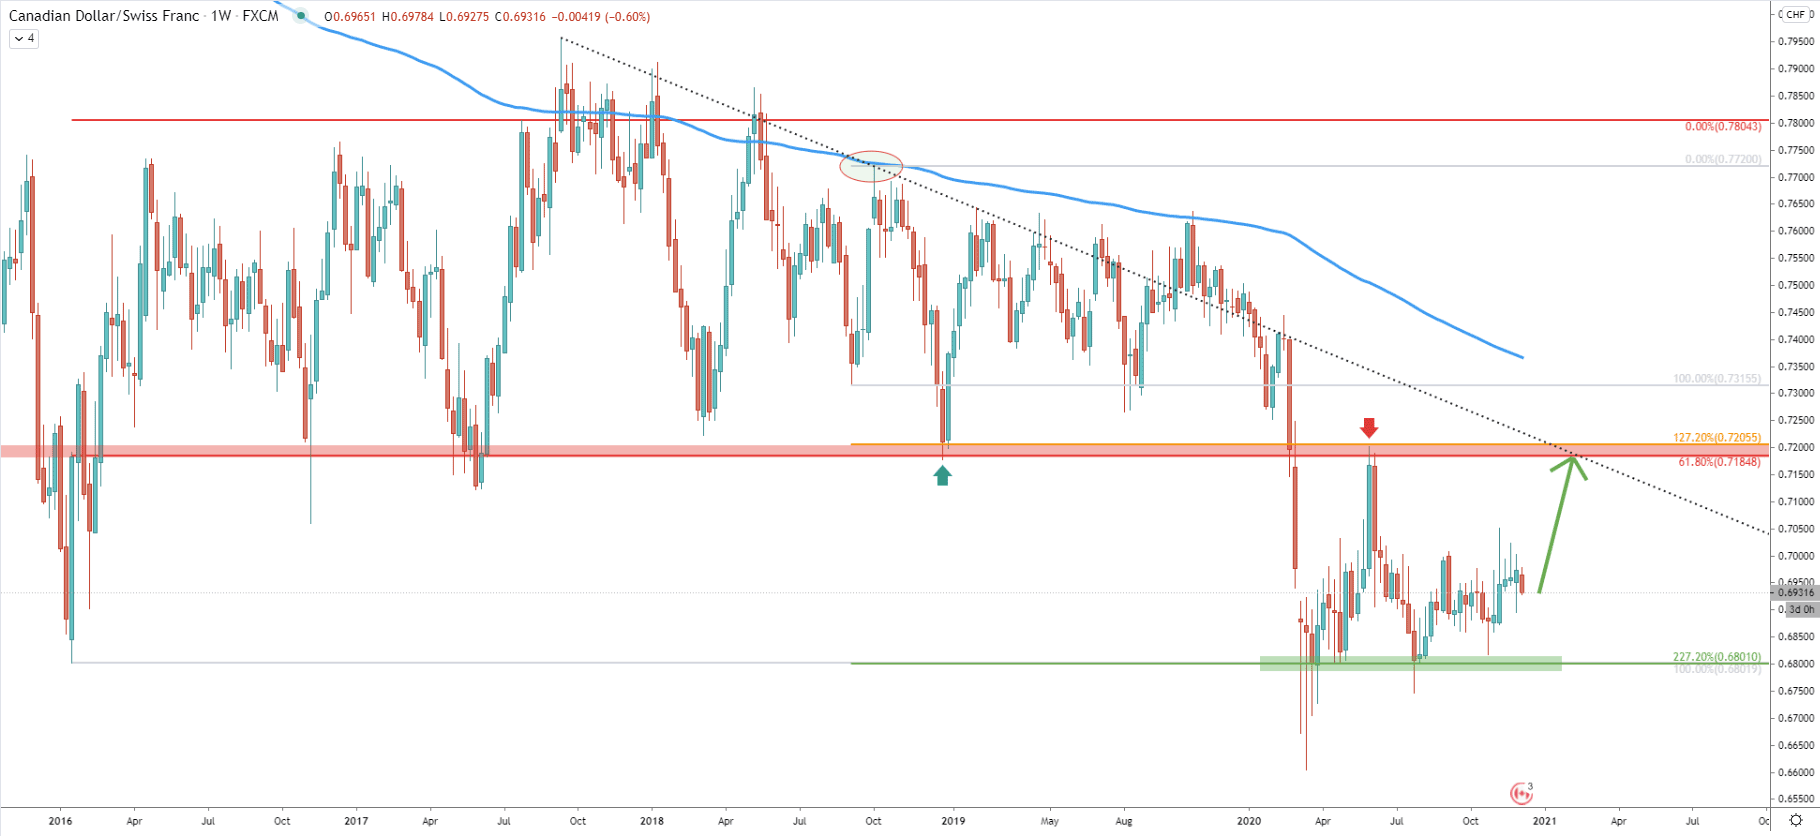
Starting off with the weekly chart, it can be seen that the price is stuck between two key levels. First, is the support at 0.6800 psychological price, which is confirmed by 227.2% Fibonacci retracement applied to the corrective wave up where price rejected the 50 Exponential Moving AVerage at the end of 2019. The resistance is located near 0.7200, which is also a psychological level, confirmed by two Fibs, 127.2%, and 61.8% as can be seen on the chart.
Considering multiple bounces off the 0.6800 support area, CAD/CHF might be preparing or an upside move towards the 0.7200 resistance. It could be a fast move, but at the same time, it could take several months, based on the downtrend trendline and the 61.8% Fibonacci crossing time. But let’s move to lower timeframes to get a better understanding of the current price action.
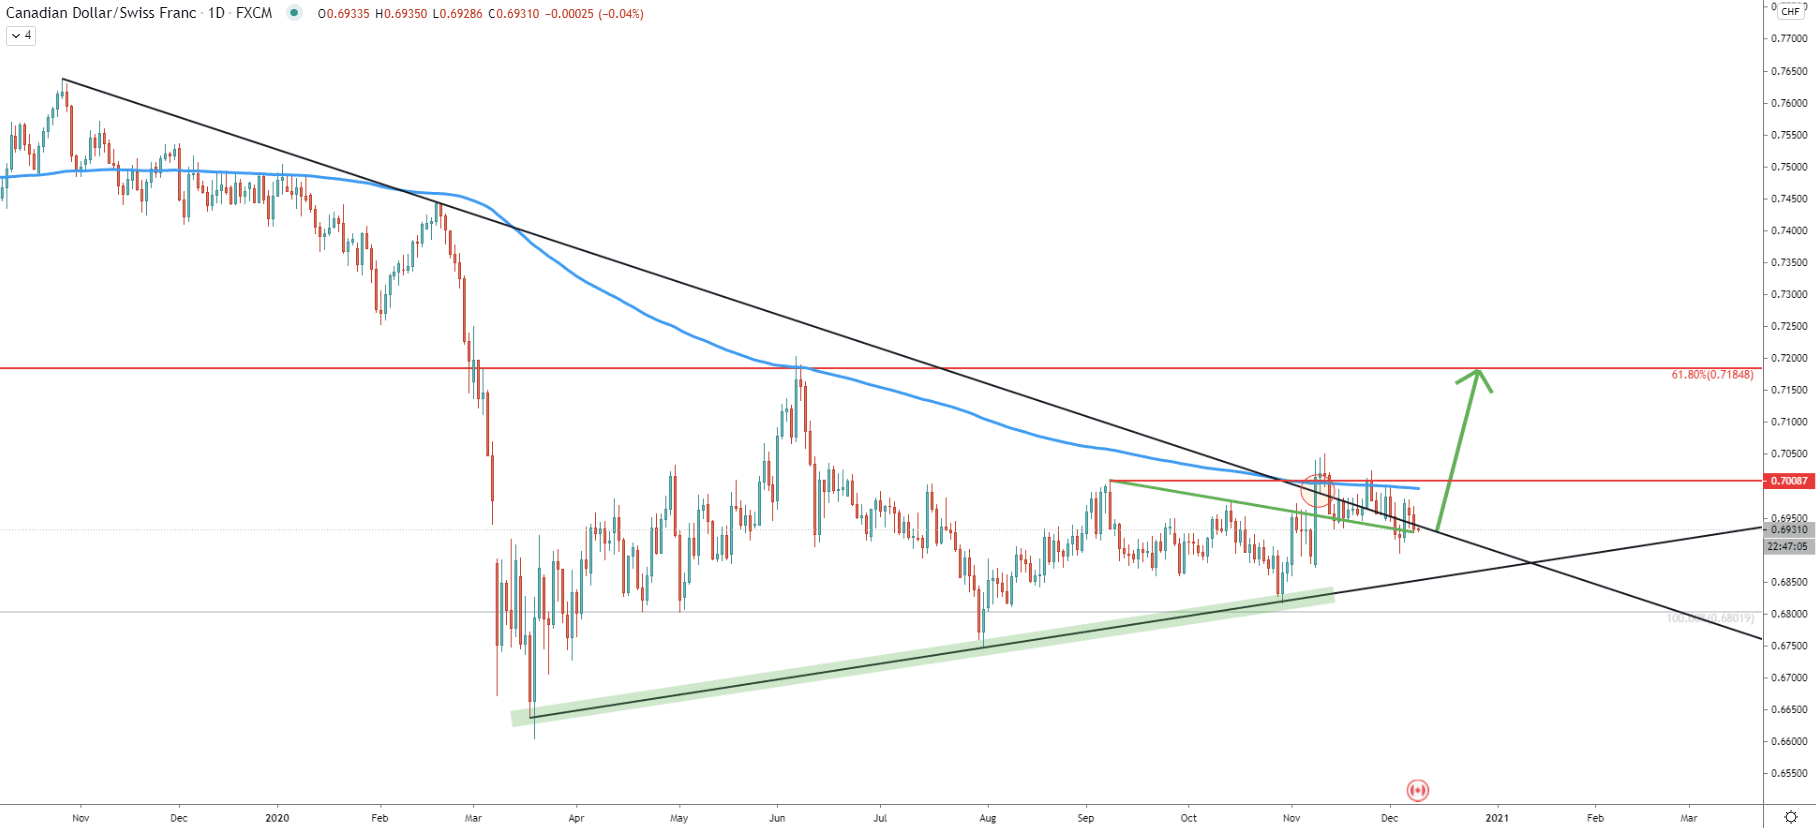
The daily chart goes to show that the simple uptrend trendline was rejected back in November this year. After the rejection of the trendline, the price went up and broke multiple resistances. These are, the short term downtrend trendline, the long term downtrend trendline, the 200 Exponential Moving Average and finally, CAD/CHF broke the previously established high at 0.7008. All these facts can indicate bullish strength in the medium to long term. And perhaps for this reason buyers are currently looking for a good entry point, which will provide a solid risk/reward ratio.
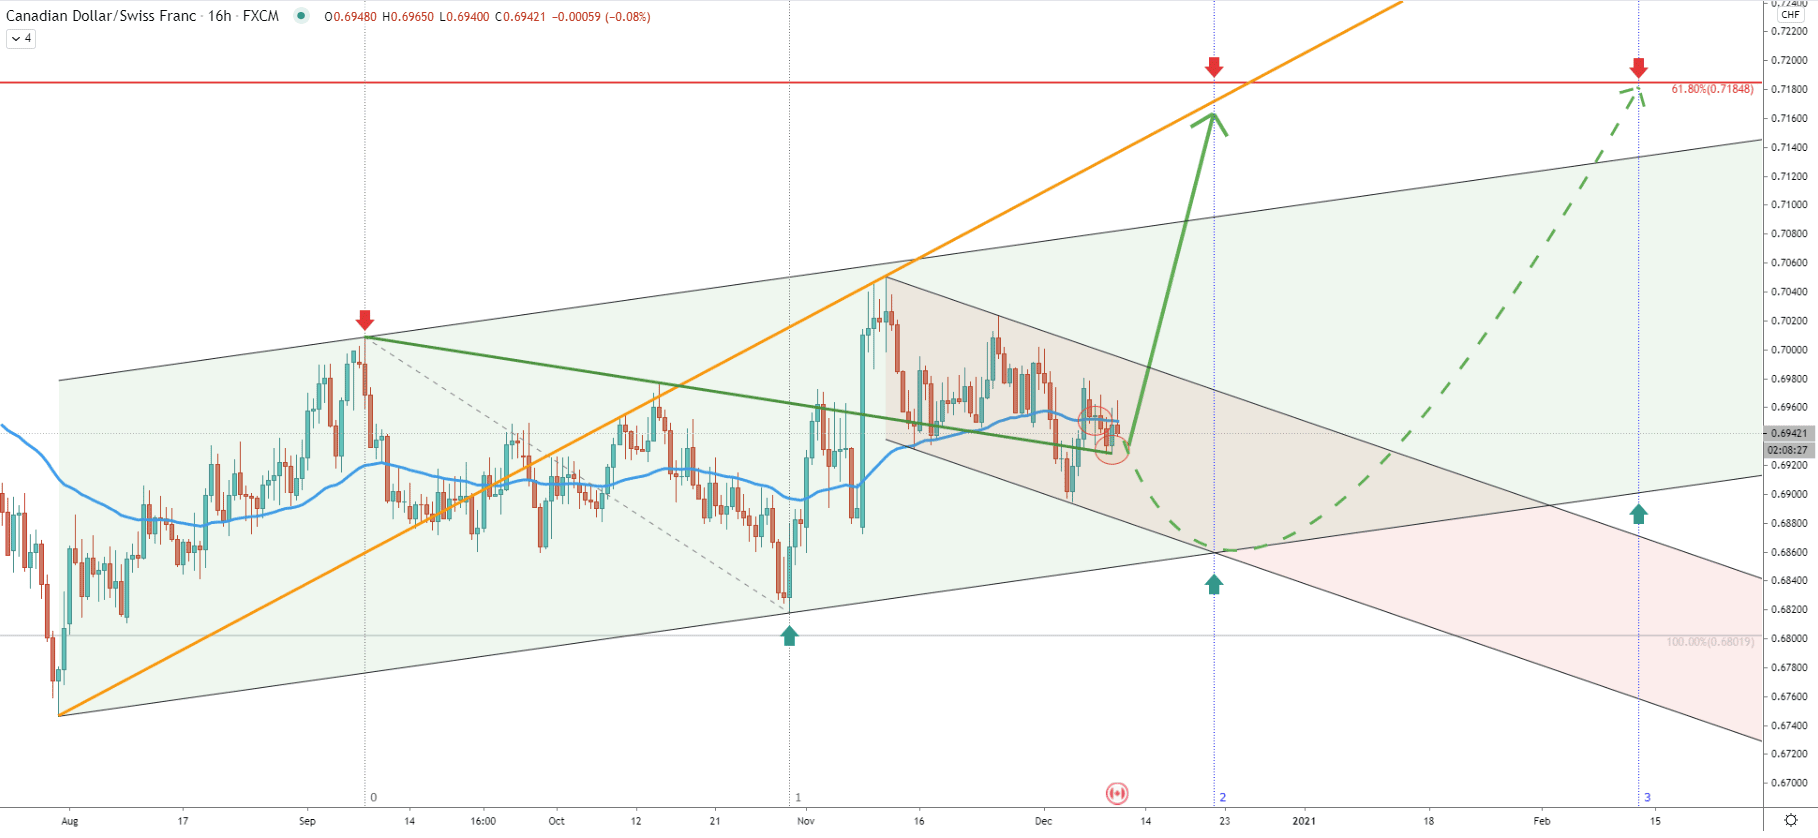
On the 16-hour chart, it is clearly visible that CAD/CHF is trading within the ascending channel. It can also be seen that drawing the last upside wave, the price failed to test or break below the top of the channel, implying that this is likely to occur sometime in the near future. At the same time, CAD/CHF started to produced lower lows and lower highs and currently is moving within the descending channel, which is inside the larget, ascending channel. But in regards to the descending channel, the bottom of it has been tested and rejected, suggesting that the bottom could have been tested.
Right now, CAD/CHF is rejecting the 50 EMA along with the downtrend trendline, which was broken and currently is acting as the support. Therefore, as long as current support holds, CAD/CHF should be expected to continue rising, potentially breaking above the ascending channel and moving towards the 0.7185 - 0.7200 resistance area. This resistance corresponds to the average-price uptrend trendline and based on the Fibonacci cycles could be tested either at the end of this month or in mid-February.
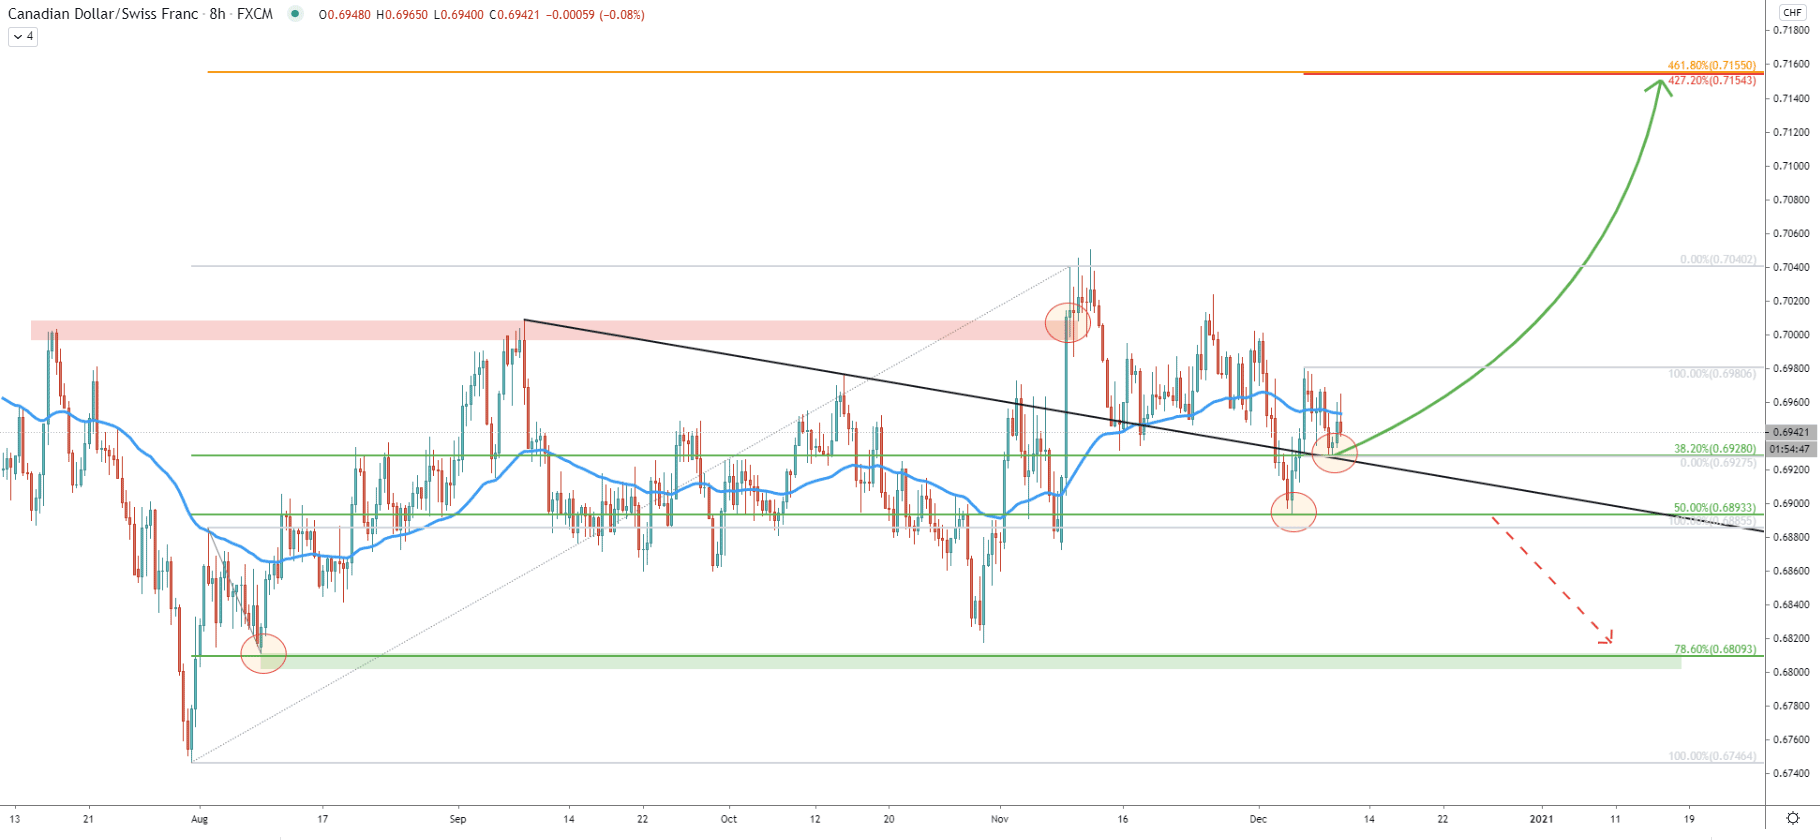
At the beginning of this month, CAD/CHF cleanly rejected the50% Fibonacci support at 0.6893 and went up. This week, the price is rejecting the next Fibonacci support level, which is the 38.2% retracement level at 0.6928. Along with the rejection of the 38.2% Fibs, the price has rejected the downtrend trendline simultaneously, implying strong support located in this area.
Perhaps 0.6893 - 0.6928 can be a strong demand area, where buyers are likely to dominate. Although if the price breaks below this range, there is a good chance taht it will continue moving down.
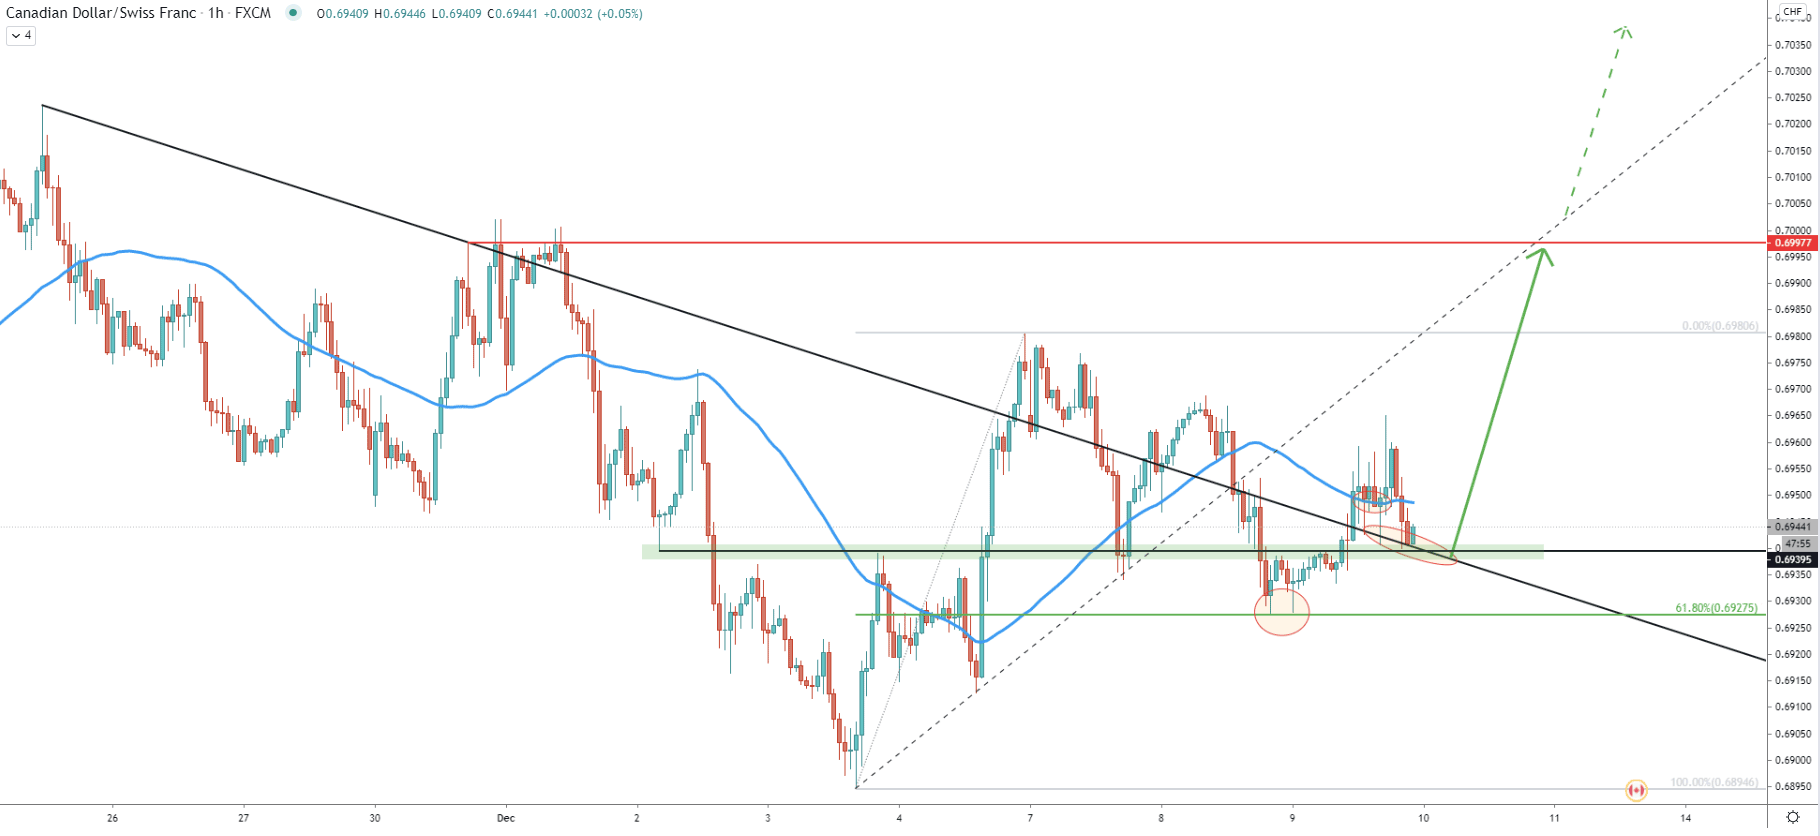
On the hourly chart, the 0.6928 support level as per the 8-hour chart, corresponds to the 61.8% Fibonacci retracement level. This makes it a key demand zone, which still can be re-tested before/if an uptrend will take place. Therefore, while the current price is very attractive in terms of the buying opportunity, CAD/CHF can still move lower, to produce a spike below 0.6928. However, if the current supply zone near 0.6940 holds, then a fast uptrend can be expected. On this chart, the nearest resistance is at 0.7000, which is an extremely strong psychological level, which certainly can provide strong selling pressure for the pair. Nonetheless, if it gets broken, CAD/CHF is highly likely to move towards the 0.7200 key supply zone.
CAD/CHF is currently trading near a strong demand area. This might invite institutional buyers, who are likely to start pushing the price up. If this will be the case, and the support area will continue to be respected, CAD/CHF might rise by 250 pips in the coming weeks.
As per the weekly and 8-hour chart, there are two major resistance levels. The first is at 0.7155, confirmed by two Fibonacci retracement levels. The second is at 0.7200, also confirmed by two Fibs. This makes a potential upside move between 200 and 250 pips.
As per the 8-hour chart, a break below the 0.6893 support will invalidate the bullish forecast. In this case, CAD/CHF should be heading towards the already formed supply area, which is confirmed by 78.6% Fibs and located at 0.6809.
Support: 0.6800, 0.6893, 0.6927,
Resistance: 0.7000, 0.7200