
Published: April 14th, 2020
Across the board, it seems like the Swiss Franc is gaining strength over the long term. The recent correction could be providing strong opportunities for investors as well as traders interested in CHF.
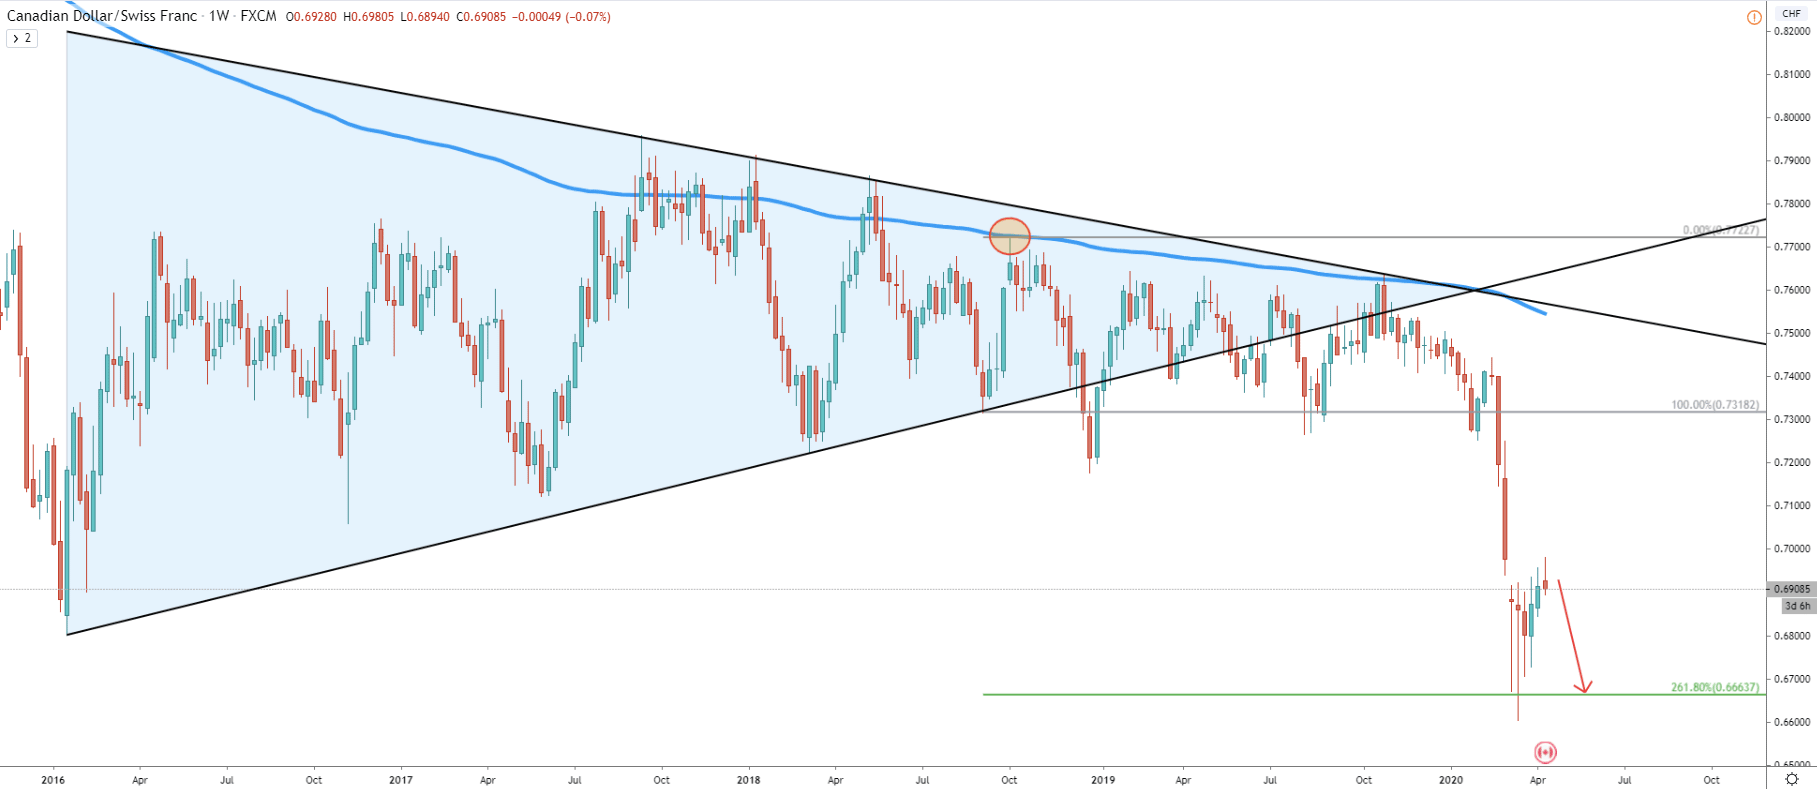
On the Weekly chart price broke below the triangle pattern, confirming the long term bearish sentiment. In fact, CAD/CHF price has dropped significantly over the course of the past 5 months. The last time it rejected the 200 Exponential Moving Average, the price was near 0.7600 level. But if we look at the price now, it is trading at 0.6900 area. This is a significant drop of more than 700 pips, where CHF has gained nearly 10% over the CAD. Clearly, the interest for the Swiss Franc is growing and perhaps in recent turbulent market conditions, it plays the role of a safe-haven.
We are yet to see if the strong downtrend will continue, but for now, we need to focus on the nearest support level. It is seen at 0.6664 and confirmed by 261.8% Fibonacci retracement applied to the corrective wave up, where 200 EMA was rejected cleanly for the first time, which was back in October 2018
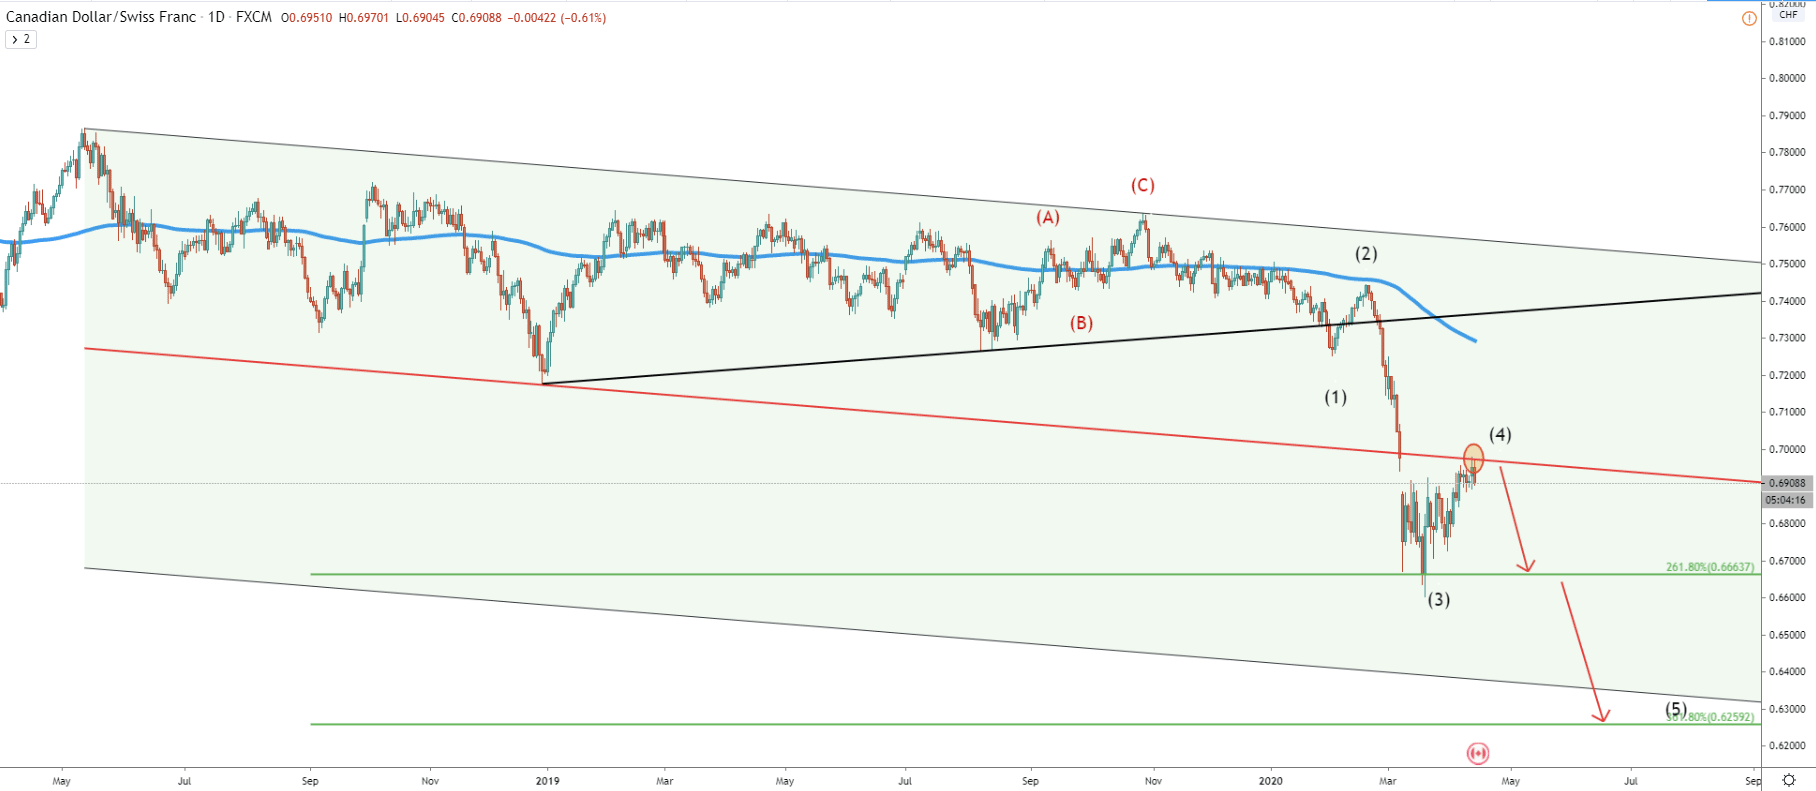
Now moving on to the Daily chart, we have applied the Elliot Wave count. It shows that after the ABC correction to the upside, the price has initiated the downtrend. Currently, CAD/CHF could be about to start the final, 5th wave down. This is expected because of the recent rejection of the middle trendline of the extended descending channel.
As per Fibonacci retracement levels, there are two major support levels to watch. The nearest, where price previously found the support, is located at 261.8% Fibs, which is 0.6664. This price should play a key role in further price action. The rejection is likely to initiate the beginning of a volatile consolidation phase. But on the other hand, the break below could send price further down, towards 261.8% Fibs at 0.6260 level.
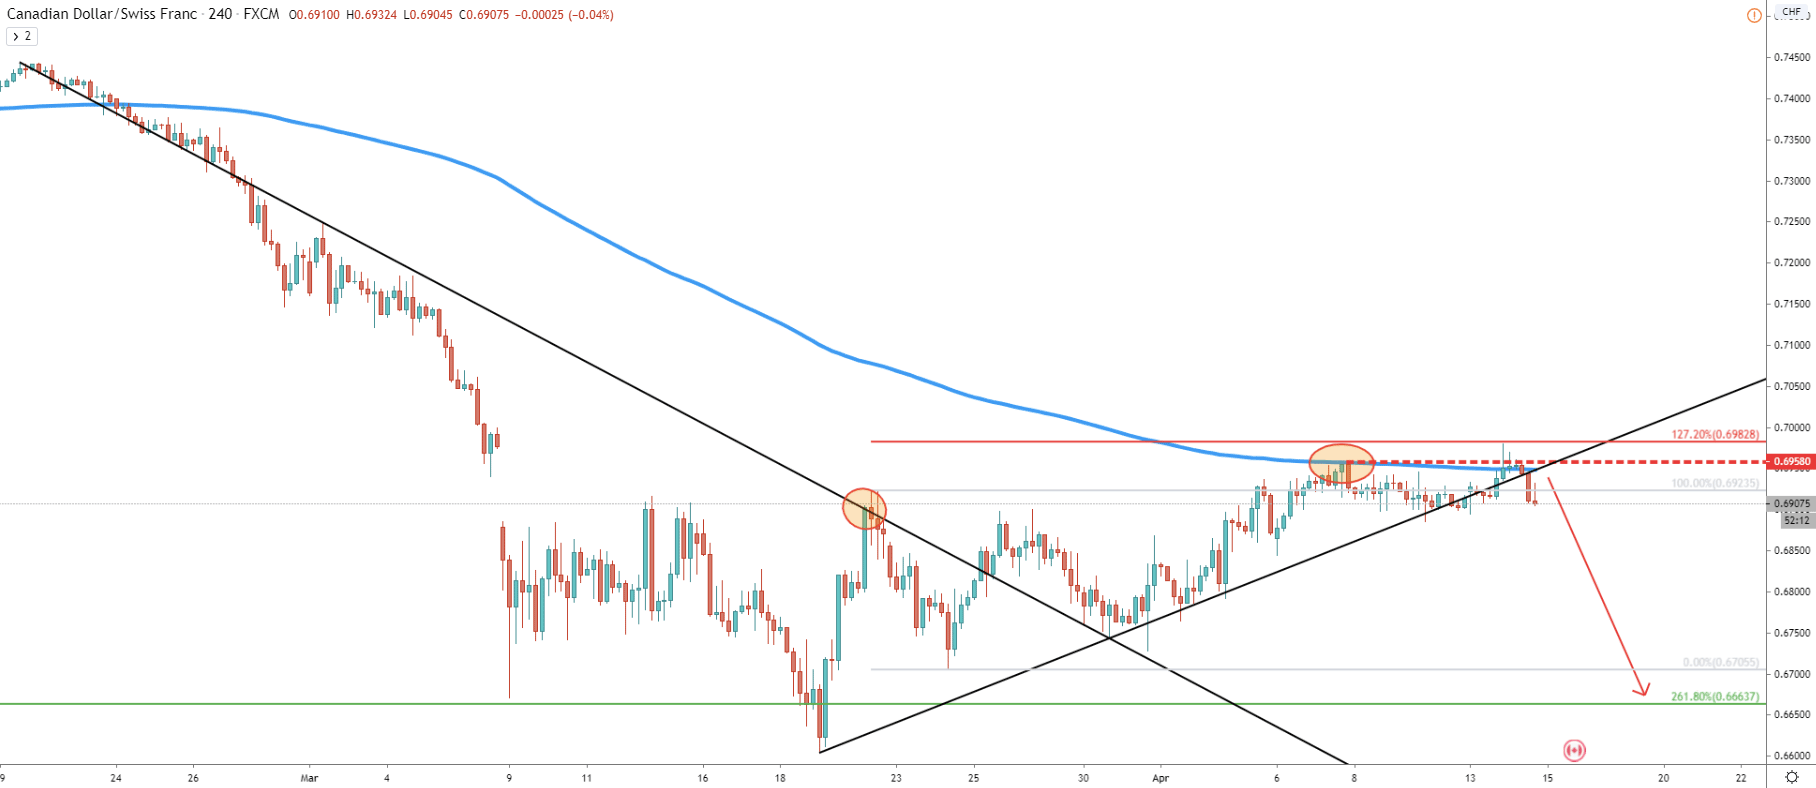
The interesting part gets when we look at the 4H chart, where the price rejected the 200 EMA cleanly on April 7. Yesterday, on April 13, there was an attempt to break above the 0.6958 resistance, although after producing the spike above, the 4H candle failed to close higher. Fibonacci retracement level, applied to the corrective wave down, after breaking the uptrend trendline, shows that 127.2% Fibs at 0.6982 has been rejected cleanly. This goes to show the domination of the selling side, where a strong downtrend could be just around the corner. At the same time, the uptrend trendline has been broken today and such price action gives even more reasons to believe that trend remains heavily bearish.
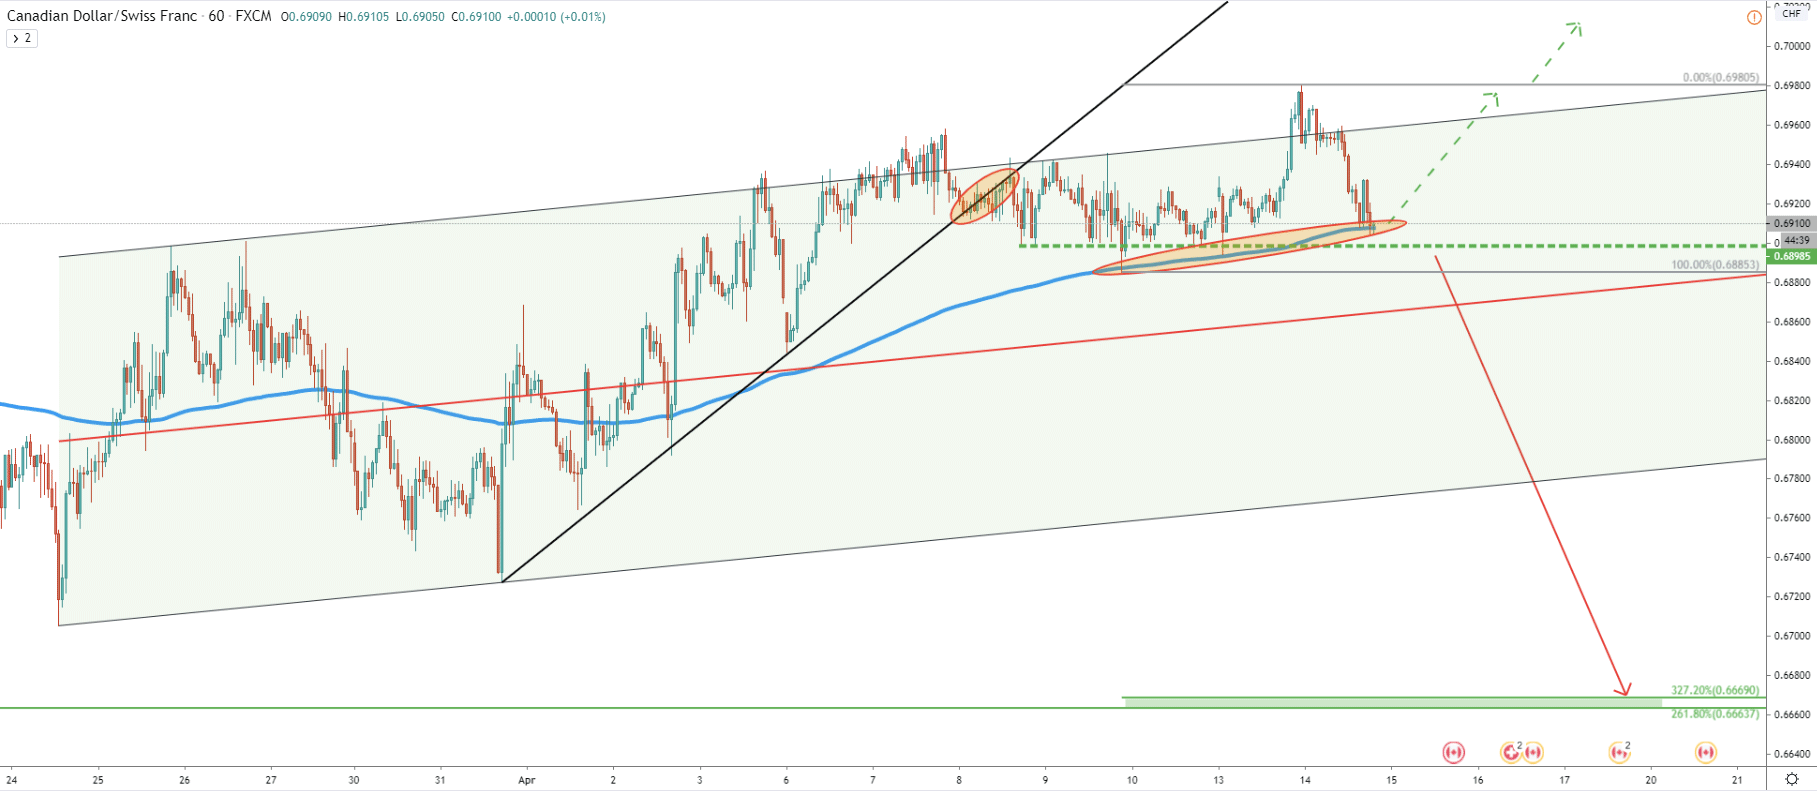
On the 1H chart though, it is a slightly different picture. CAD/CHF broke above the ascending channel but at the same time broke below the uptrend trendline. This means that on the lower timeframes we could see more consolidation going on. Today, the 200 EMA is acting as the key short-term support, which must be broken in order for the price to start moving lower. Therefore, no actions should be taken as long as the price remains between the 0.6885 support and 0.6980 resistance levels.
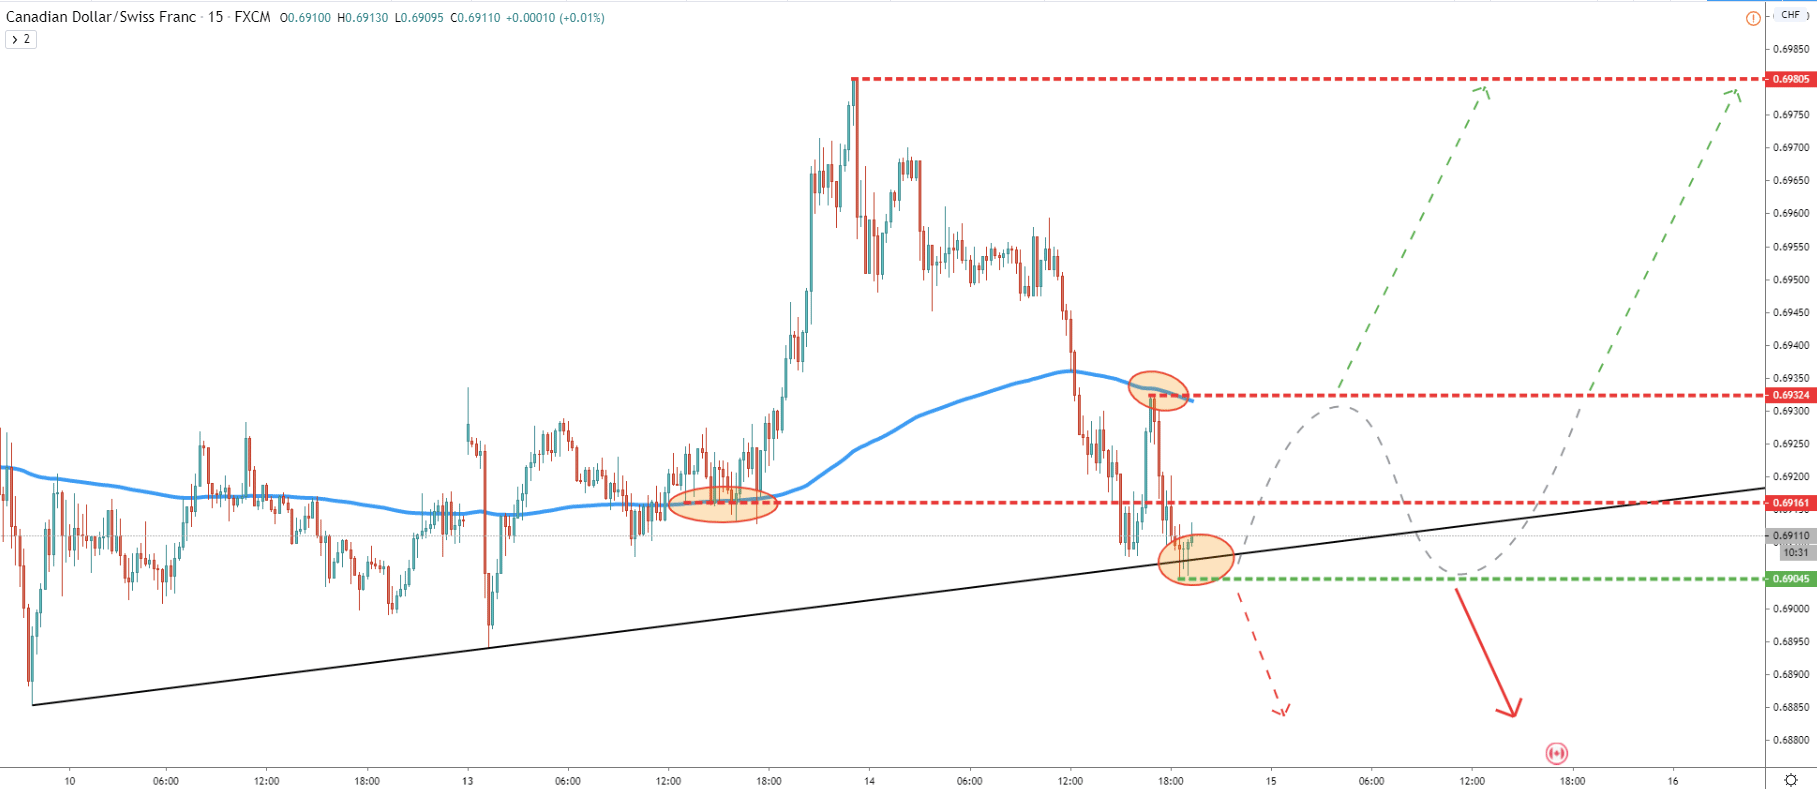
Now it is time to see the 15m chart where the uptrend trendline is still being respected by the market. But there are other factors, which already suggest the bearish sentiment being build up. This is the break below the 0.6916 support, where previously price rejected the 200 EMA. Secondly, the 200 EMA has been broken to the downside, after which, the CAD/CHF corrected up and rejected the 200 EMA.
There is a mixed sentiment on smaller timeframes, but the price is getting ready to make a strong move. As has been mentioned already, it is very important to see a clean break and close below the 0.6900 support area, preferably with a daily close lower. And this is when bears could start jumping in like crazy.
It is obvious, that for now, the long term CAD/CHF trend remains bearish. The recent upside correction could start attracting sellers once again as price remains in the supply zone. Multiple resistance levels being rejected and as long as daily closing prices will remain below the 0.6980, traders should expect continuous selling pressure. This eventually will push the price down quite heavily.
Based on the Fibonacci levels as well as the previous level of support, we can expect CAD/CHF to move down towards either 261.8% Fibs at 0.6664, or towards 361.8% Fibs at 0.6260.
The probability of the price moving north remains very low at this point in time. For this scenario to become a reality, CAD/CHF must break and close above 0.6983 resistance, as per the 4H chart. When/if this occurs, we can expect much more growth potential from the CAD/CHF pair, and obviously bearish scenario would be invalidated.
Support: 0.6900, 0.6670, 0.6260
Resistance: 0.6316, 0.9632, 0.6980