
Published: August 13th, 2020
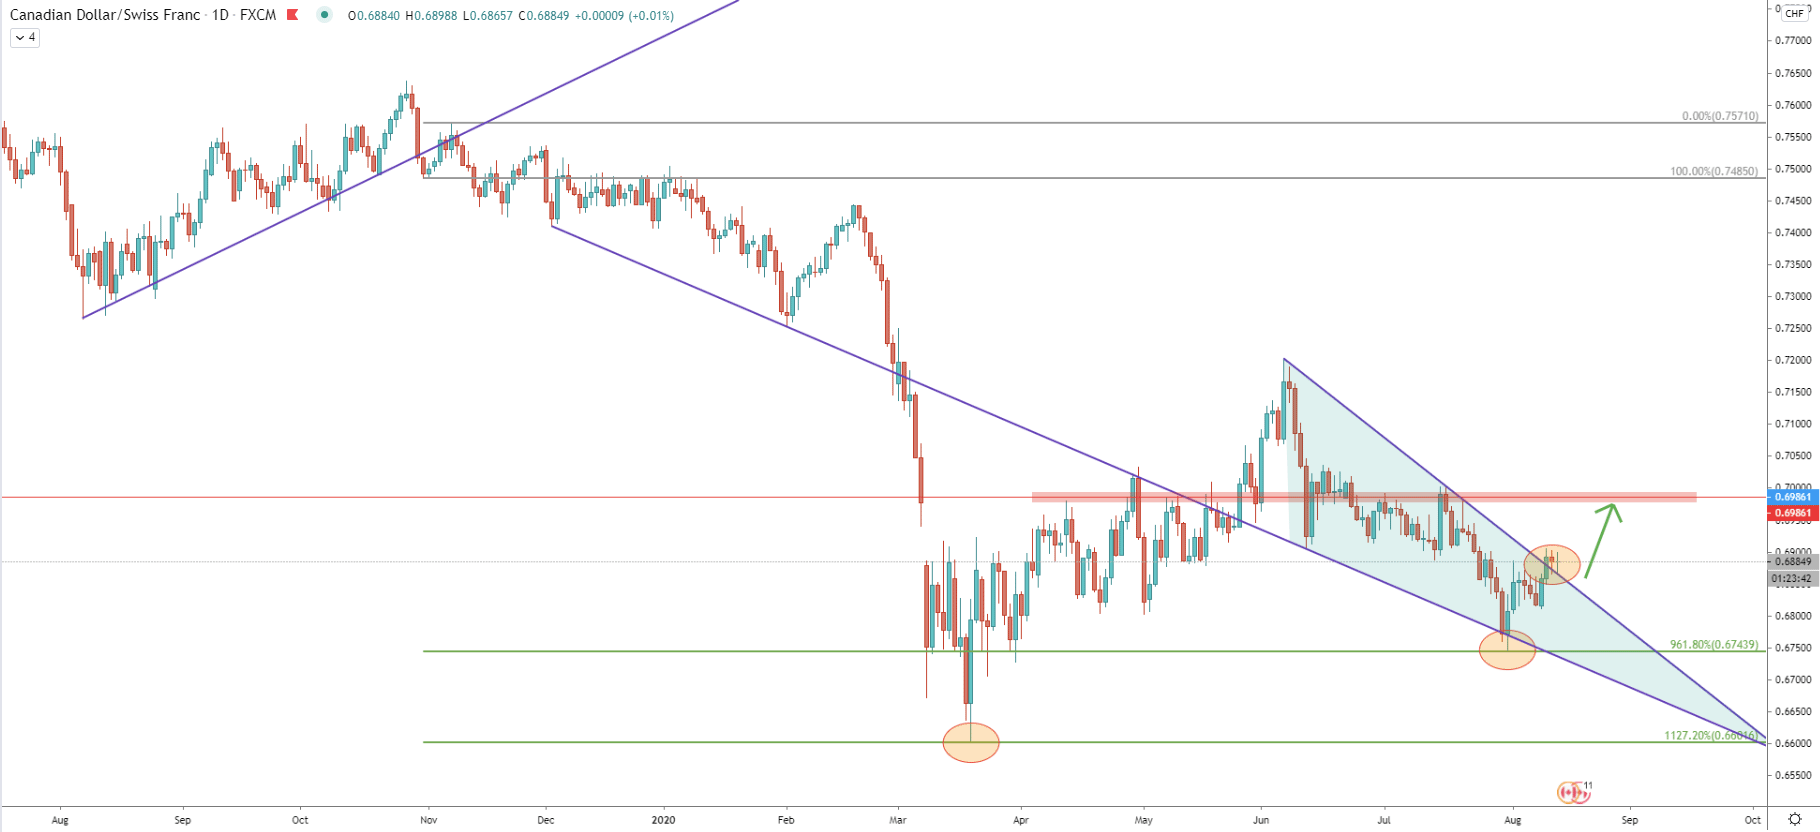
On the Daily chart price has reached the bottom while hitting 0.6600 psychological support back in March this year. This was the point where 1127.2% Fibonacci retracement level has been rejected cleanly. The Fibs was applied to the corrective wave up after CAD/CHF broke below the uptrend trendline.
The next rejection occurred in August when the price bounced off the 961.8% Fibonacci retracement level at 0.6744. Yet again a very clean rejection followed by the daily break and close above the triangle pattern. This could have been the confirmation that the trend is about to turn bullish in the medium to long term. Although the first key resistance is only 100 pips away and could be at the previous supply/demand zone near 0.6985.
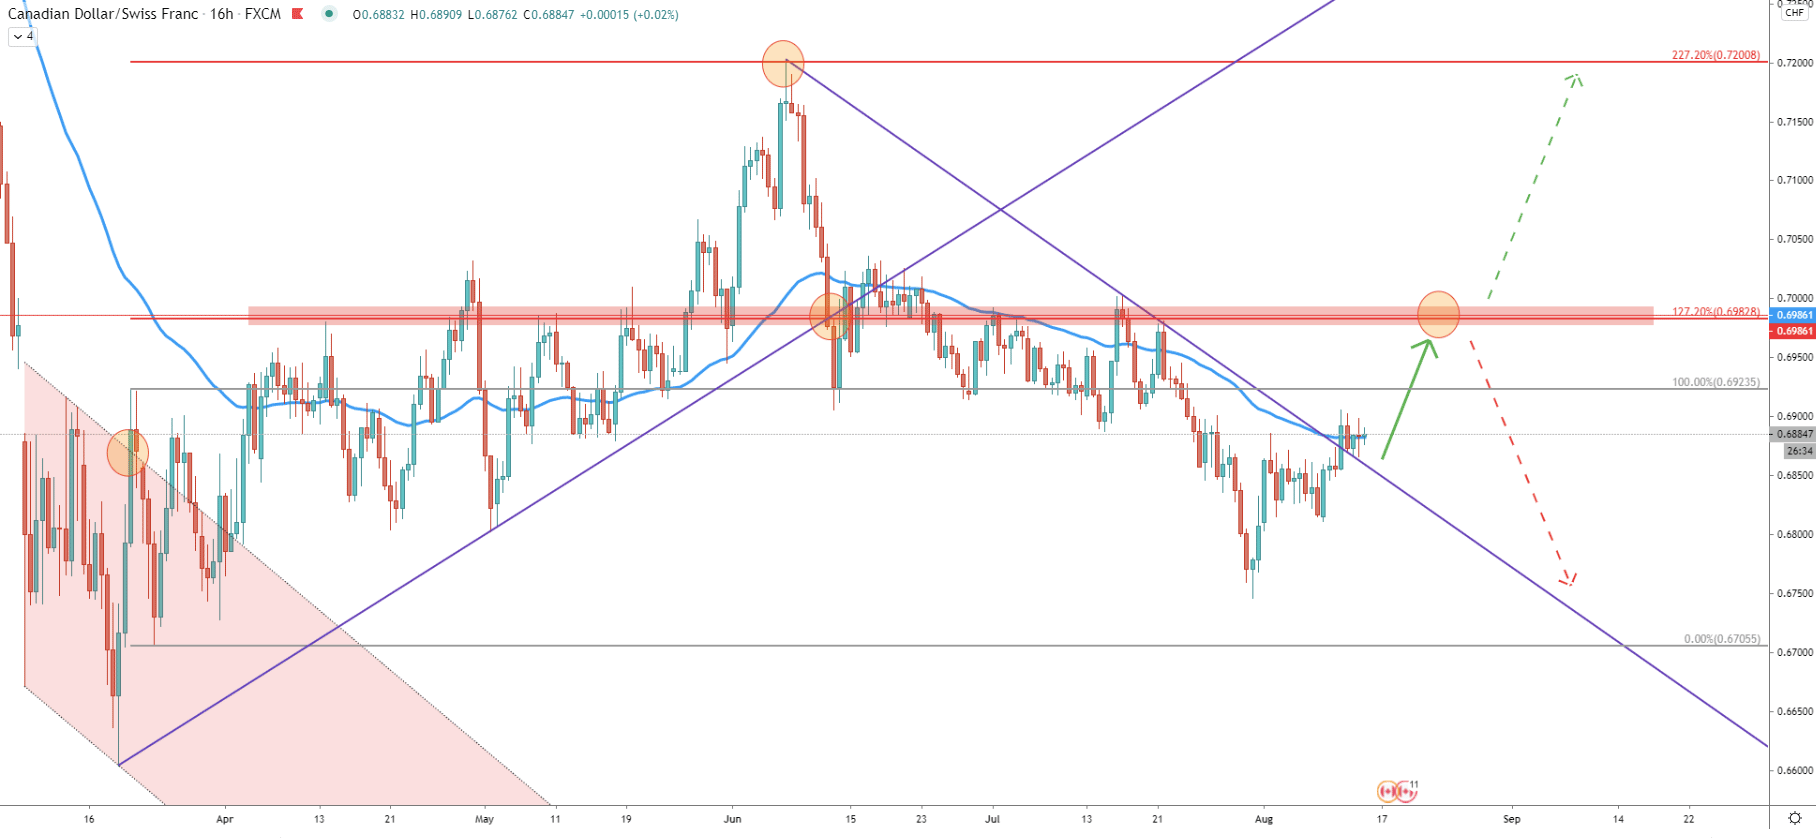
On this chart, price broke above the descending channel and we’ve used Fibonacci, applied to the corrective wave down after the channel breakout. It shows that 227.2% Fibs was rejected when the price tested 0.7200 psychological resistance. Now we see also a break and close above the 50 Exponential Moving average as well as the downtrend trendline. Besides, after the trendline break, it now acts as the support which has been rejected.
This means that price is likely o continue moving up, potentially to test 127.2% Fibs area near 0.6985, which corresponds to the resistance level as per the Daily chart. It also corresponds to the breakout point of the uptrend trendline, making it a very strong supply zone and the potential upside target for the buyers.
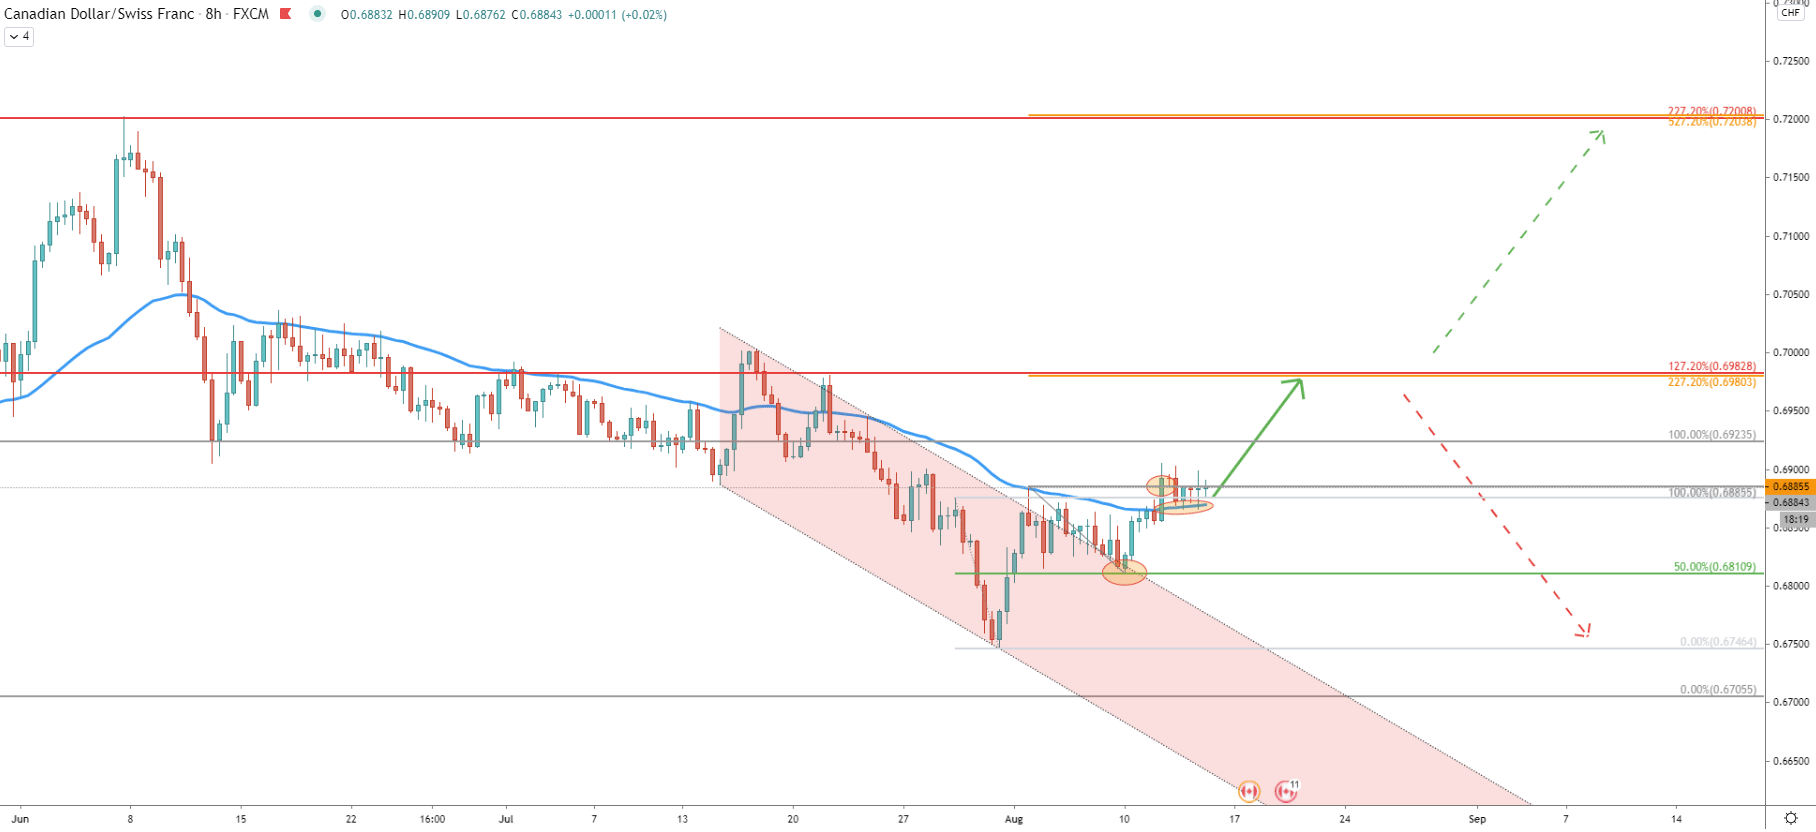
Price also broke above the descending channel on the 8-hour timeframe. After the rejection of the 50% Fibonacci retracement level applied to the last wave down, the price went up and broke above the point of the 50 EMA rejection - the 0.6885 resistance. Currently, CAD/CHF is finding the support at the 50 EMA, and as long as the Daily closing price remains above 0.6885, price is extremely likely to produce at least one more wave to the upside.
On this chart, the 0.6985 resistance area is confirmed by two Fibs. First as per the 16-hour chart, and the second is 227.2% Fibs applied to the correction down where 0.6810 support was rejected. This will be an important price area, because when/if reached, the break above might send price a lot higher to re-test previous resistance level at 0.7200. But the rejection of the 0.6985 area should result in the continuation of the long term downtrend.
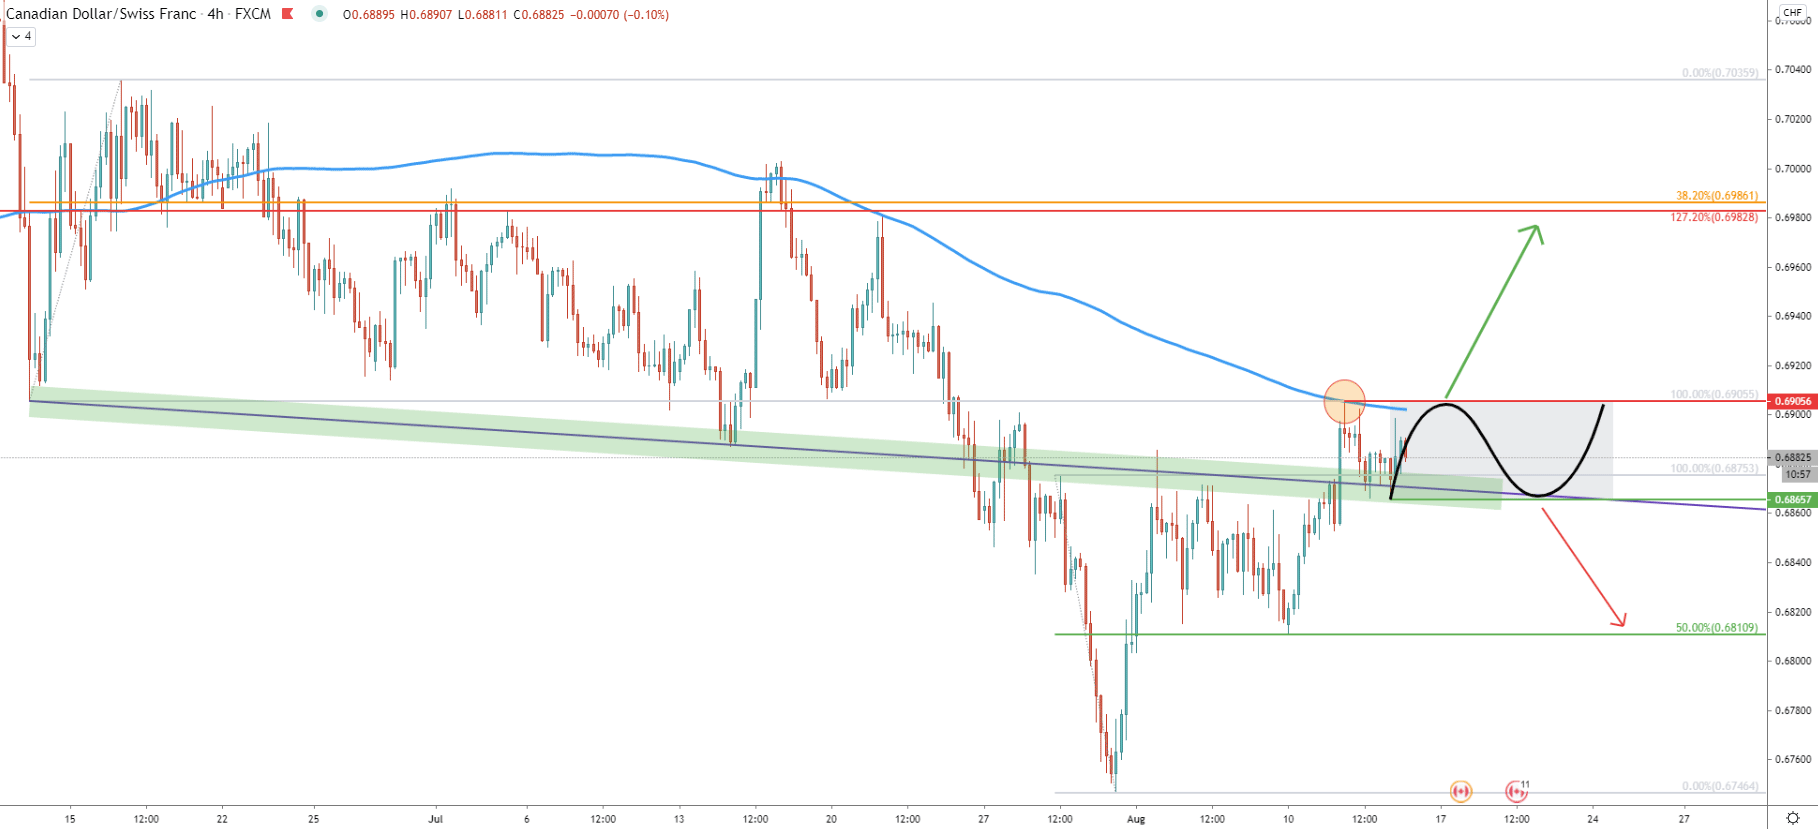
On this chart, there is an average-price downtrend trendline, which is acting as the support and is being rejected during past several days. But at the same time, the 200 EMA resistance was also rejected when price tested 0.6905 high. This might suggest the beginning of the consolidation phase where the price will continue to range between 0.6965 support and 0.6905 resistance for the time being.
Perhaps the safest approach for buyers could be to wait until price breaks above the Moving Average and only then take action. Upon the break above the resistance, the price can increase by another 80 pips, and on this chart, the resistance is also confirmed by 38.2% Fibs applied to the corrective wave up after CAD/CHF broke below the 200 EMA.
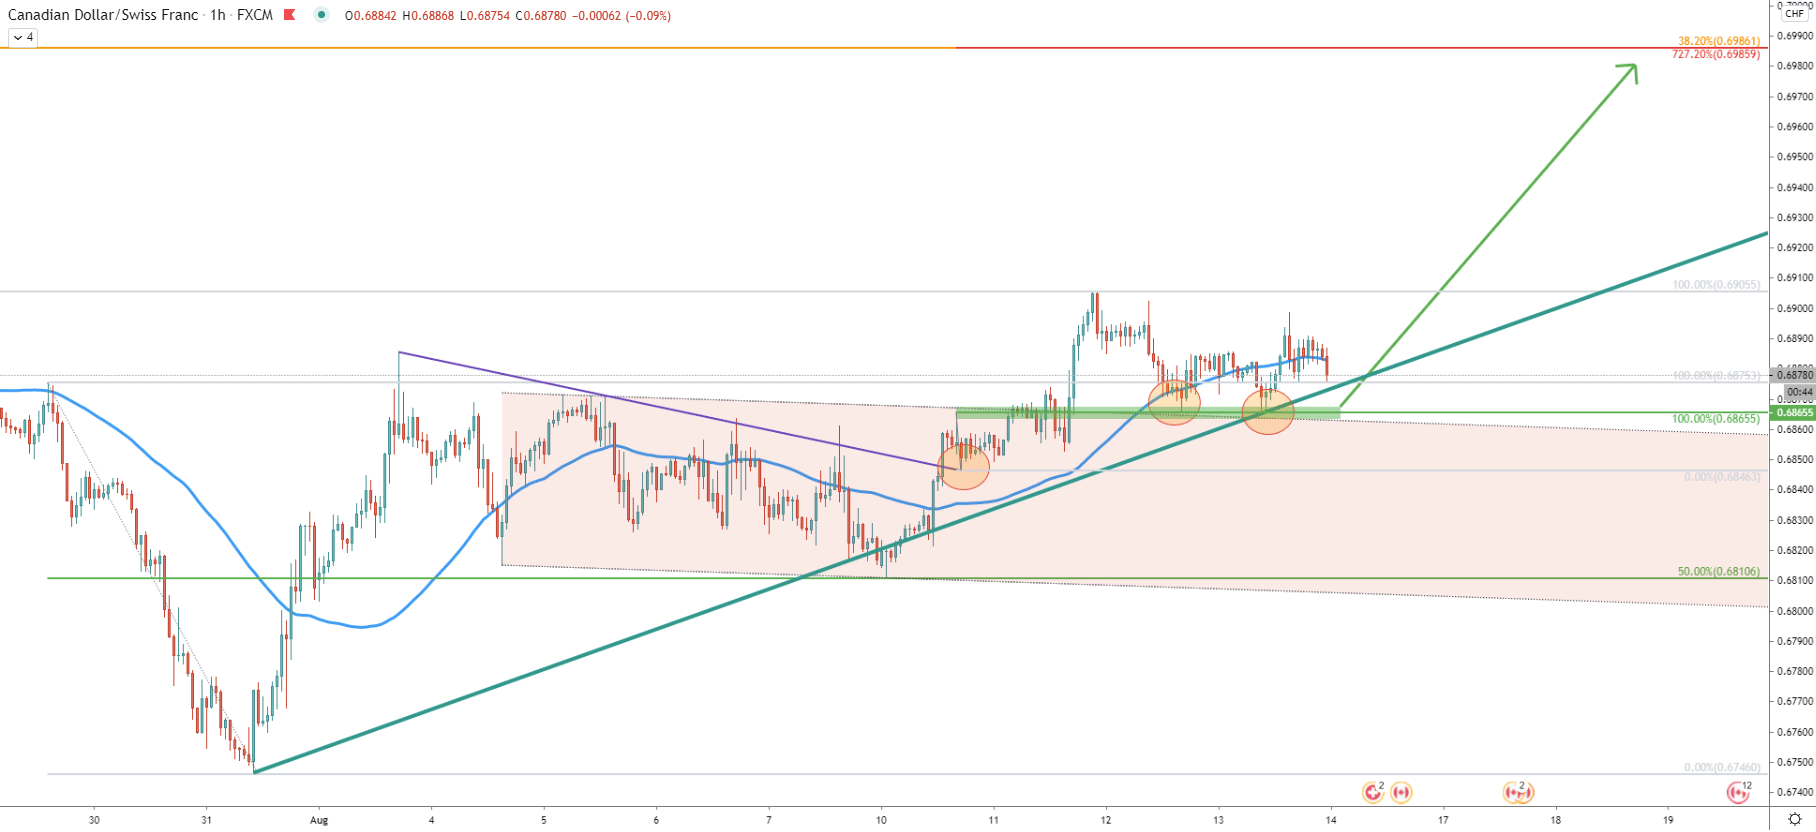
On the Hourly chart, CAD/CHF had cleanly rejected the uptrend trendline as well as the upper trendline of the descending channel, which was broken on August 10. Prior to the channel breakout, price broke above the downtrend trendline and we have applied the Fibonacci retracement indicator to the corrective wave down after the breakout. The 727.2% Fibs precisely corresponds to the 38.2% Fibs resistance at 0.6986 as per the 4-hour chart.
All-in-all, CAD/CHF showing multiple bullish signs and considering the potential overall weakness of the Swiss Franc, CAD/CHF could be feeling very strong in the coming days. Considering only 100 pip expected move, the target is expected to be reached within just several trading days.
As per the 8-hour chart, there are two major resistance levels to watch, each of them is confirmed by at least 2 Fibonacci retracement levels. The first resistance is 0.6985 and the second is at the previous psychological and technical level - 0.7200.
As per the 4-hour chart, if price breaks and closes below the 0.6865 support, the bullish potential will become much less probable and CAD/CHF is likely to struggle to move north. Most likely sellers will continue to dominate.
Support: 0.6865, 0.6810
Resistance: 0.6905, 0.6985, 0.7200