
Published: February 12th, 2020
There is an extremely bearish scenario developing on the CAD/CHF currency pair. Today we will look at the Weekly, Daily and 4H charts to understand the probability of further price movement. It will help us understand what to expect this week and even month in terms of price potential.
Below is a Weekly chart where a strong resistance formed back in March 2015. It is located near the 0.7950 area, and so far was rejected twice already. The last rejection occurred in September 2017, after which price started to produce lower lows and lower highs.
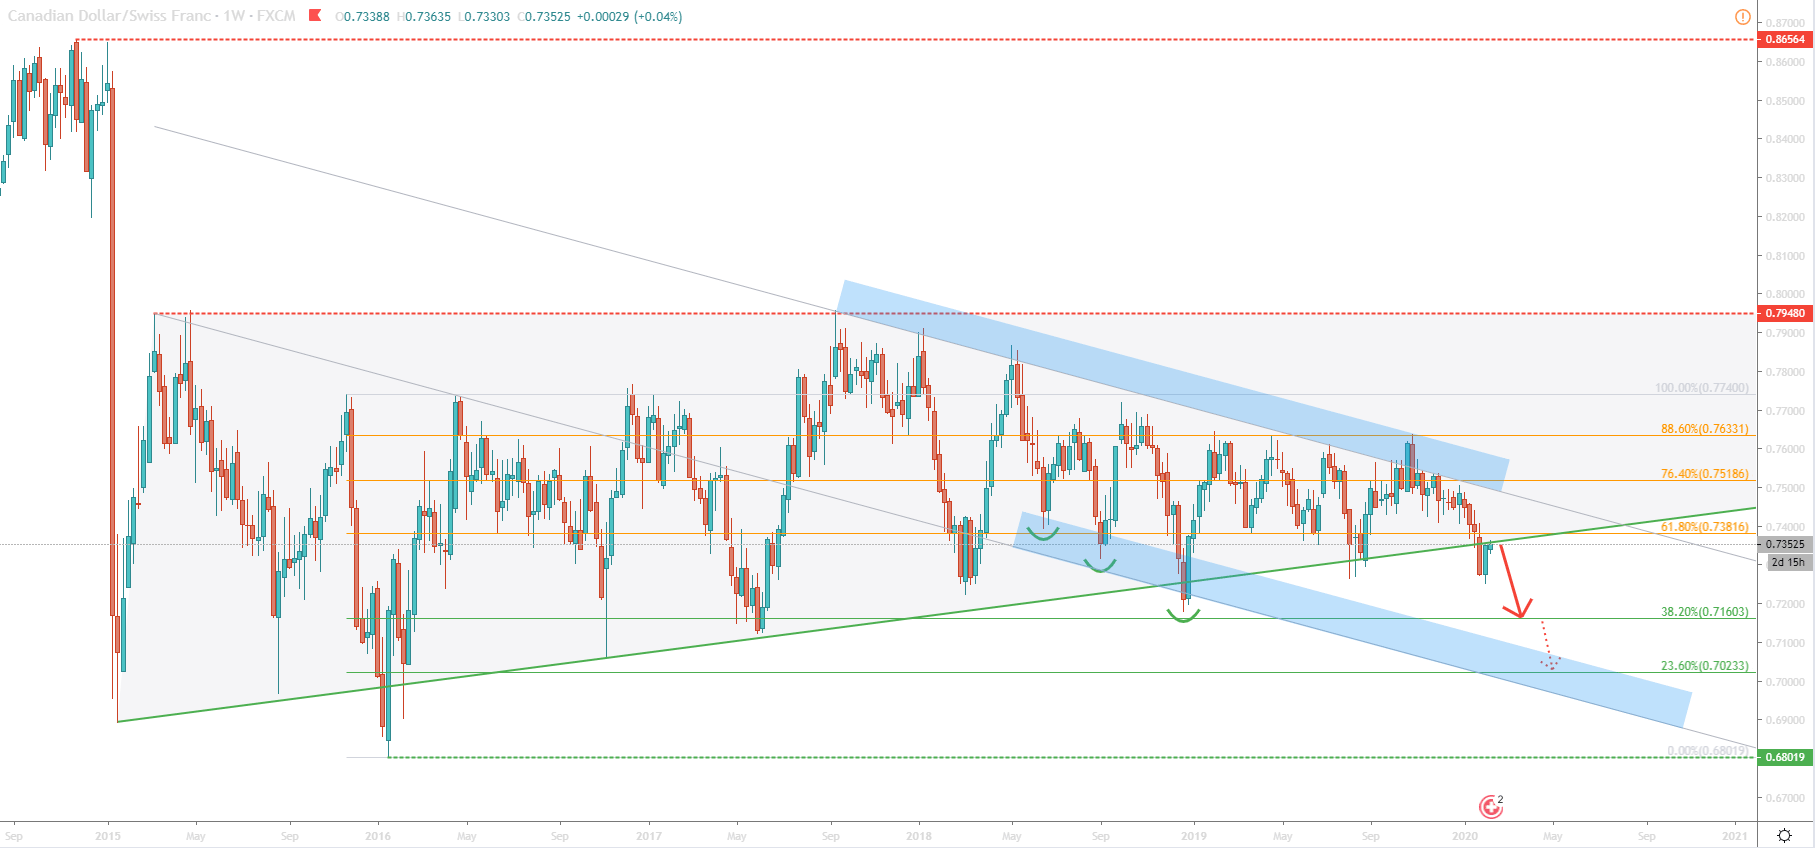
It has been a very sluggish downtrend, in fact, some might call it range trading by looking at a Weekly chart. Nevertheless, price continues to move within the descending channel, where the upper trendline was rejected on multiple occasions.
The Fibonacci retracement, applied to the January - April 2016 corrective wave up shows that there is clear resistance at the 88.6% retracement level, corresponding to 0.7633. Price has bounced off this level at least three consecutive times. A the same time CAD/CHF has produced lower lows and lower highs, breaking below the uptrend trendline. Soon CAD/CHF might be reaching 38.2% retracement at 0.7160. And if that level is broken, more downside pressure should be expected.
Its time to dive deeper and see what is going on in the Daily chart.
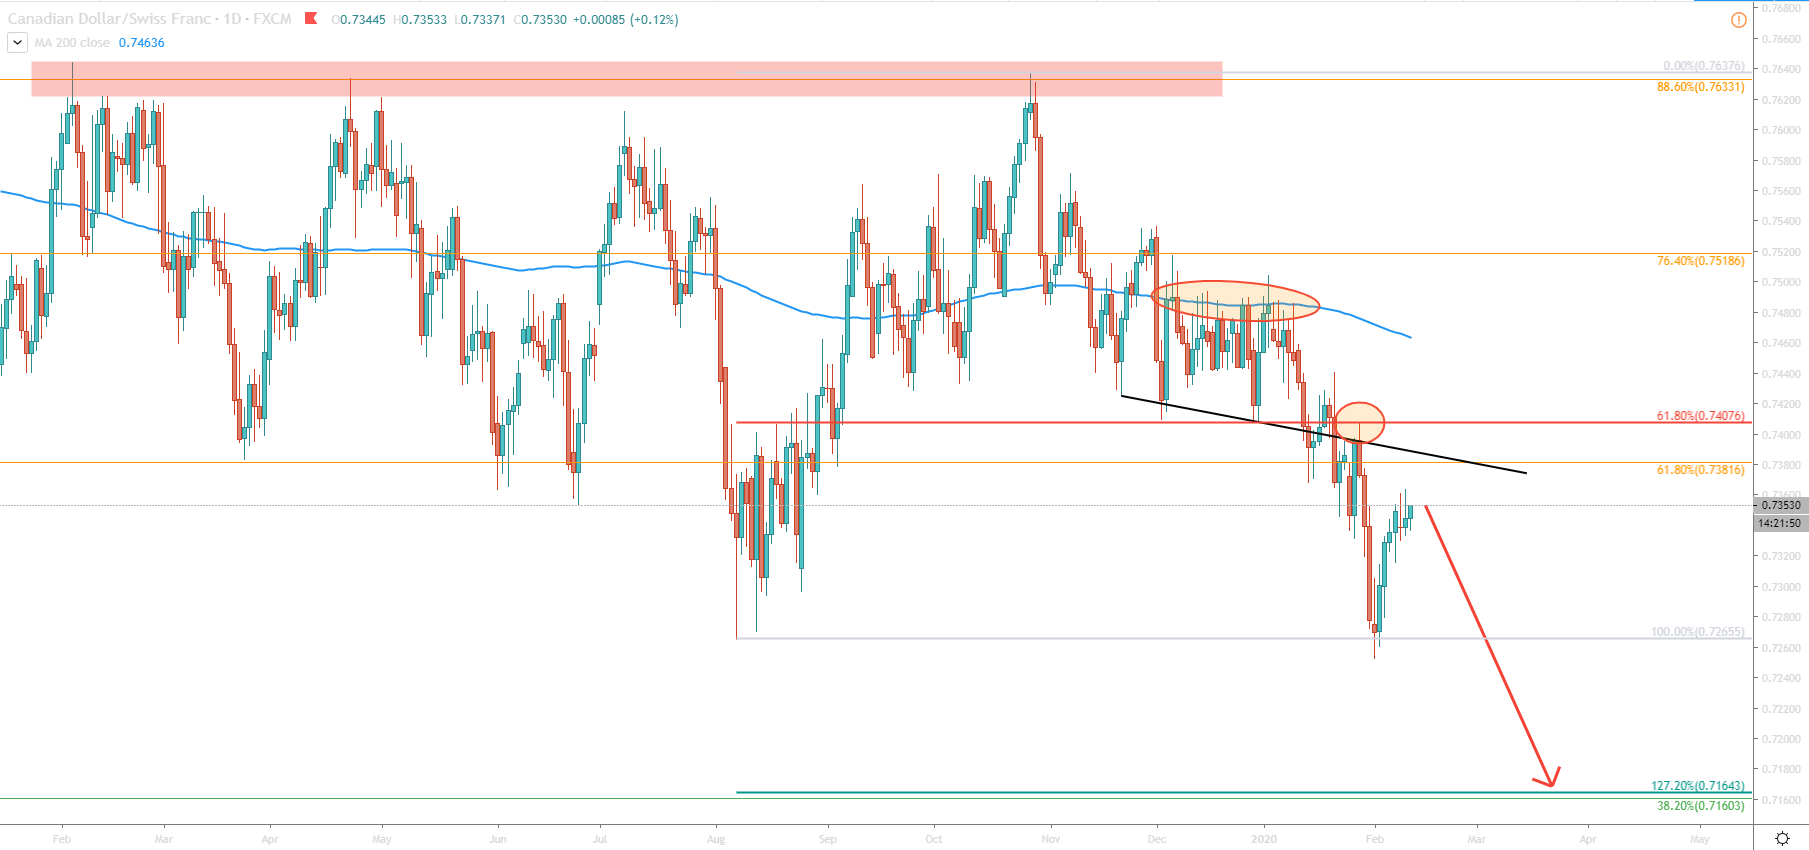
Here we can see more confirmations of the ongoing downtrend. First off, there is a more clear view of the 0.7633 resistance, where the last bounce occurred on October 28. Since then, lower lows and lower highs were printed, clearly indicating the validity of a downtrend. Moreover, CAD/CHF broke below the 200 Moving Average, after which corrected up and found the resistance at the very same Moving Average. The 76.4% Fibonacci retracement at 0.7518 was also rejected cleanly along with MA.
Another very important point is the break below the 61.8% support level of the Fibonacci applied to the August - October 2019 corrective wave up. After the breakout, the very same (0.7407) level became the resistance followed by a new lower low.
On the 4H chart, there is a more detailed view of the downtrend.
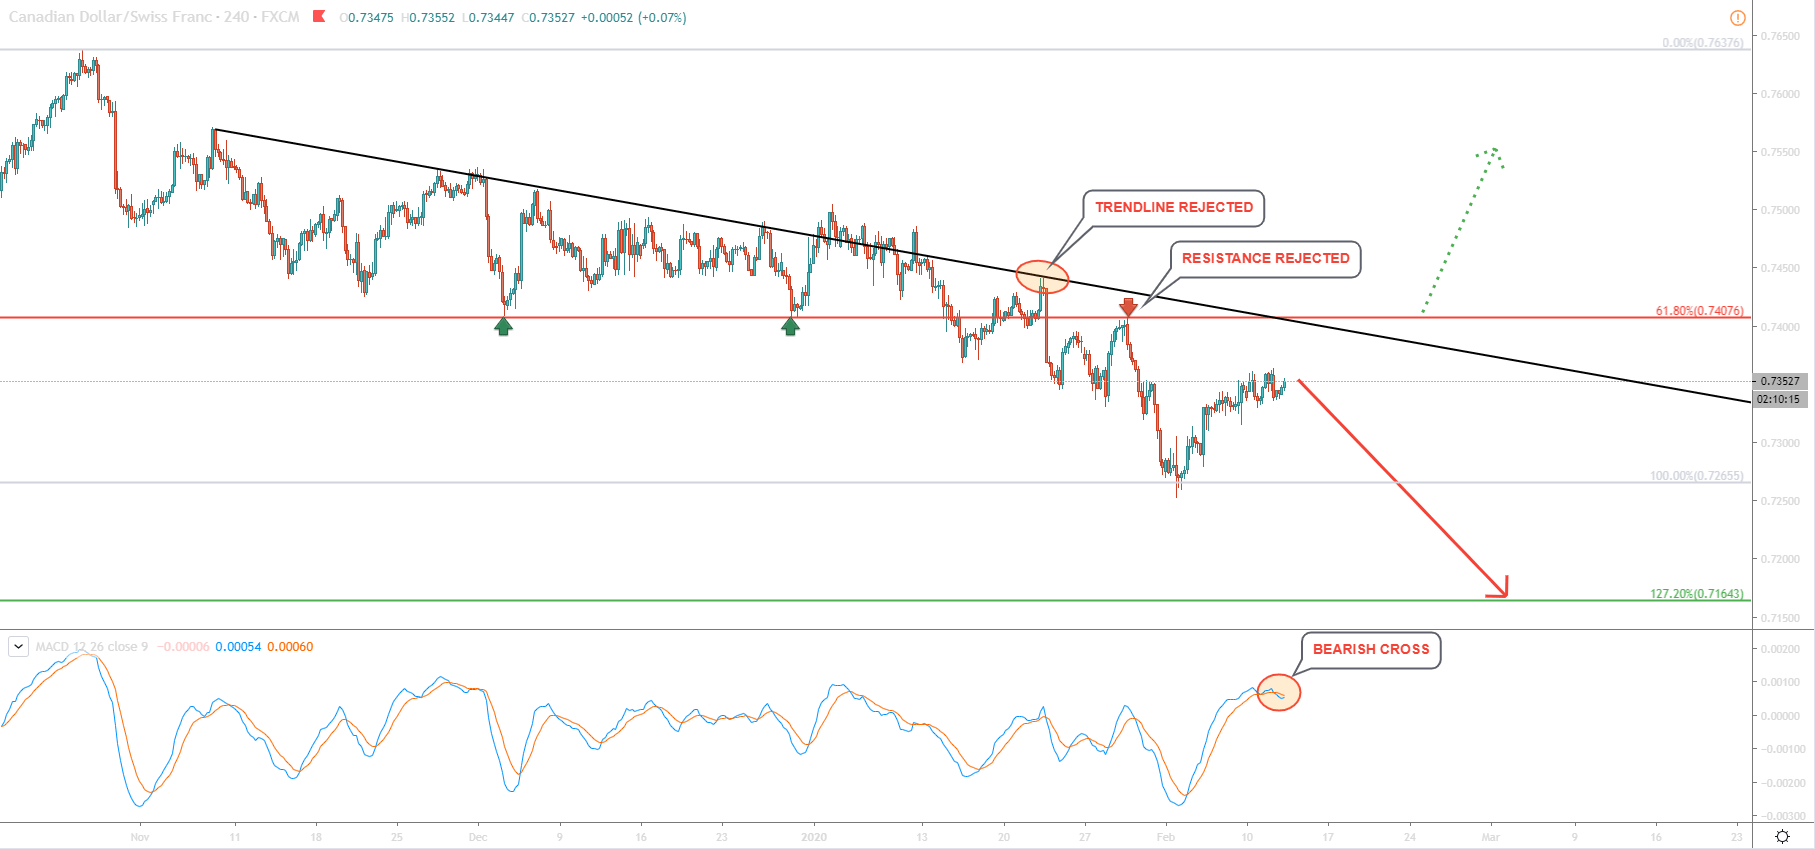
Throughout the past 3 months, downtrend trendline has been respected each and every time. After a clean bounce off the 61.8% Fibonacci, CAD/CHF has now corrected up and currently trading near 0.7350. This might be the price of interest for sellers or in other words the supply zone. Most of the interest can be driven by the MACD crossover, which usually acts as a sell signal or a short trade trigger.
Current CAD/CHF sentiment remains bearish, especially on Daily and 4H charts. Most recent correction along with MACD crossover should stimulate next selloff week.
The nearest support is near 0.7265, where the previous low was formed on the 4H chart. If the price will produce a new lower low, the next target at 0.7160 is very likely to be reached within a week. The final target is seen at 0.7025 and can only be tested after the Daily break and close below 0.7160.
The trend reversal scenario should never be ignored because market sentiment can change very fast on the important news release. Key resistance is at 0.7408 and only break above would invalidate the bearish forecast. This scenario can initiate a new long-term bullish cycle.