
Published: May 7th, 2020
Following our previous analysis related to the overall strength of the Great British Pound, we are going to analyze the GBP/CAD currency pair and its’ long term perspectives.
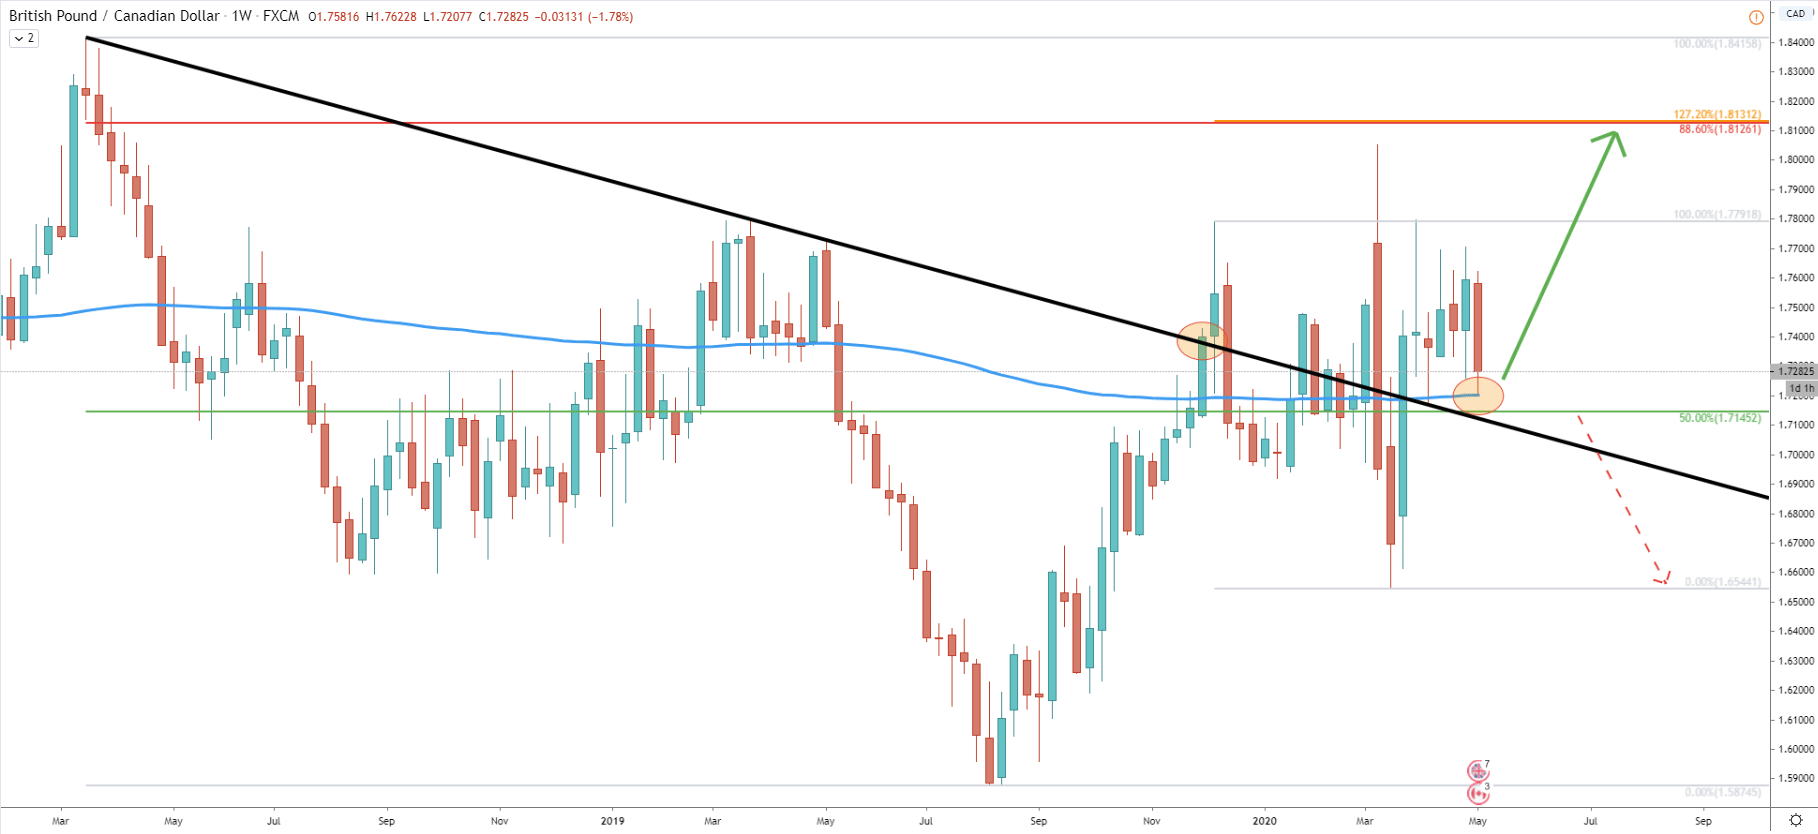
As usual, starting with a higher timeframe we can see that on the Weekly chart price managed to break above the downtrend trendline. However, since then, GBP/CAD has been going through a very wide range-trading accompanied by high volatility. Within just a few weeks, the price has risen up to 1.1853 and then immediately fell down to 1.6544. This can definitely be called a highly volatile market, considering the amazing 1500 pip range.
Nevertheless, GBP/CAD managed to recover and went back up to 1.7800 area. The most recent correction down shows, that price has reached 200 Exponential Moving Average and could be ready to move up once again, as long as it holds the EMA. Talking about the support, the nearest one is seen at the 50% Fibonacci retracement level, which still could be tested. But the probability of a major uptrend continuation remains very high, where GBP/CAD can be expected to continue rising towards the 1.8130 area. This is a key upside target for GBP/CAD as it confirmed by two Fibonacci retracement levels, 88.6%, and 127.2% Fibs. It means that the GBP/CAD growth potential is as much as 850 pip in the medium to long term.
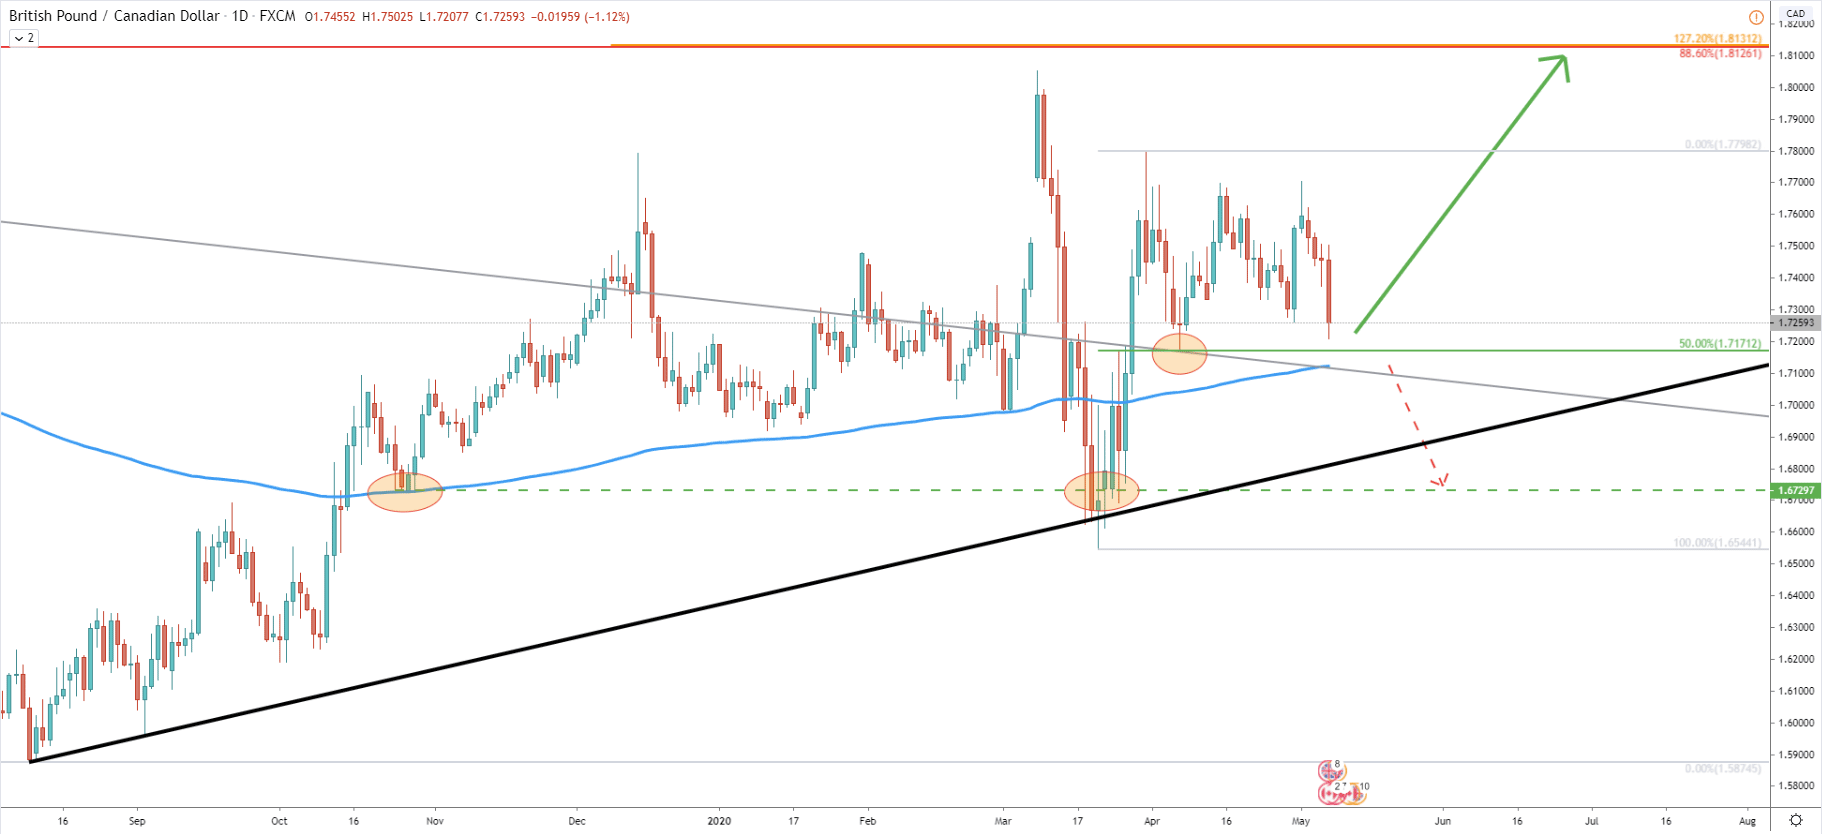
Moving on to the Daily chart, the downtrend trendline has been broken and now acting as the support. In fact, the trendline has been rejected cleanly along with the 50% Fibonacci retracement level at 1.7171. It makes this price level the nearest support which should play a key role in further price development. As long as it holds, GBP/CAD will move north. But the daily break and close below this level would prove a strong selling pressure and can result in a price drop towards the 1.6730 support.
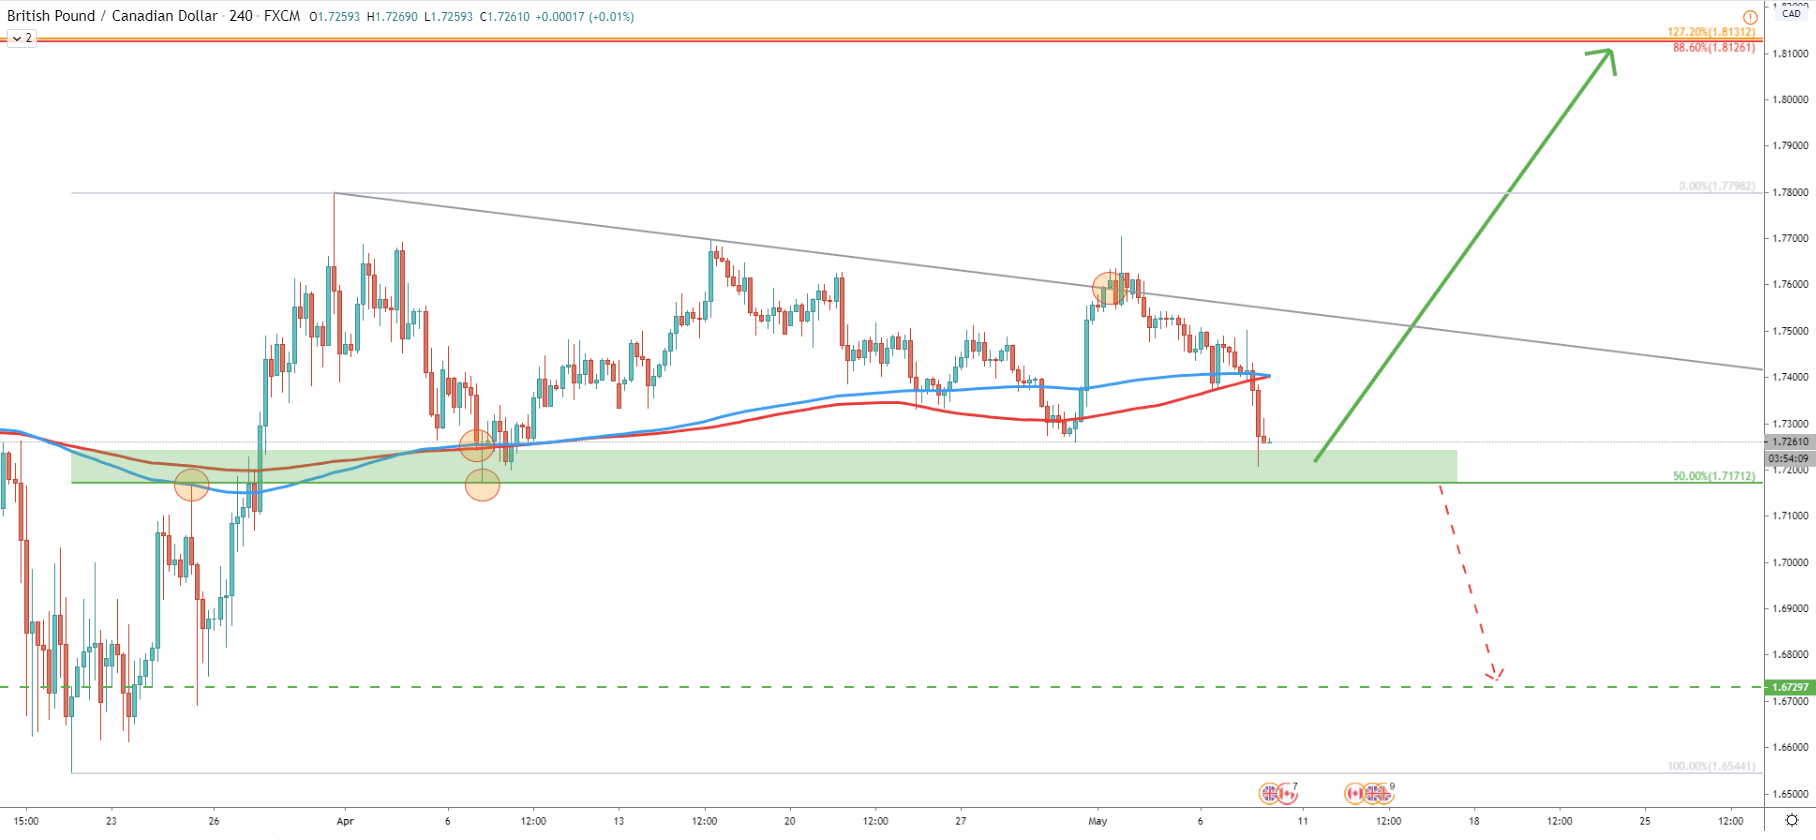
On the 4-hour chart, the support area is very obvious, and still, the price remains above it. The importance of this support is the price movement around the 200 Exponential and Simple Moving Averages. First, EMAs acted as the resistance at 1.7171, but then price broke above, and on the April 7 bounced off both EMAs cleanly. Prior to that, there was a break and close above the downtrend trendline, suggesting strong bullish intentions in the long run. Currently, GBP/CAD has entered the demand zone, which is truly attractive to buyers. We are yet to see whether this support will hold, but up until now price failed to break below.
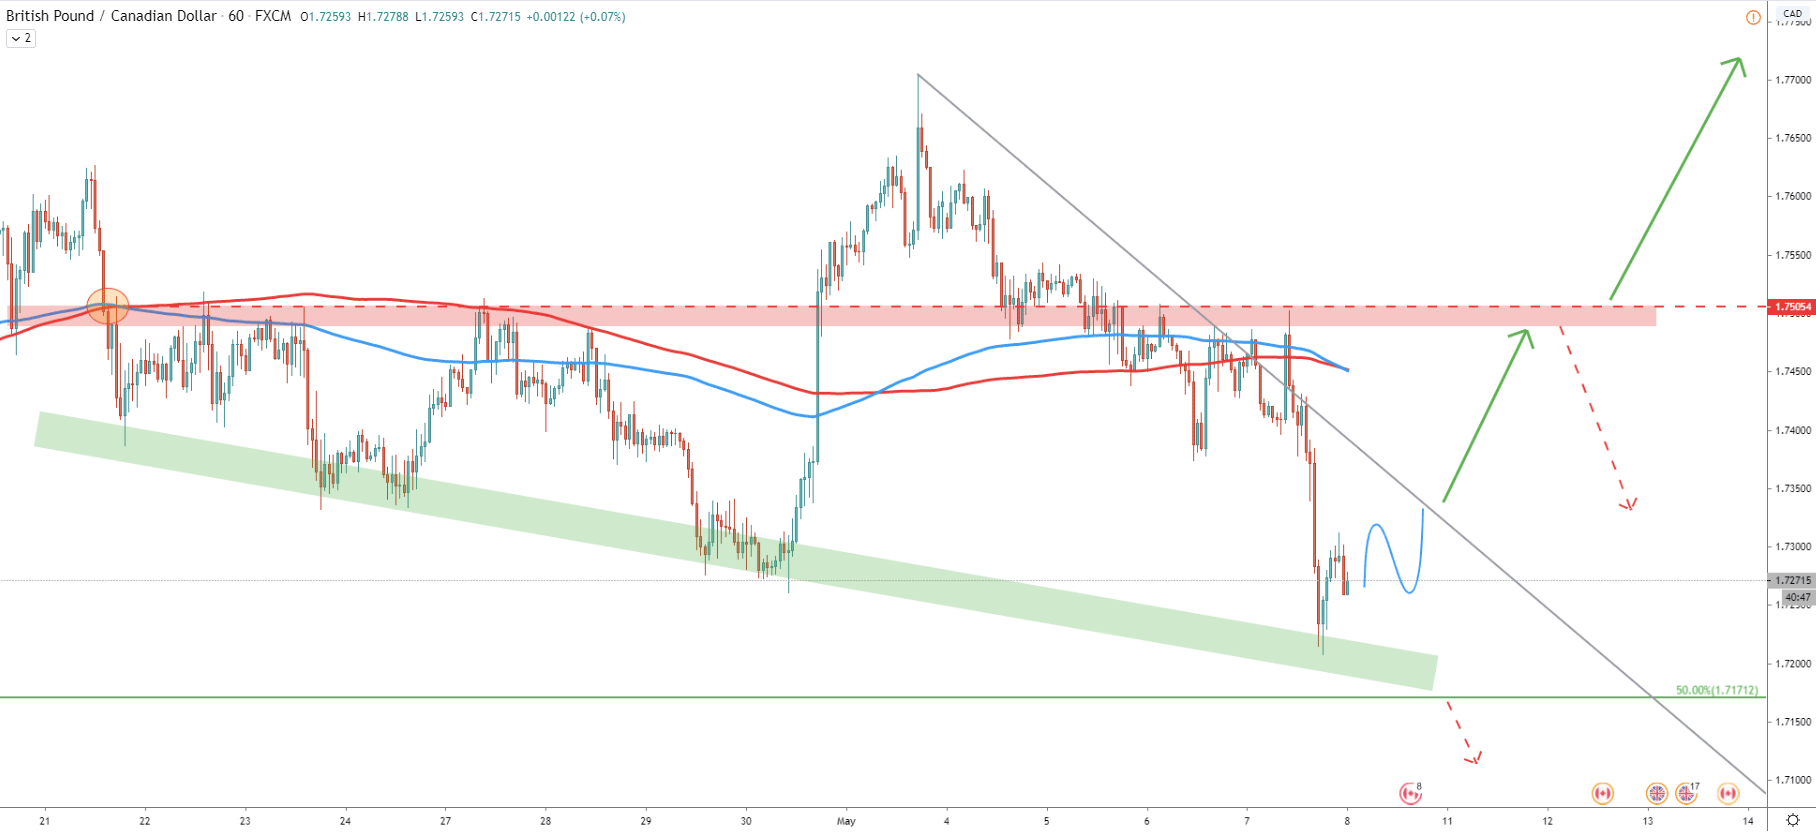
On the 1-hour chart, there is a support downtrend trendline. Today GBP/CAD entered the trendline support area and bounced back up very quickly. Still, there must be more confirmations for the potential bull run. Although, one of the things to watch, is the break above the downtrend trendline. Perhaps only then GBP/CAD will feel truly bullish in the short, medium, and long term.
Long-term GBP/CAD is still bullish as price remains above the 200 Moving Average on the Weekly and Daily charts. Simultaneously, lower timeframes show some indecision and the ongoing battle between bulls and bears. Very soon it will be clear who is going to win this battle, but so far, bulls have the advantage.
As per the Weekly chart, there is only one key resistance. It is 1.8130 price area, which is confirmed by two Fibonacci retracement levels.
The key support area is seen between 1.7145 and 1.7171 as per the Weekly and Daily charts. This support area is also confirmed by the uptrend trendline and 200 EMA on the Weekly timeframe. If GBP/CAD will manage to close the Day below this area, bullish outlook should be turned to a bearish one. Sellers are likely to take control and push the price down towards the 1.6730 support area.
Support: 1.7171, 1.7145, 1.6730
Resistance: 1.7505, 1.7800, 1.8130