
Published: May 18th, 2020
Most probably everyone is waiting for the Bitcoin bull run. Perhaps right now, Bitcoin is approaching the stage of yet another strong bull run, but the major question is; how far price can rise? This is a big question and in today’s’ analysis we will try to see what are the key resistance levels for Bitcoin if the price will finally start showing exponential growth.
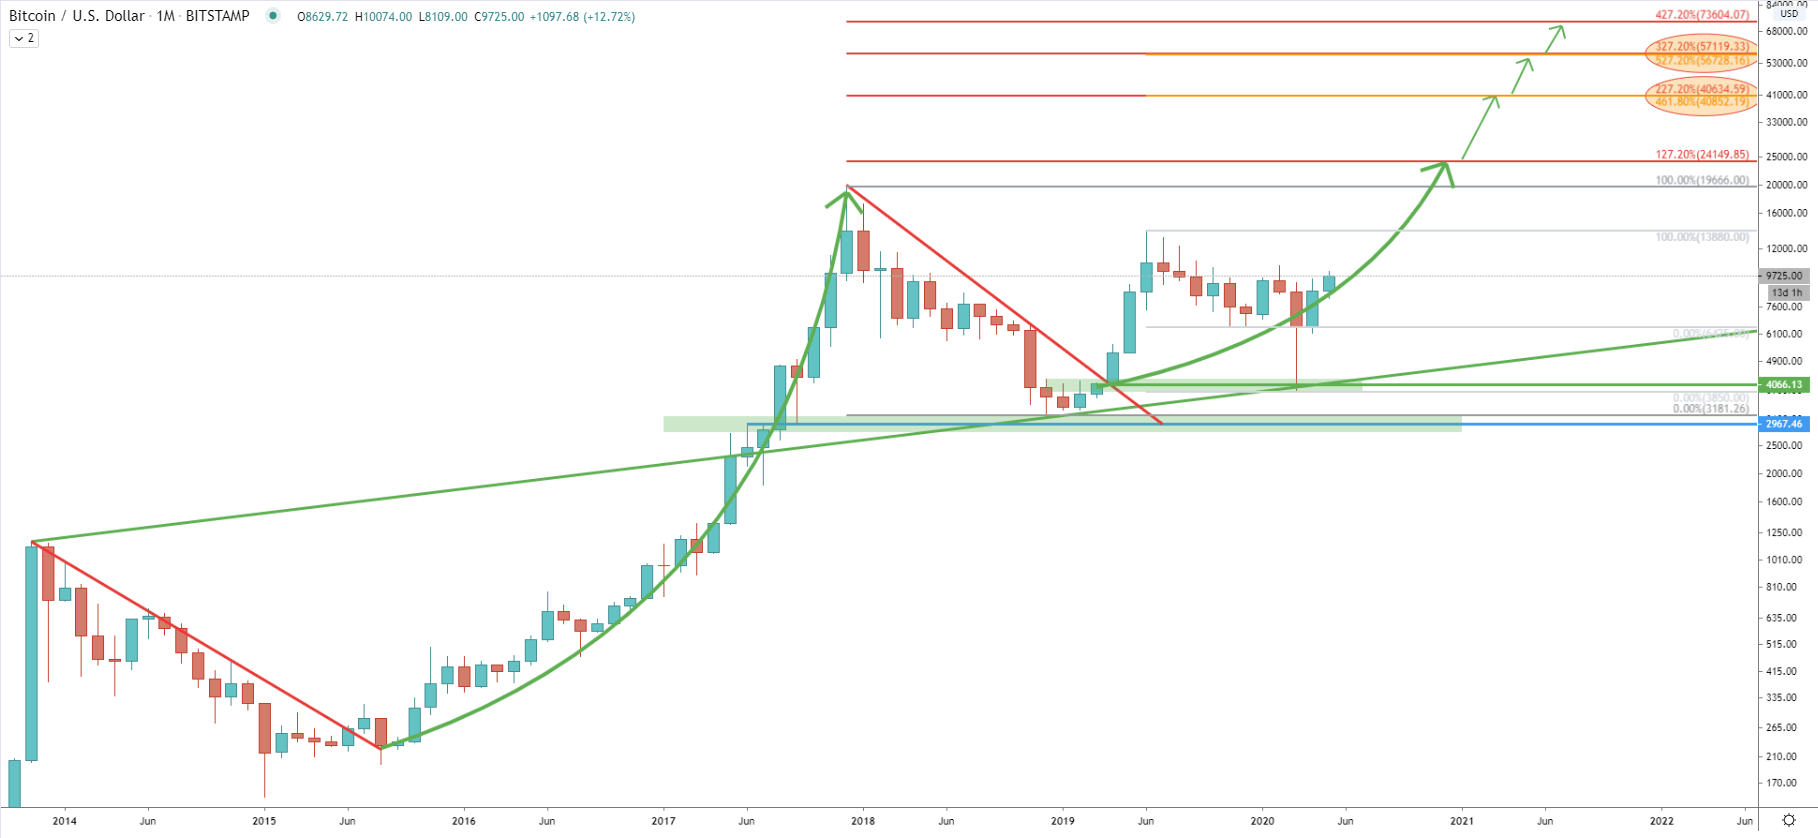
While attempting to see the long term price perspective, let’s start with the analysis of a Monthly chart. Clearly there are correctional phases and trending phases. Since December 2017 until December 2018 price has been constantly moving down and corrected from $20k all-time high, down to $3180 low. This was a correctional phase which has ended after Bitcoin broke above the downtrend trendline. We can see a very similar correction occurred back in 2014, which also took around 1 year.
Since 2019 Bitcoin price has been on the rise overall. There already was a phase of a strong growth which has lasted just 5 months, after which price has been consolidating for nearly 1 year. Currently, we can distinguish major support and resistance levels where price has been locked in during the 5-months period. The support is at $6435 and the resistance is at $13880. There was an attempt to break below the support, although monthly close still was above $6435. This shows that bears are in control and are not allowing the price to drop substantially. This tendency is likely to continue but also can get accelerated, where BTC will go exponential, as it already happened multiple times in the Bitcoin history.
We have applied 2 Fibonacci retracement levels to 2 corrective waved down, the major correction of 2018 and the minor correction June 2019 - March 2020. These Fibonacci indicators give us 4 major resistance levels, where price could be aiming for. The nearest resistance is at $24150, which is a 127.2% Fibs. The next resistance is at $40600, confirmed by 227.2% and 461.8% Fibs. The third resistance is at $56700, confirmed by 327.2% and 527.2% Fibs. The final and fourth upside target level is seen as high as $73600, which is 427.2% Fibs.
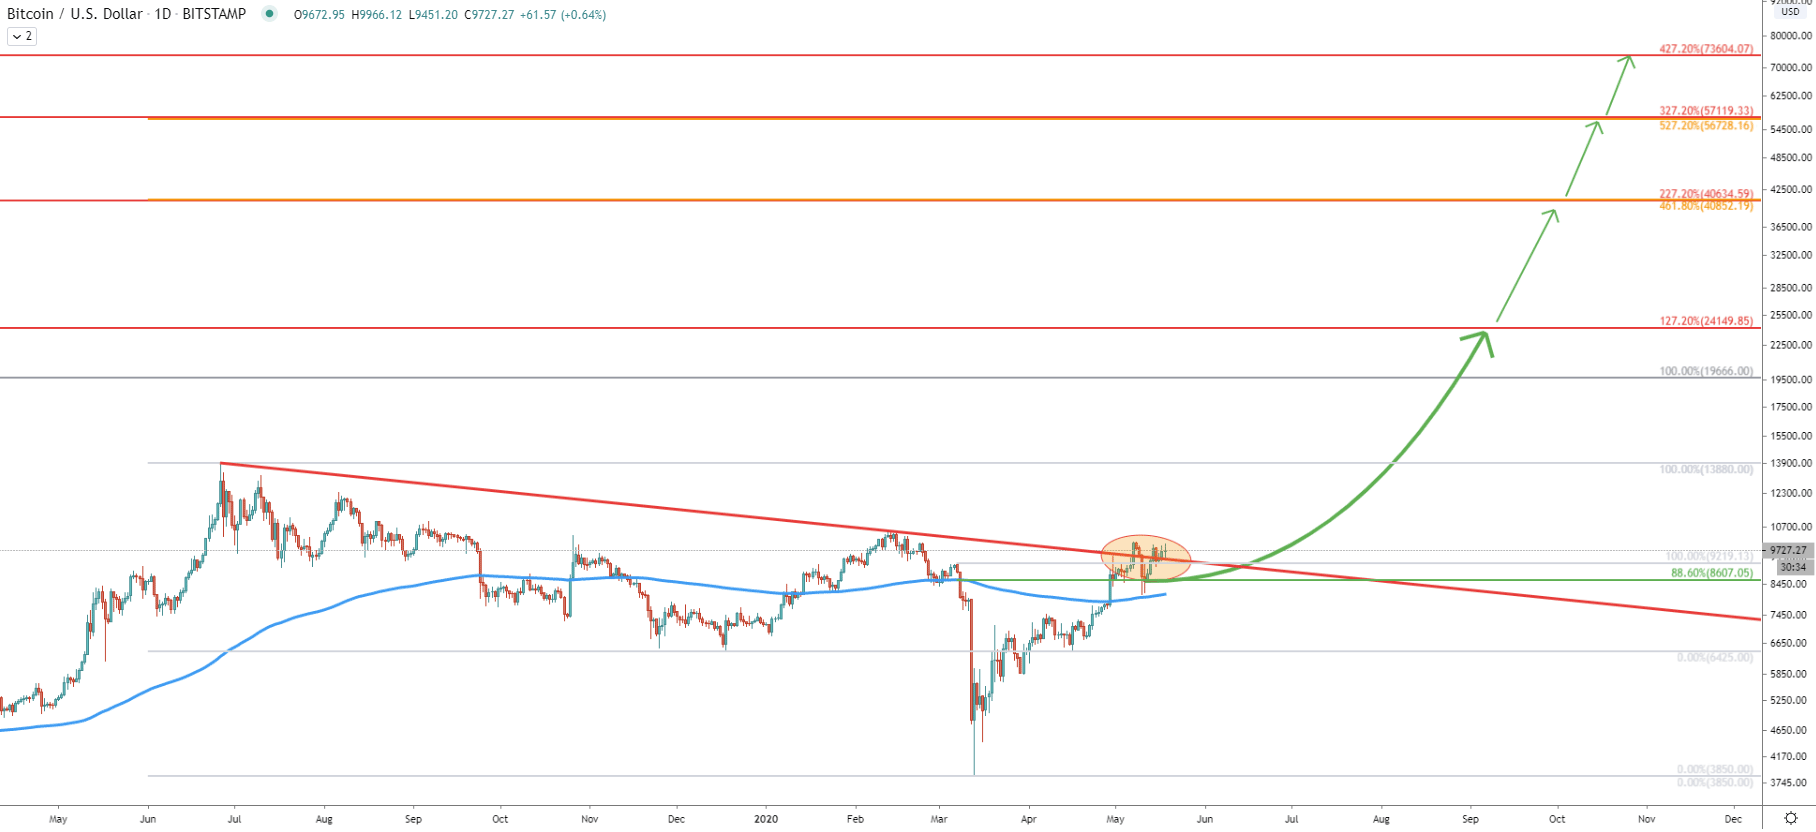
On the daily chart, Bitcoin has finally broken above the downtrend trendline, although it could be better to wait for the breakout on the Weekly and Monthly charts in order to confirm the breakout. Maybe this month’s closing price will have that long-waited confirmation of a trendline breakout and a potential bull run. If so, we could witness a very strong price increase for BTC as soon as this summer.
At the same time, the daily trendline breakout already occurred, along with the breakout of the 200 Exponential Moving Average. This already suggests that the price is either ready or getting ready to move strongly. Fibonacci applied to the last impulsive wave down, shows that pice has broken above the 88.6% Fibs at $8600, and corrected back. Now $8600 is acting as the support which has been rejected along with the 200 EMA.
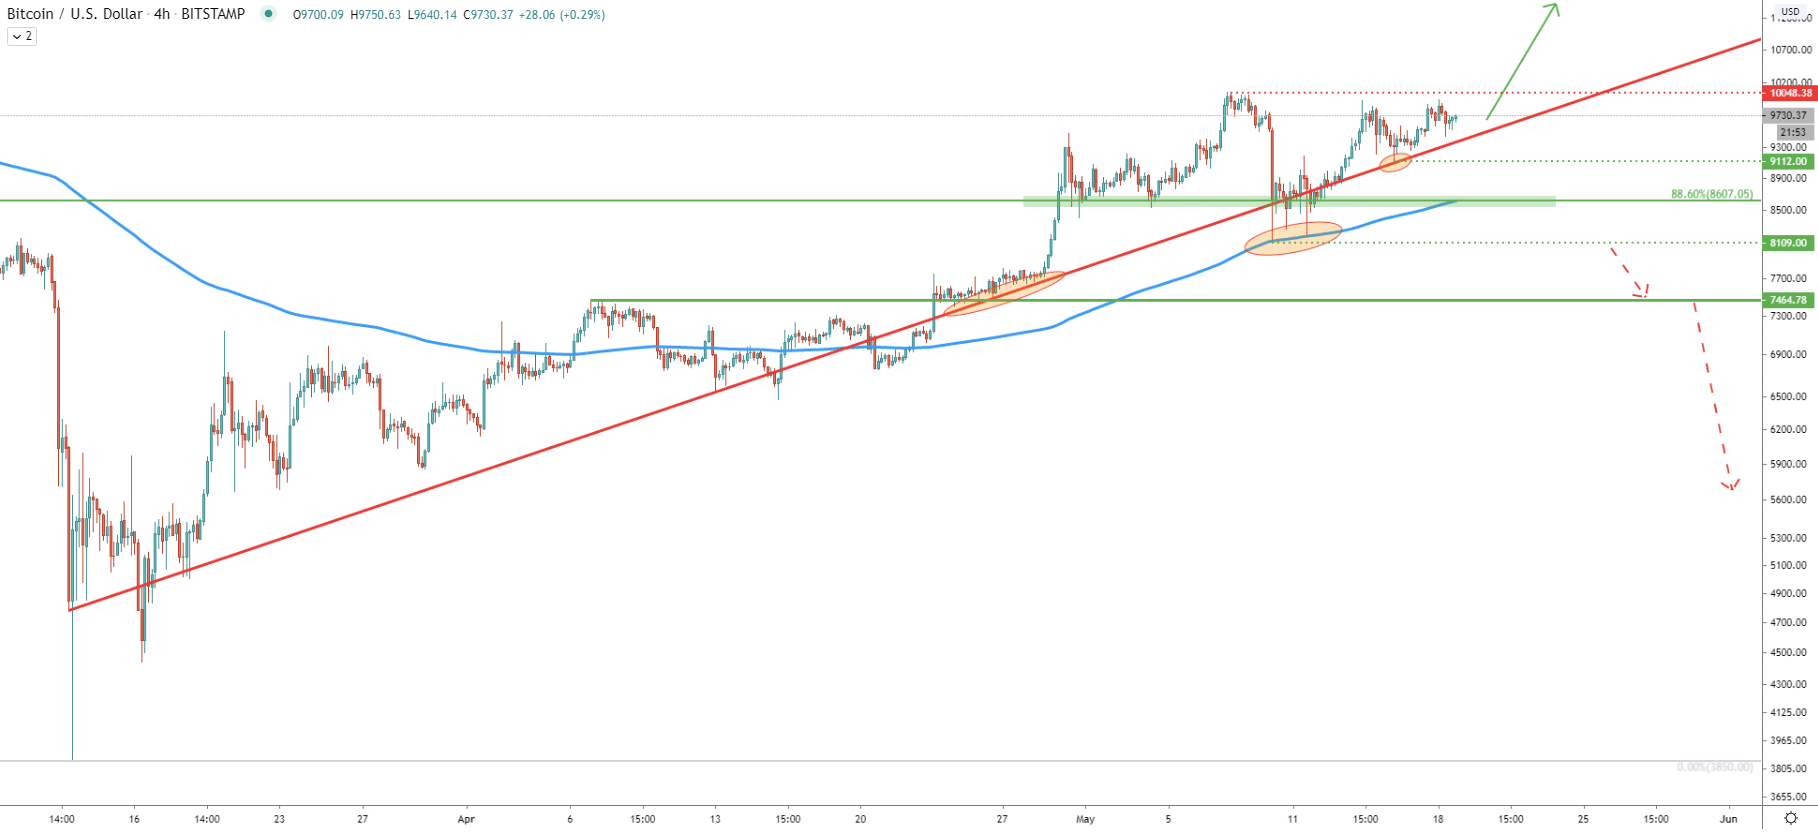
On the 4H chart, BTC/USDT continues to respect the uptrend trendline and rejecting the 200 EMA. We can distinguish short term support and resistance levels based on the current price action. The support is clearly at the low where 200 EMA and the trendline has been rejected, this is $8109. The resistance is the recent higher high, formed near the strong psychological level, this is $10048. It is possible that Bitcoin will re-test the support and can produce the spike below the $8109. But only daily break and close below this level could initiated the consolidation phase and invalidate the upcoming price increase.
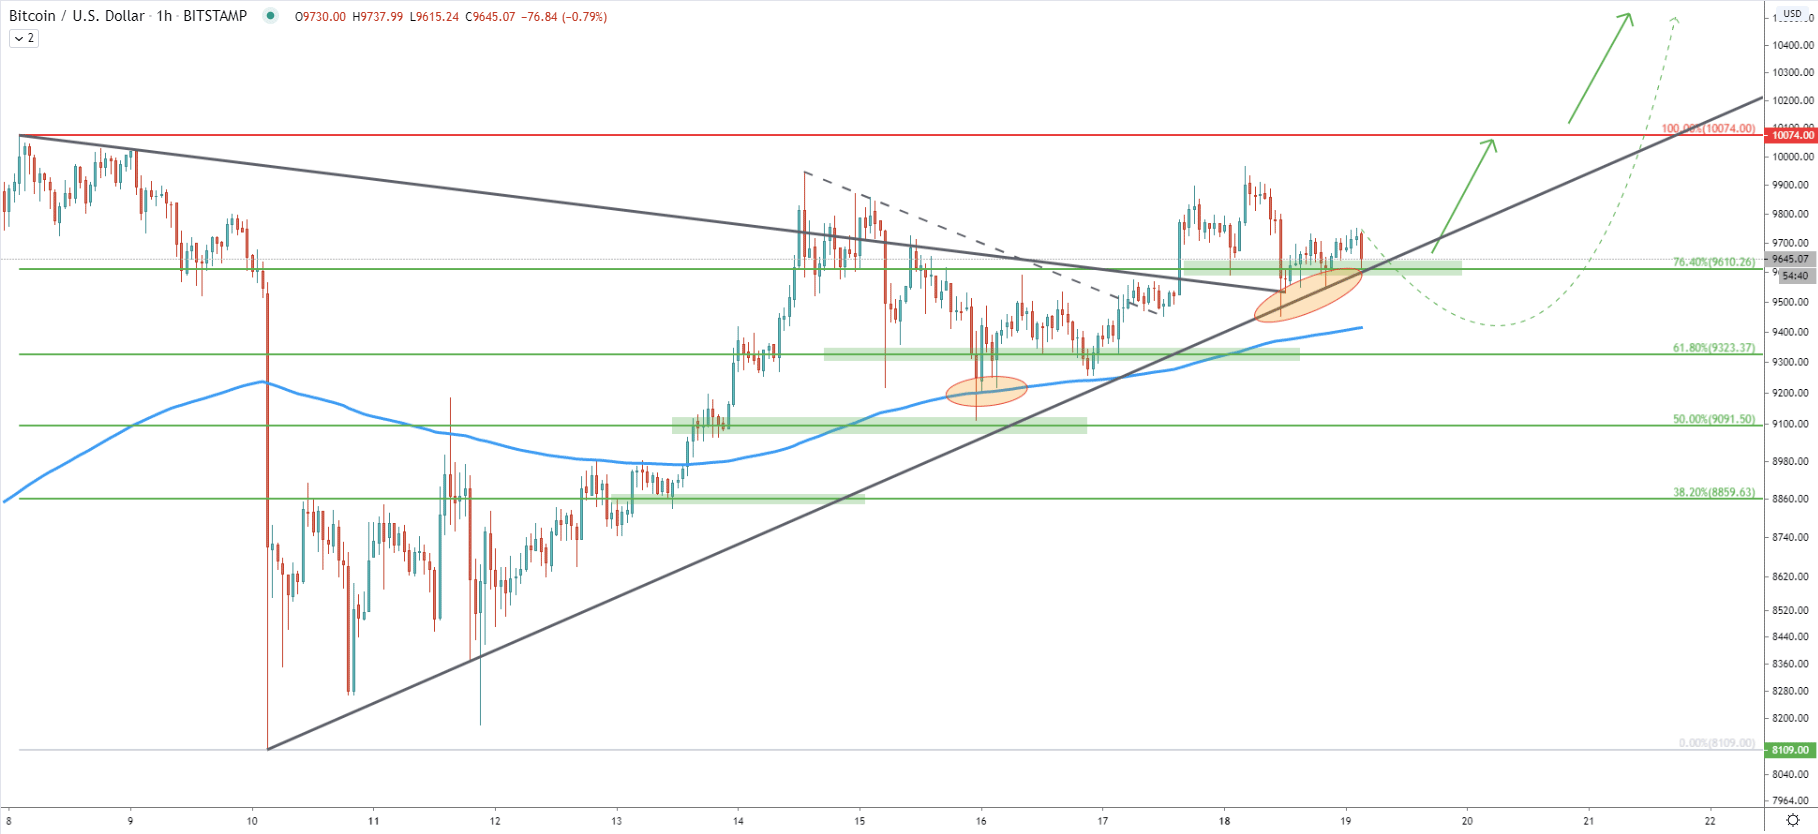
On the 1H chart, there are similarities to the 4H chart, where uptrend trendline is being rejected along with the bounce off the 200 EMA. At the same time, two downtrend trendlines were already broken, strongly suggesting incoming price growth in the short term.
Bitcoin has approaching the point where the price is expected to start moving exponentially. The price action on multiple timeframes is in favor of this move to be heading north, rather than south.
As per the Daily chart, there are 4 major upside targets, all of which are based on either 1 or 2 Fibonacci retracements. These levels are: 24150, 40600, 56700, 73600
As per the monthly chart, the support is seen at $8600 although the price has produced the spike lower, hitting $8109. The daily break and close below $8109 will invalidate expected uptrend and is likely to prolong the consolidation phase can even result in price re-testing the $4000 support area.
Support: 9610, 9320, 9090, 8600
Resistance: 10000, 13880, 20000