Published: April 27th, 2021
Bitcoin and other cryptocurrencies faced a bullish momentum as soon as Tesla bought $1.5 billion worth of Bitcoin. Later on, the price tumbled due to the Crypto ban news from Turkey. Moreover, the sell-off was boosted by Tesla’s reveal of 10% of its Bitcoin sell in March. As a result, the BTCUSD price moved lower along with other crypto-assets that shocked the crypto community.
However, the price turned back and managed to have a daily close above the $50,000 level, with a positive tone of Elon Mask saying that he is holding his personal BTC investment.
As the price had a strong bullish daily close above the $50,000 level, it may move higher in the coming days. What else we can expect from the price? Let’s find the upcoming price direction from the Bitcoin technical analysis!
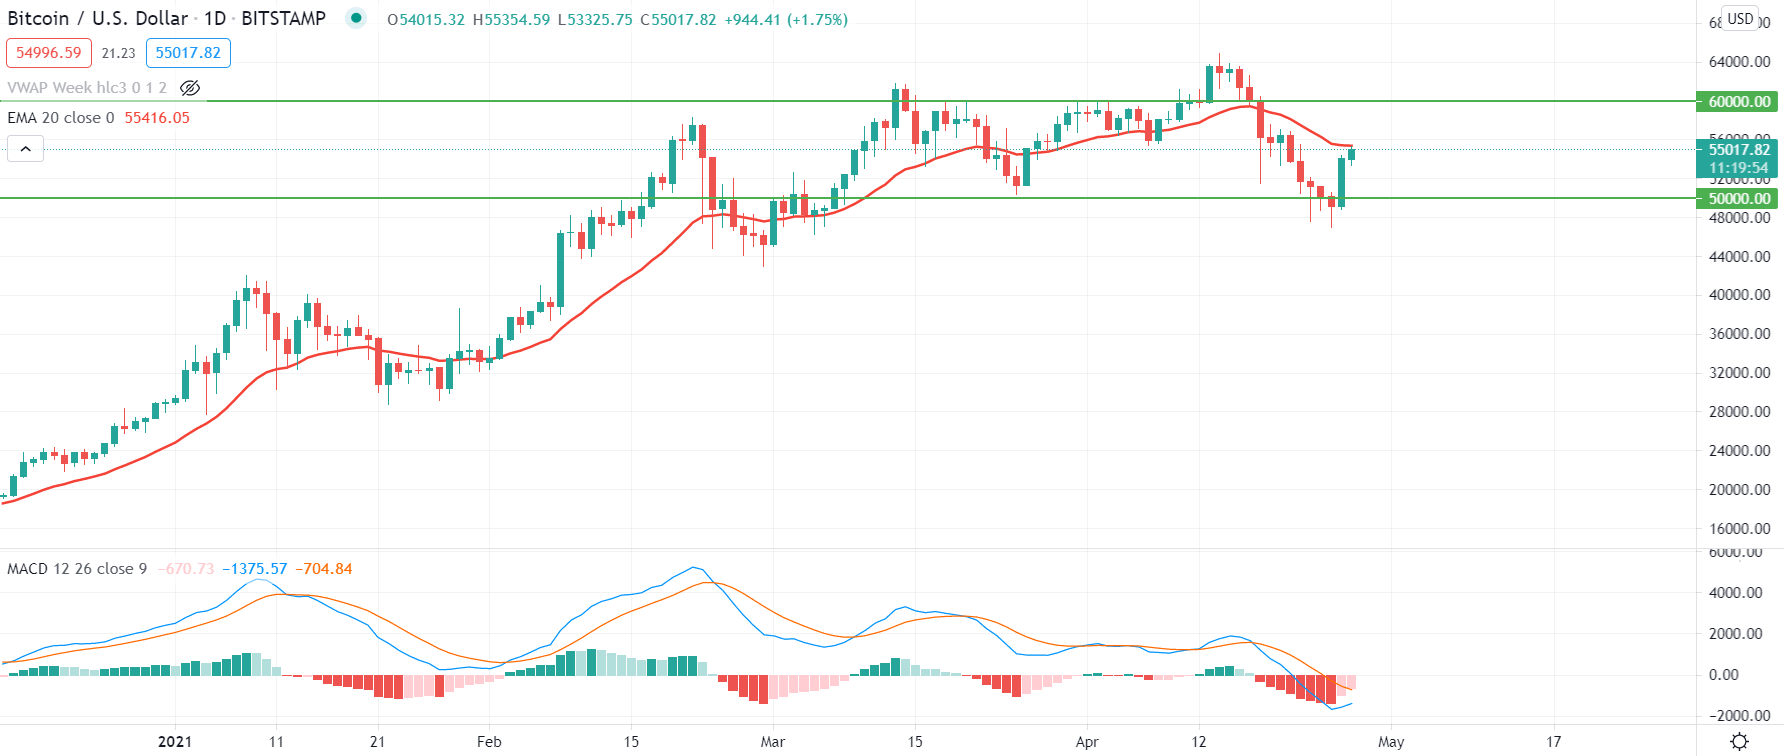
BTCUSD price is moving higher as soon as it broke above the $40,000 level on 8 February with an impulsive bullish pressure. After that, the price showed some volatility but never came back to that level. As a result, the price made an all-time high at $64,823.89 level before pushing lower below the $50,000 level.
In the above image, we can see the daily chart of BTCUSD where the price became very corrective at the $50,000 level. Later on, a strong bullish daily close above the $53,000 level indicates that bulls are still active in the price. However, the price is currently facing a dynamic resistance from 20 EMA at the $55,000 level.
Therefore, investors should see how the price reacts on this level. Any bullish daily close above the $55,000 level may take the price towards the $60,000 level, even higher. On the other hand, the price is supported by MACD, where Histograms are still bearish but squeezing to the zero levels. In this condition, a daily close above the dynamic 20 EMA with at least one positive Histogram may increase the bullishness in the price.
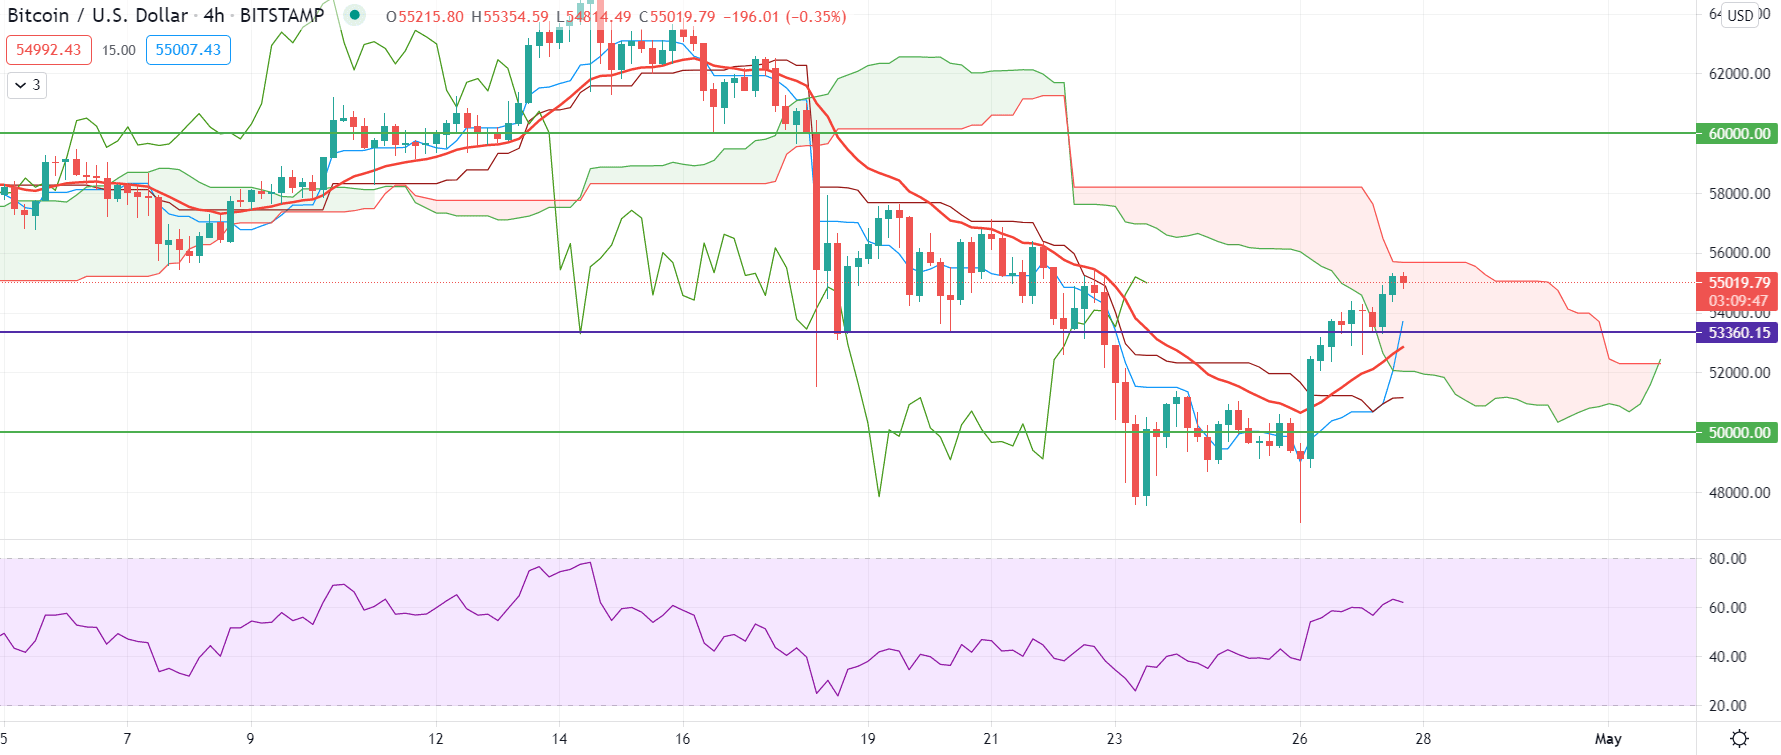
Bitcoin became very volatile at the $50,000 level. Despite the bearish continuation form at the $50,000 level, the price made a strong bearish rejection at the $48,000 level and pushed higher with an H4 close above Tenkan Sen and Kijun Sen.
As the price made a strong H4 close above dynamic levels, the market sentiment changed from bearish to bullish. Later on, the price became stable above the $53,360 intraday event level.
Senkou Span A started to move above the Senkou Span B in the future cloud, indicating a shift in trend. Moreover, there is a Golden cross in Tenkan and Kijun line with the Chikou Span above the price.
However, the price is still within the Kumo Cloud, where any bearish rejection from the $53,360 event level with an H4 close above the Kumo Cloud may initiate a bullish rally. Besides, RSI is still bullish at 60 levels and it may move higher above the 80 levels in coming sessions.
Conversely, a strong bearish H4 close below the $53,360 may alter the current market structure. In that case, the price may come down lower below the $48,000 level.
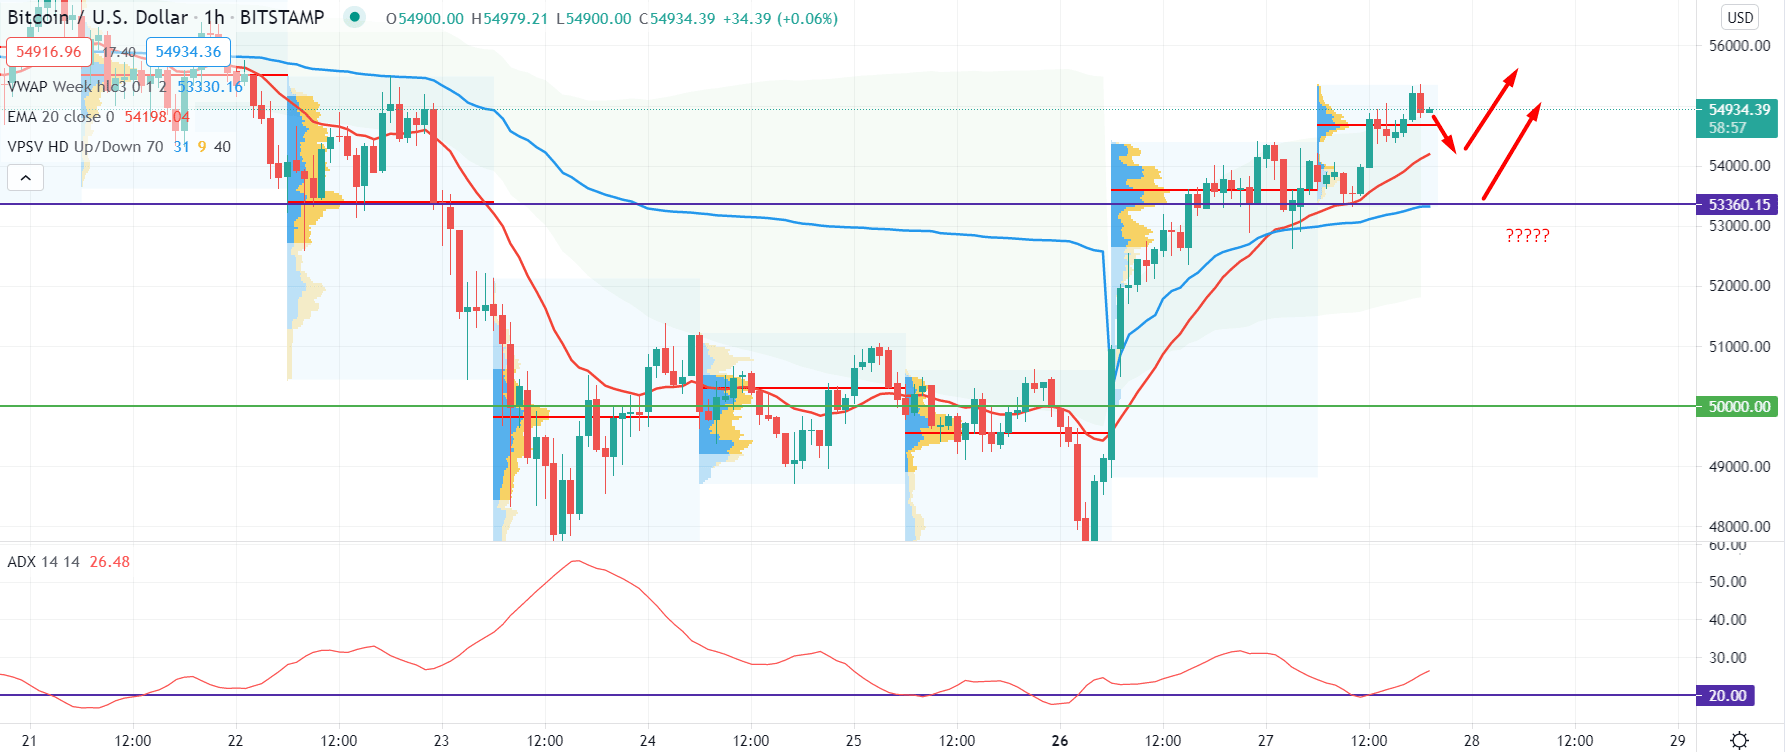
BTCUSD is strongly bullish at the H1 chart with a PBB formation in the intraday volume profile. The price is trading above the recent strong volume level of $53,602, which is just above the $53,360 event level.
Therefore, based on the intraday volume profile, the price has a higher possibility to continue the bullish pressure as long as it is trading above the $53,602 level. Besides, the dynamic 20 EMA is above the intraday event level and working as minor support to the price. Moreover, the weekly vwap is also below the price and pointing dynamic support at the event level. Therefore, the intraday $53,360 event-level became significant with the support of volume level and vwap.
Currently, the price became corrective at the $55,000 level that may initiate a short-term bearish correction. However, as long as the price has multiple support at the intraday event level, the outlook would be bullish. Moreover, the ADX is pushing higher above the 20 levels, indicating buyers’ dominance in the price.
Conversely, if the price became below the $53,360 level with a strong H1 close, investors should wait for an H4 close. Otherwise, any bearish rejection from $53,360 would increase further bullishness in the price.
As of the above discussion, we can say that the BTCUSD has a higher possibility to continue the bullish pressure towards the $60,000 level. The bullishness in the price will remain active as long as the price is trading above the $53,360 event level.
Any bearish daily close below the $53,360 would invalid the current bullish pressure. In that case, the price may come lower below the $50,000 level and even more.