Published: August 26th, 2020
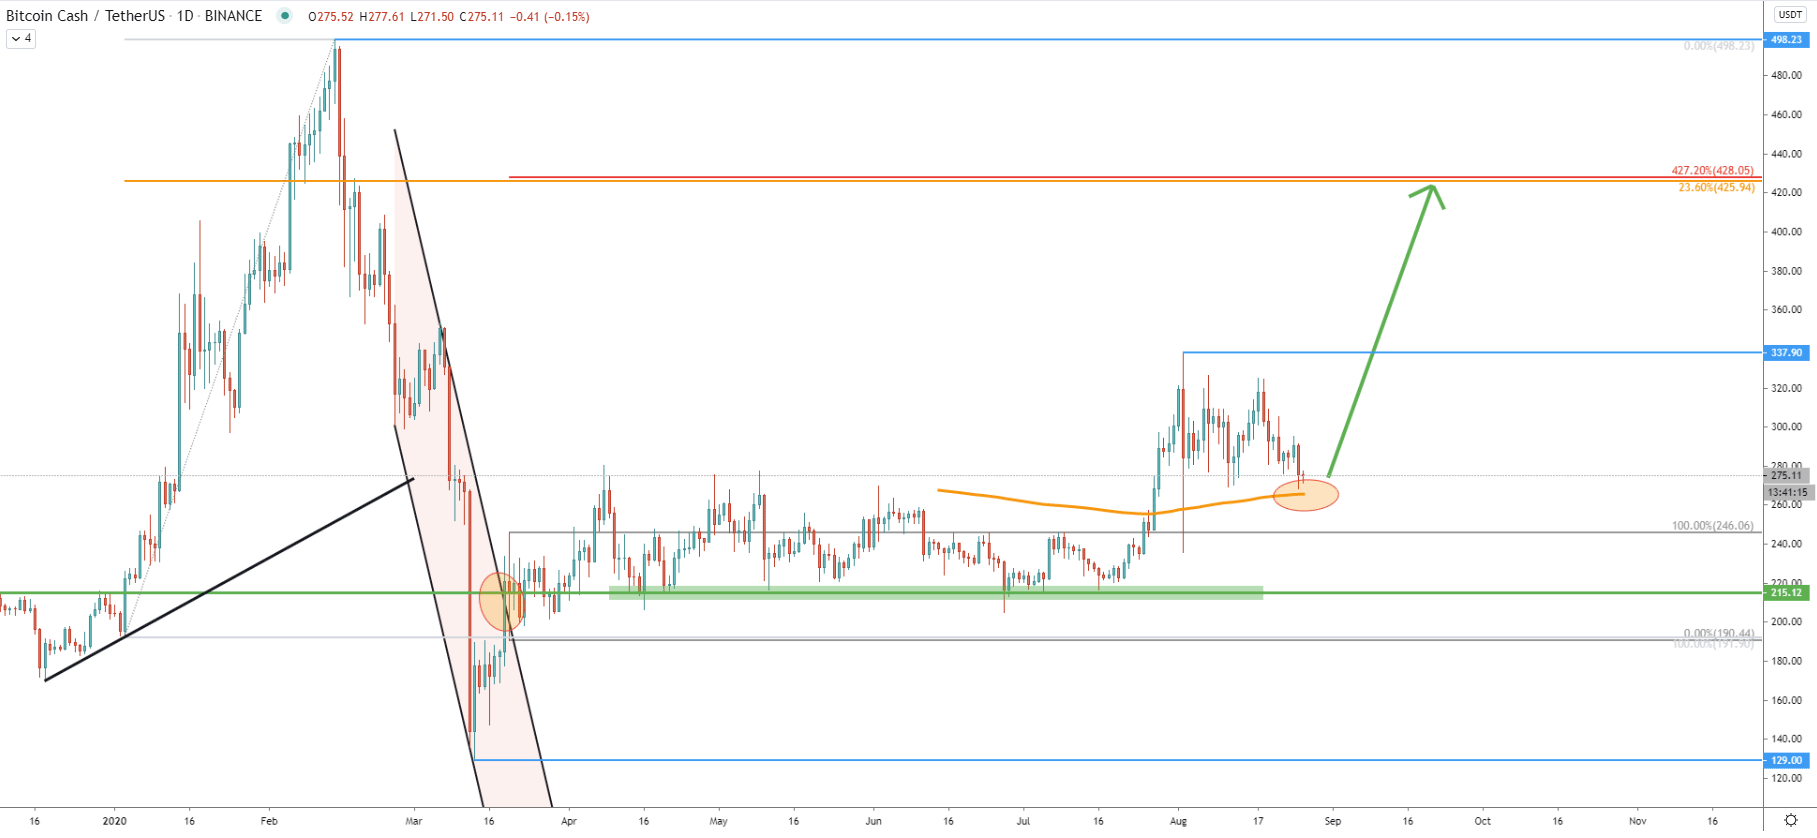
In the daily timeframe, Bitcoin Cash has established an uptrend as the price has started to produce higher highs and higher lows and remains above the 200 Exponential Moving Average. Between April - August 2020, BCH/USDT formed very strong support at $215, which has been rejected at least 4 consecutive times and clearly corresponds to the breakout point of the descending channel. The last rejection occurred on July 16, when the price bounced off the $215 level. Then Bitcoin Cash went up sharply and tested $337 high on August 2.
Price broke above the 200 EMA and on current correction the EMA is acting as the support, providing a buying opportunity for the long term traders and investors. As long as price remains above the EMA, BCH/USDT should be expected to rise, potentially towards the $425 resistance area which is confirmed by 23.6% and 427.2% Fibonacci retracement levels.
While the price was bouncing off the support, Bitcoin Cash formed a triangle pattern, which was broken on July 28. On the corrective move down there was a clear rejection of the 50% Fibonacci retracement level at $277. Price attempted to break below, although only managed to produce spikes lower.
The triangle downtrend trendline is currently acting as extremely strong support and the price already bounced off several times. At this stage, the price can easily start moving to the upside, although it might also spike down to test the EMA before/if the uptrend continues.
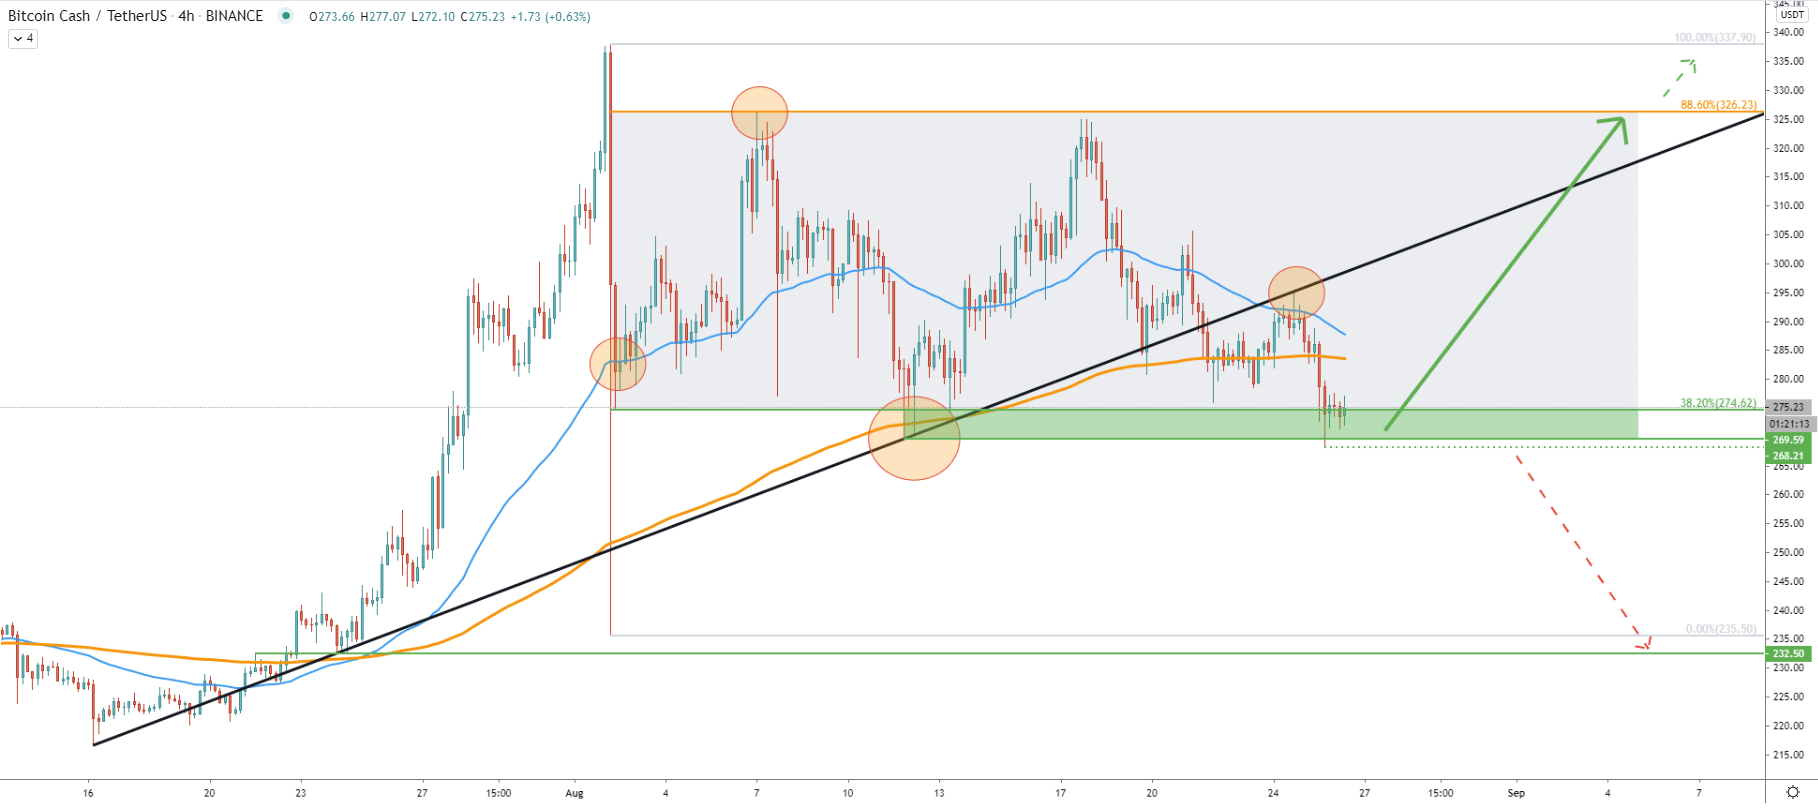
On the 4-hour timeframe the 50, as well as 200 EMA, were not broken as both of them acted as the support and were rejected. Back on August 2, there was a huge spike below the 50 EMA, but the closing price was above. On August 11, Bitcoin Cash rejected the 200 EMA and up until now there was no break and close below $269 support, where the uptrend trendline along with the EMA was rejected.
Yesterday BCH produced a low at $268, which should play a key role in further price development. Because as long as daily close remains above this level, BCH/USDT long term uptrend continuation is imminent. Price should be aiming for the 88.6% Fibs retracement level at $326, and if broken to the upside, doors will be open for much stronger growth. In regards to the downside, daily break and close below the $ 268 support, can invalidate bullish outlook, and BCH price might drop towards the $232 support level.
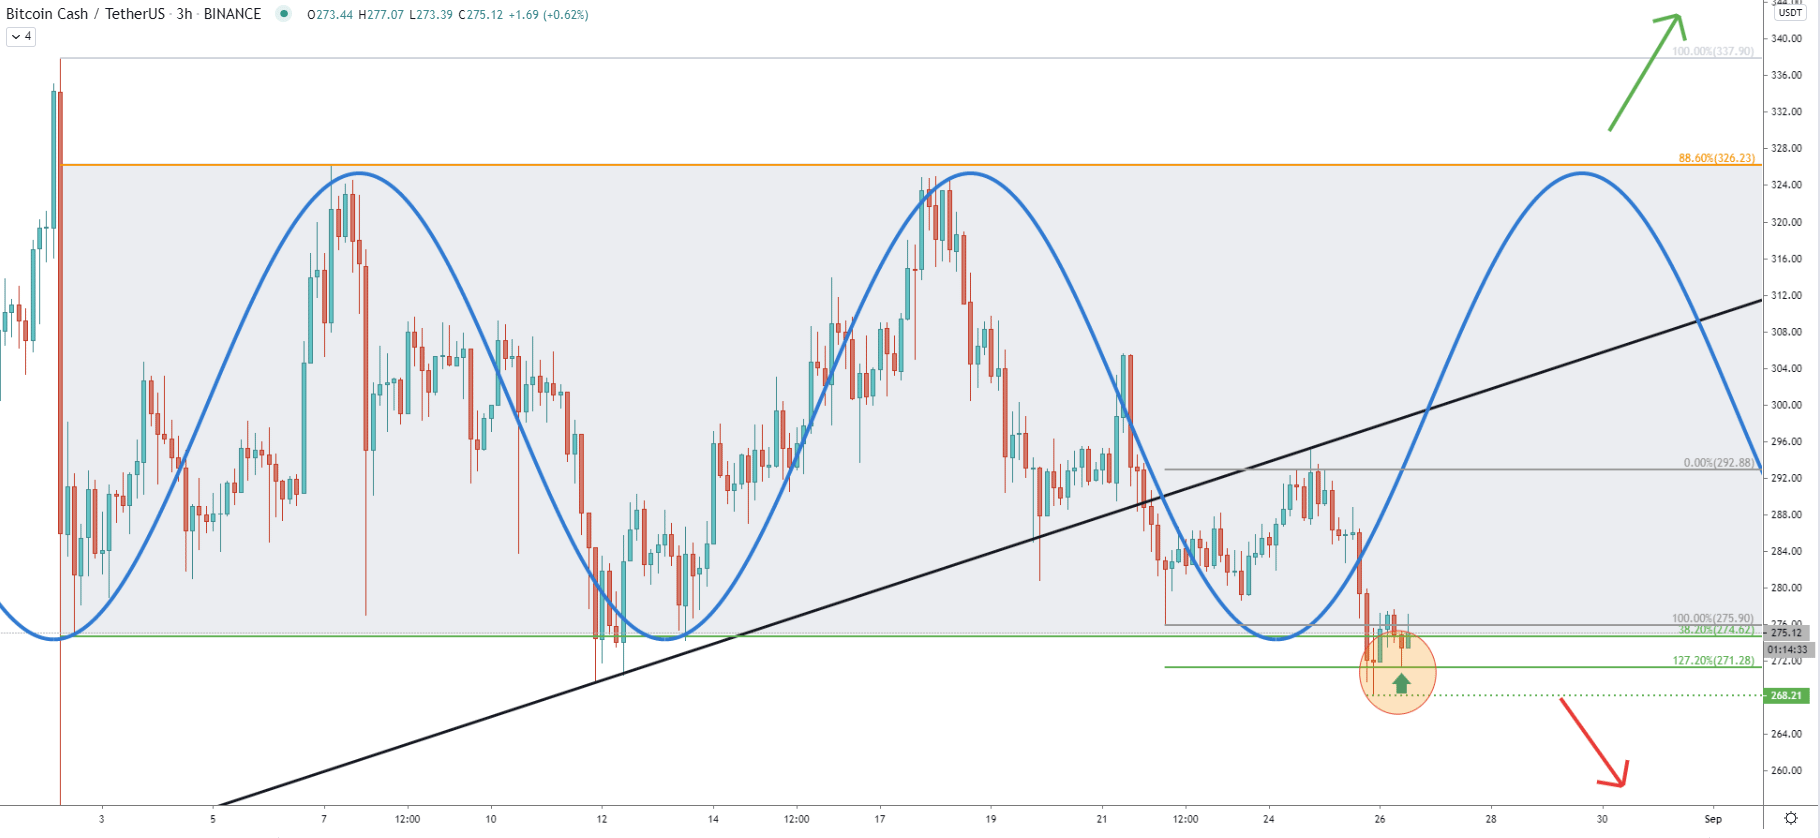
Currently, we can witness a consolidation phase before the next major move. Considering the fact the 50 and 200 EMA were rejected along with the uptrend trendline, the probability remains highly in favor of the upside move. At the same time, Fibonacci applied to the last corrective wave up shows that today price cleanly bounced off the 127.2% Fibs at $271. This certainly looks like the very beginning of another bull cycle. BCH will most likely test the $326 resistance fist, and after a short term consolidation uptrend is highly likely to continue.
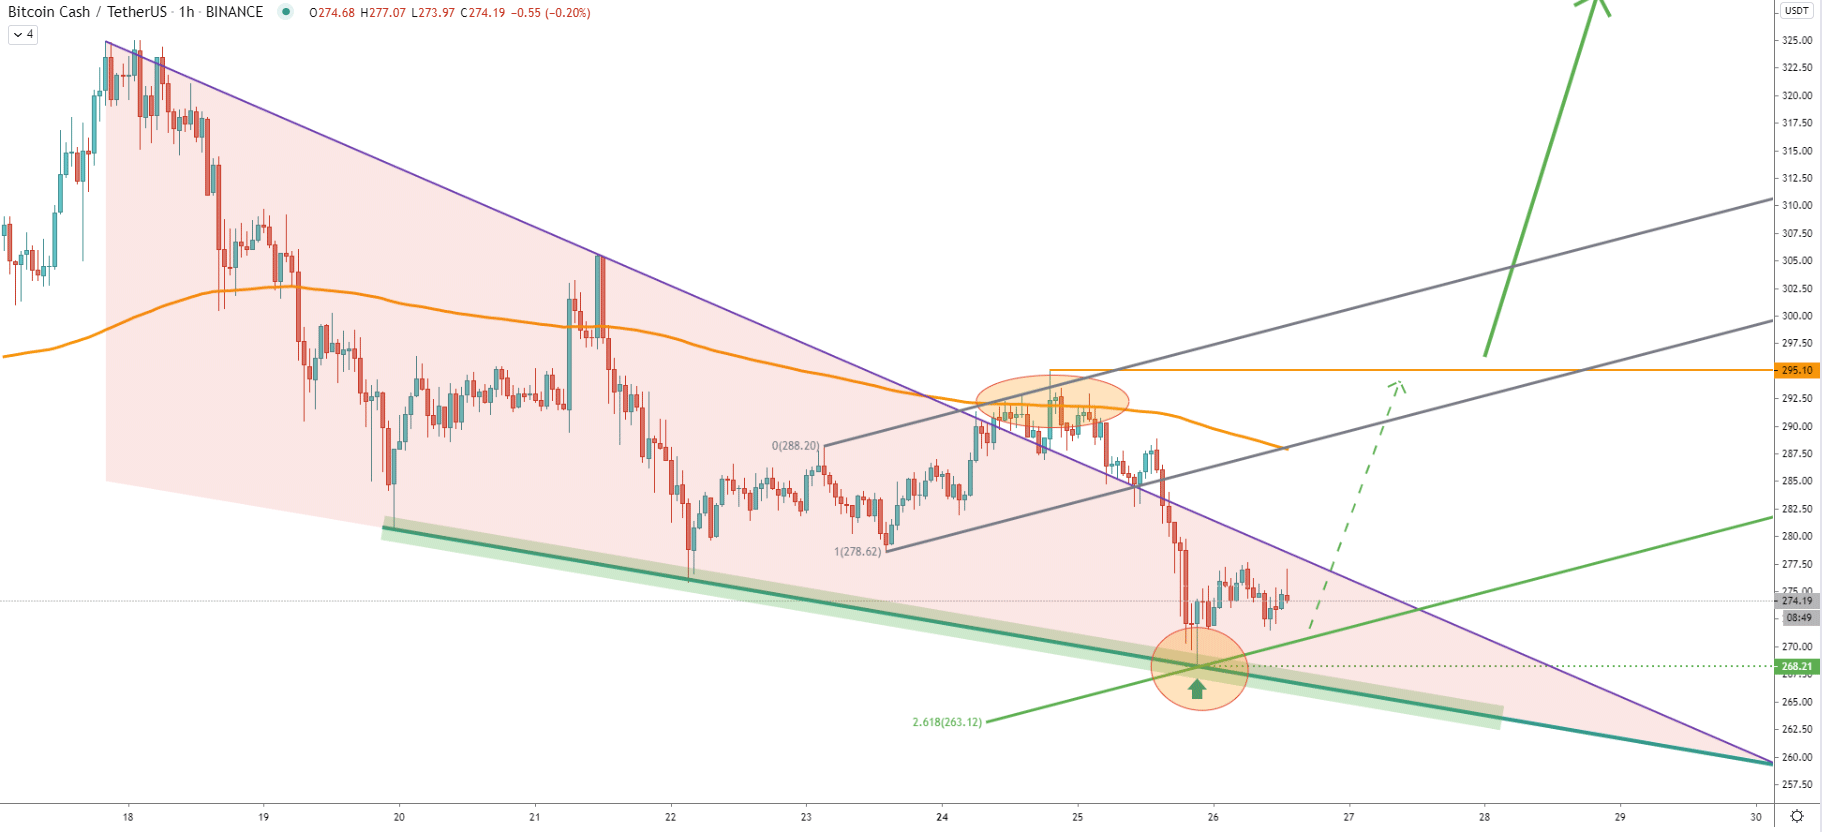
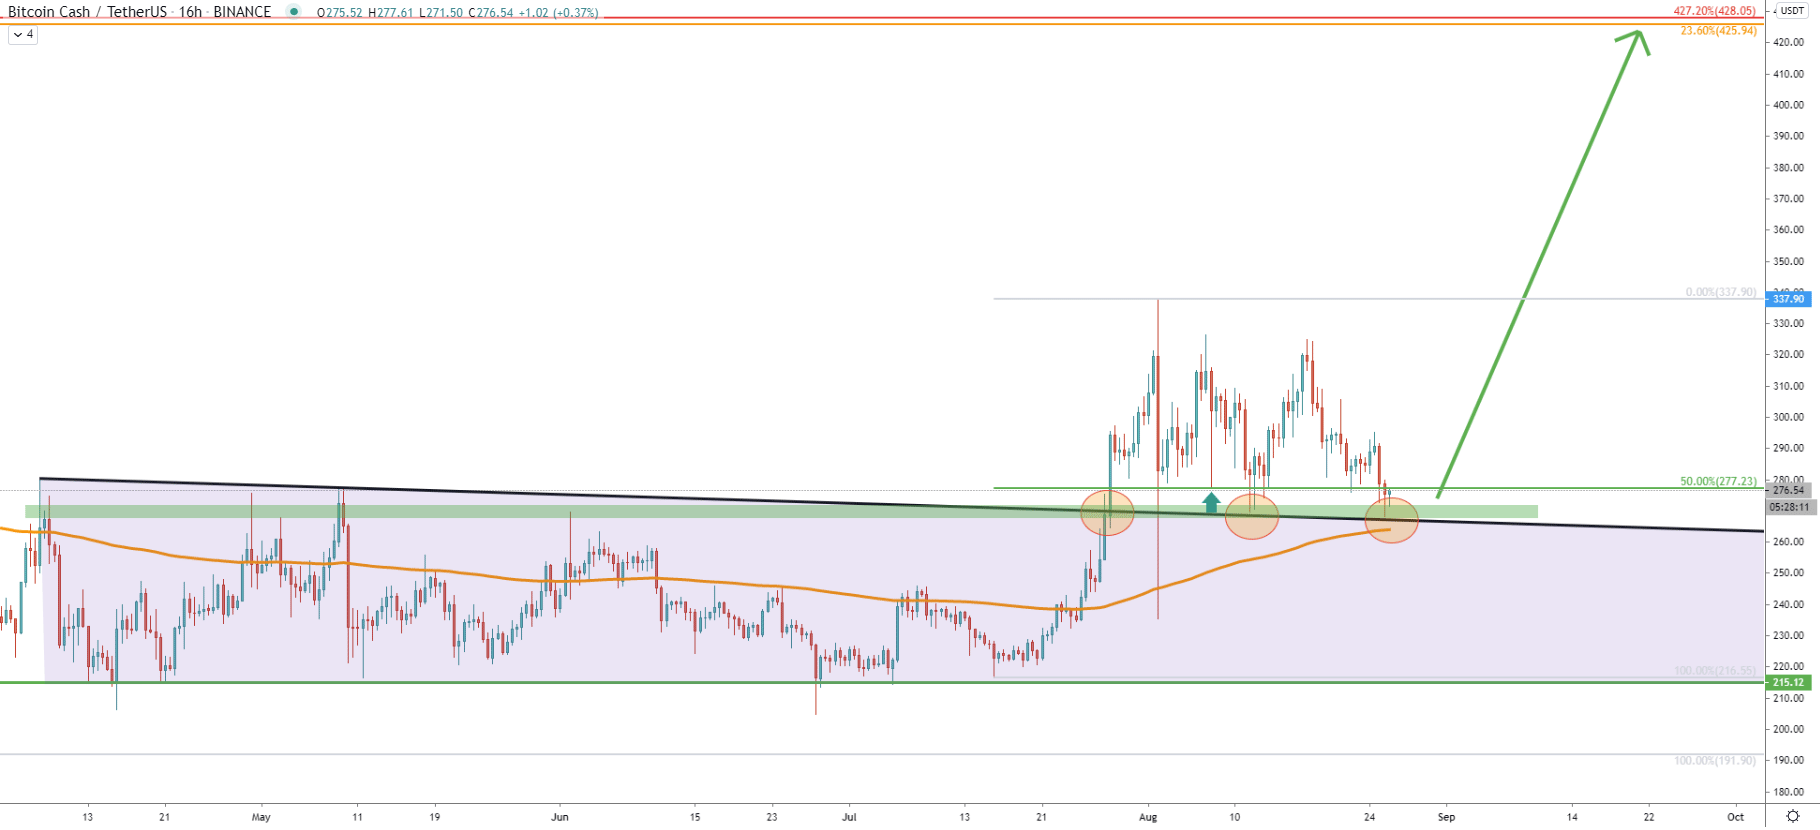
Bitcoin Cash failed to break above the downtrend trendline and the 200 EMA on the hourly chart and the price went down quite fast, testing $268 low. It rejected the support trendline and cleanly bounced off the 261.8% Fibonacci channel trendline. The nearest resistance has been formed at $295 level, and perhaps break and close above the $300 psychological resistance will be the final confirmation of a major uptrend continuation.
Bitcoin Cash is currently providing an extremely attractive buying opportunity for investors. There is a 50% growth potential in the coming weeks, while the risk can be kept to the very minimum.
As per the daily chart, the final upside target is located at $425. However, there are two major obstacles before this resistance level. The nearest one is at $295 as per the hourly chart. The next one is at $326, which is 88.6% Fibs as per the 4-hour chart. The final obstacle is obviously the most recent higher high located at $337. Upon the break and close above all the obstacles, BCH uptrend might start an exponential growth to go for the $425 key resistance.
As per the 4-hour chart, only daily break and close below the $268 will immediately invalidate bullish outlook and price will most likely continue trending down, to test $232 support.
Support: $268, $274
Resistance: $295, $326, $337, $425