
Published: July 27th, 2021
Bitcoin’s bearish pressure came with massive energy usage by miners that may harm the global energy sources. Moreover, China banned crypto-related payment services that created a devastating situation for the worldwide mining industry. As a result, the price moved down from $60,000 to $30,00 with intense selling pressure.
However, the situation changed, and investors regained faith as soon as E-commerce giant Amazon CEO spoke about making digital currencies by integrating some blockchain experts. Moreover, he focused on Bitcoin and other crypto-assets to get an idea about how they are working.
On the other hand, Tesla restarted taking Bitcoin as a payment method as miners switched to renewable energy sources. In the latest “The B-World” conference, Tesla CEO Cathie Wood and Twitter CEO spoke about the innovation of Blockchain in cryptocurrency and other sectors. When these tech people talk about a coin, people listen.
Let’s see the upcoming price direction from the Bitcoin technical analysis:
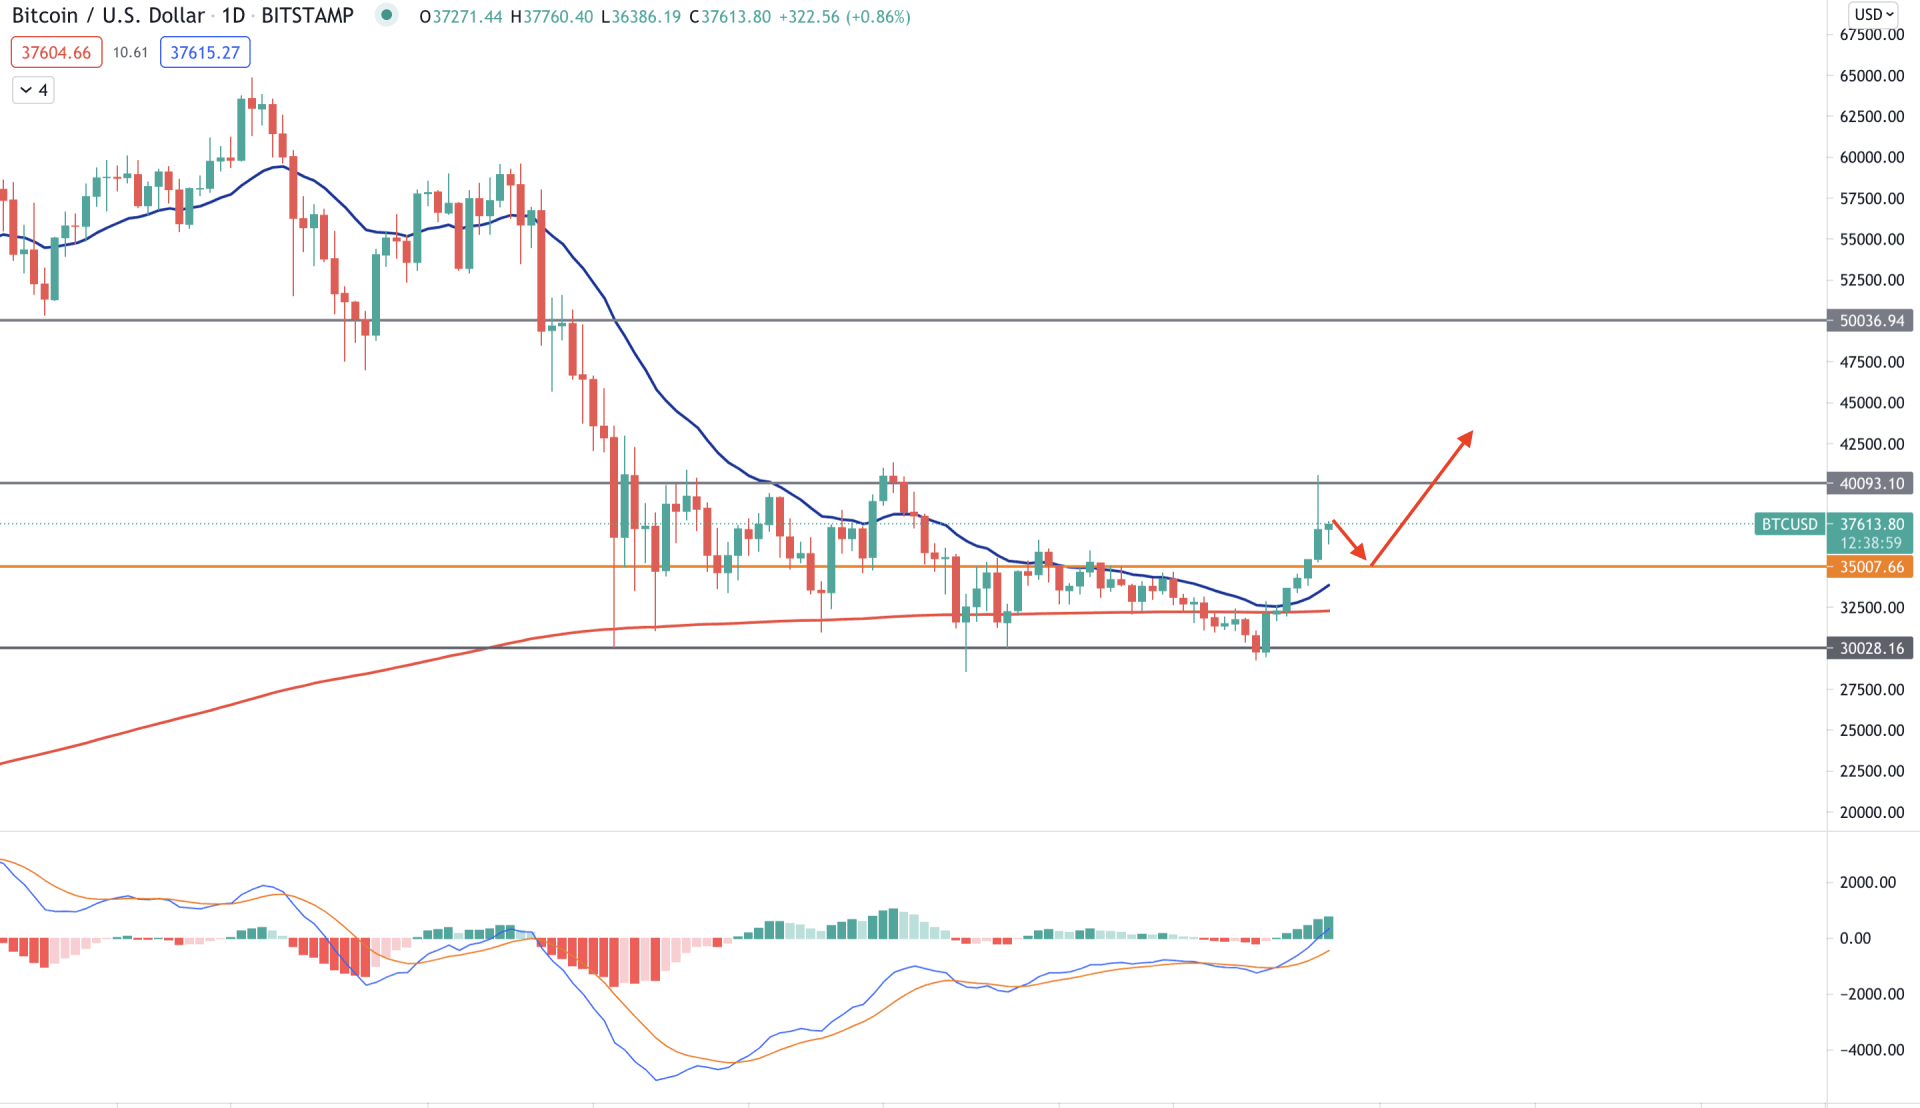
Bitcoin bears became strong as soon as the price came below the 50,000 support level. Moreover, the price was carried by dynamic 20 EMA after the bearish breakout, indicating further downside price. However, the price failed to remain strong below the 30,000 level and rejected this level several times.
Lastly, this Sunday, the price moved higher above the dynamic 20 EMA and 35,000 level with a strong bullish daily close. So, as long as the price is trading above the 35,000 level, we may consider the current market pressure bullish.
The above image shows that the price is trading above the 35,000 level where MACD Histogram is positive and making new highs. Moreover, the dynamic 20 EMA is above the 200 SMA, pointing out that short-term traders are bullish with long-term trades.
Based on this price context, the price may move higher above 40,000 level in the coming days. However, the bullish possibility is valid as long as the price is trading above the 35,000 level.
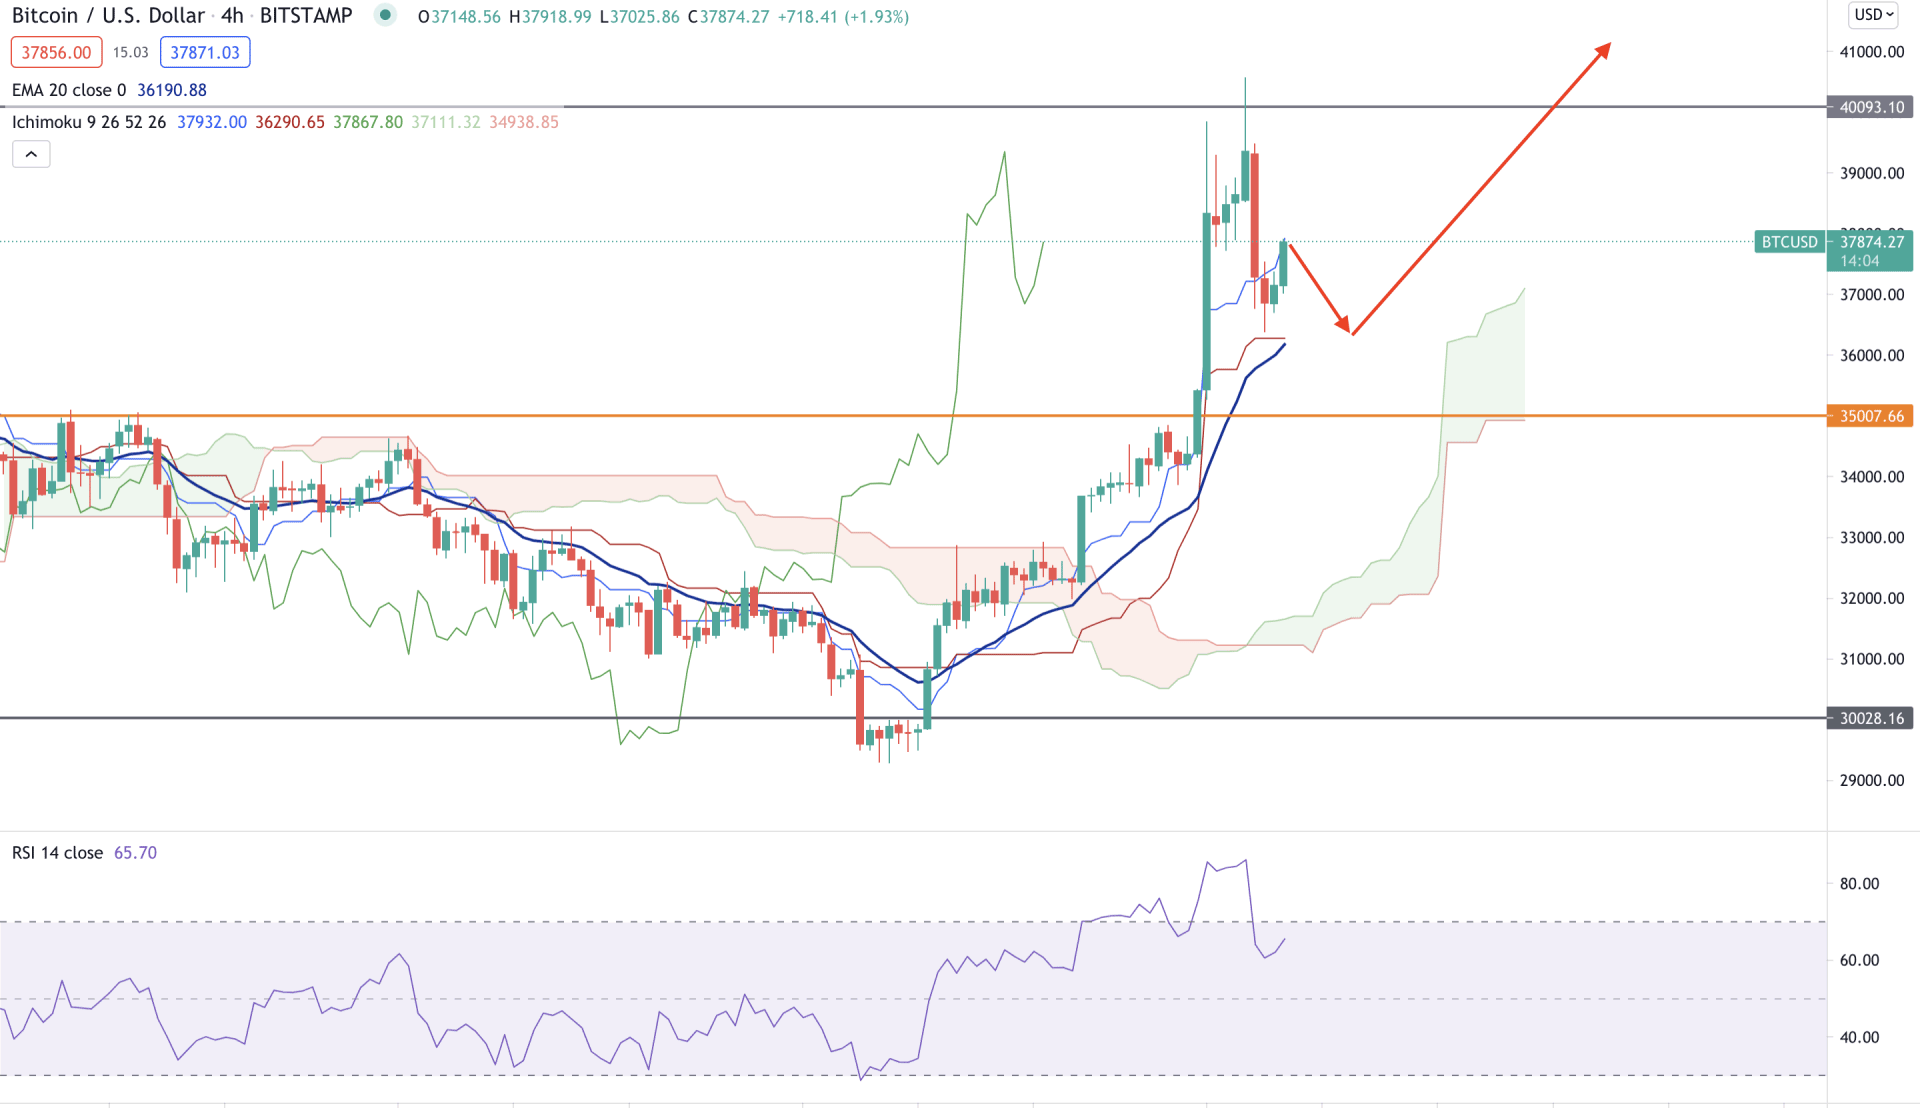
In the H4 chart, the price moved above the Ichimoku Kumo Cloud with an impulsive bullish pressure. Moreover, Senkou Span A is above Senkou Span B in the future cloud, which signifies an upcoming bullish pressure.
In the above image, we can see that the price is above the dynamic Tenkan Sen and Kijun Sen, which signifies that short-term and medium-term traders are bullish on the price. However, the price rejected the 40,000 level that may initiate a bearish correction, but the RSI level rebounded from the 60 level.
In this context, the price may correct lower towards dynamic Kijun Sen, and any rejection at the static 35,000 level may take the price higher.
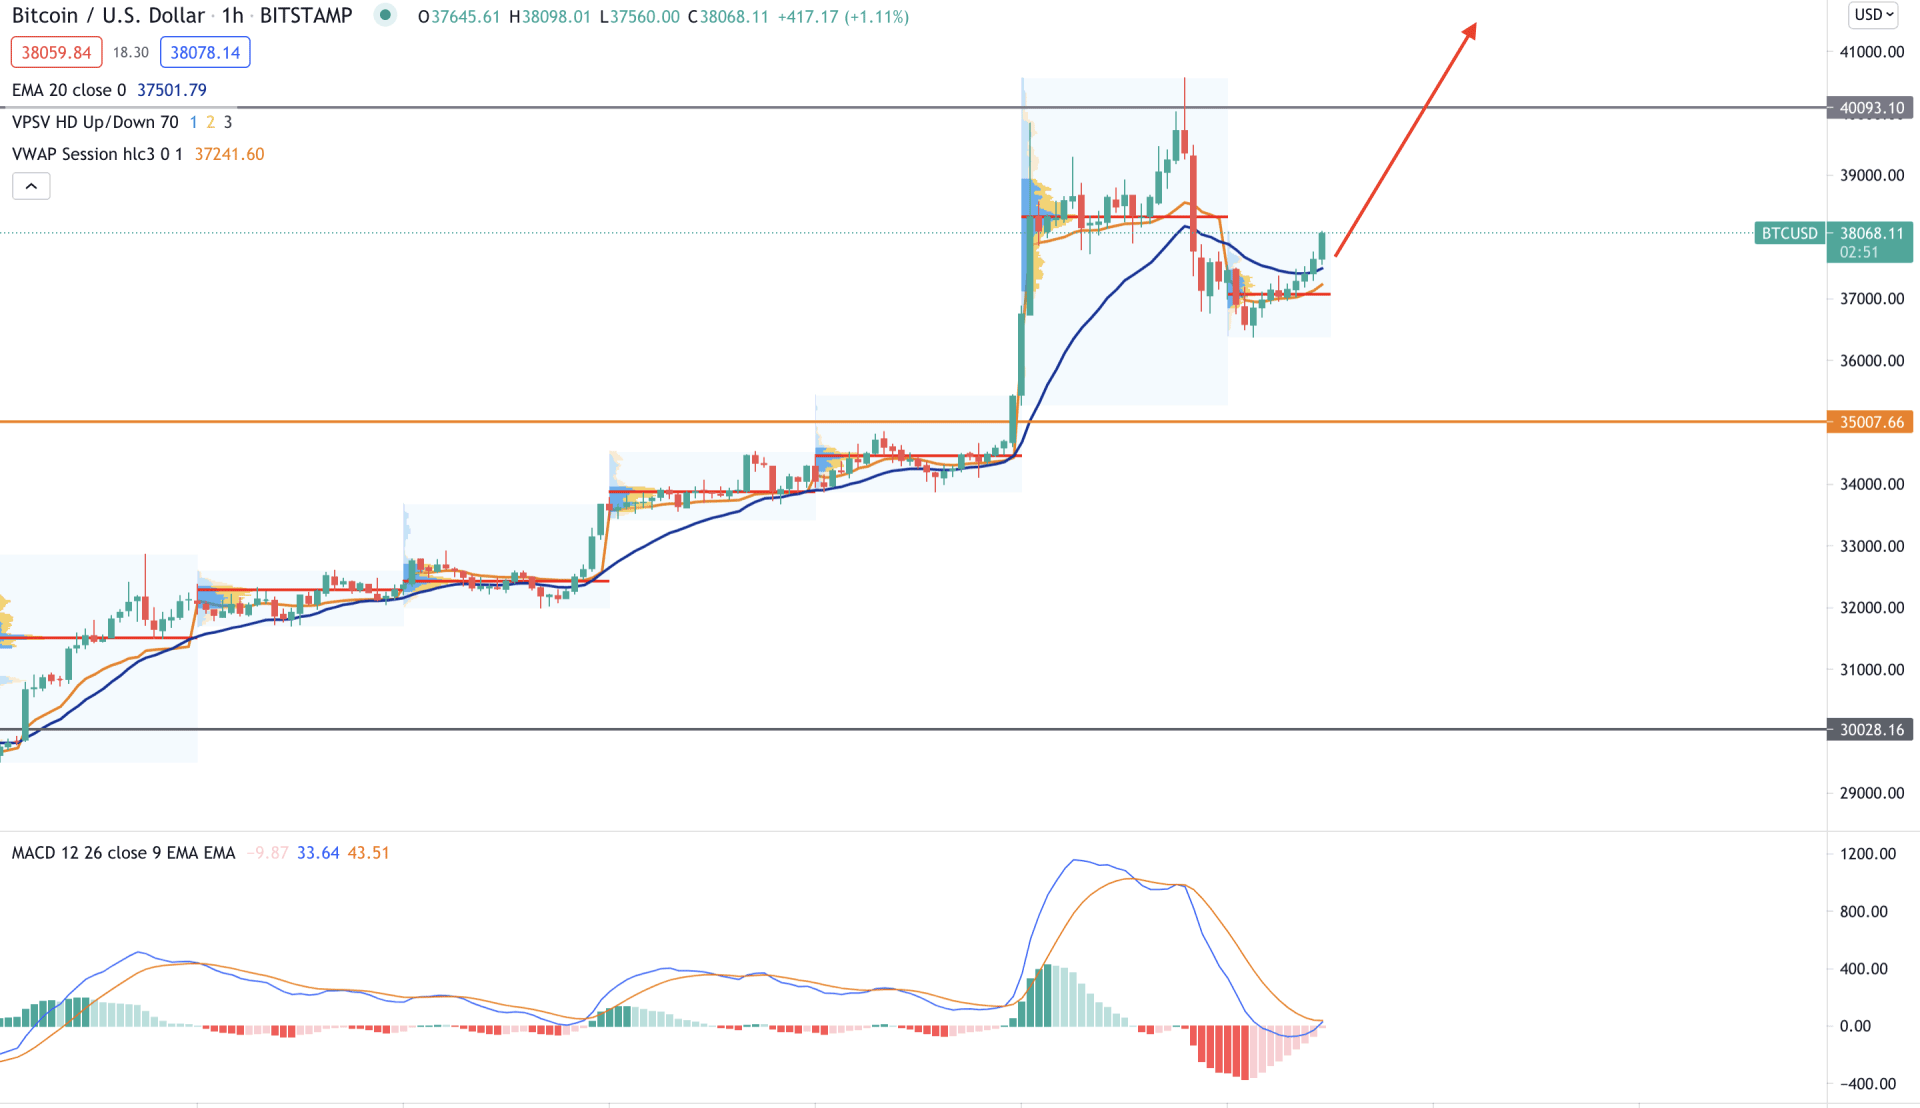
In the intraday chart, Bitcoin is moving higher, and the bullish pressure extended as soon as the H1 candle closed above the 35,000 level. Moreover, the recent hourly price is trading above the intraday high volume level of 37,044.48 level. Therefore, as long as the price is above the current intraday high volume level, it may move higher in the coming sessions.
The above image shows that the price moved above the dynamic 20 EMA and weekly vwap level while MACD Histogram is at zero level. As the price moved above the vwap and intraday high volume level, it may break above the 40,000 resistance level in the coming session.
On the other hand, a stable bearish H1 close below the 35,000 level may alter the current market structure and take the price lower towards the 30,000 level.
As per the current observation, Bitcoin has a higher possibility of continuing the bullish pressure as long as the price is trading above the 35,000 level. In that case, the primary target would be 45,000 level and 50,000 level.
On the other hand, a strong bearish H4 close below the Ichimoku Kumo cloud may create volatility to the price that may extend towards the 30,000 level.