
Published: January 13th, 2022
Bitcoin climbed above $44k for the first time this week as soon as the US inflation report increased the possibility of hedging cryptocurrencies against the rising consumer price. The price rose 3.3% on Wednesday, followed by the CPI release that climbed 7% in 2021. Therefore, the US inflation showed the biggest annual growth since 1982.
According to some analysts, the current surge in inflation is not unexpected, and the Fed should now tighten the speed. On the other hand, the increase in the interest rate would require some time to wind out of crypto assets.
It is also questionable whether investors should consider cryptocurrencies as an inflation hedge or not. However, some analysts have said that this instrument behaves like a speculative asset, and it is likely to react to events like inflation. Wednesday’s performance is a sign that the BTC price responded to the hawkish Federal Reserve, which is a positive sign.
Let’s see the upcoming price direction from the BTC/USDT technical analysis:
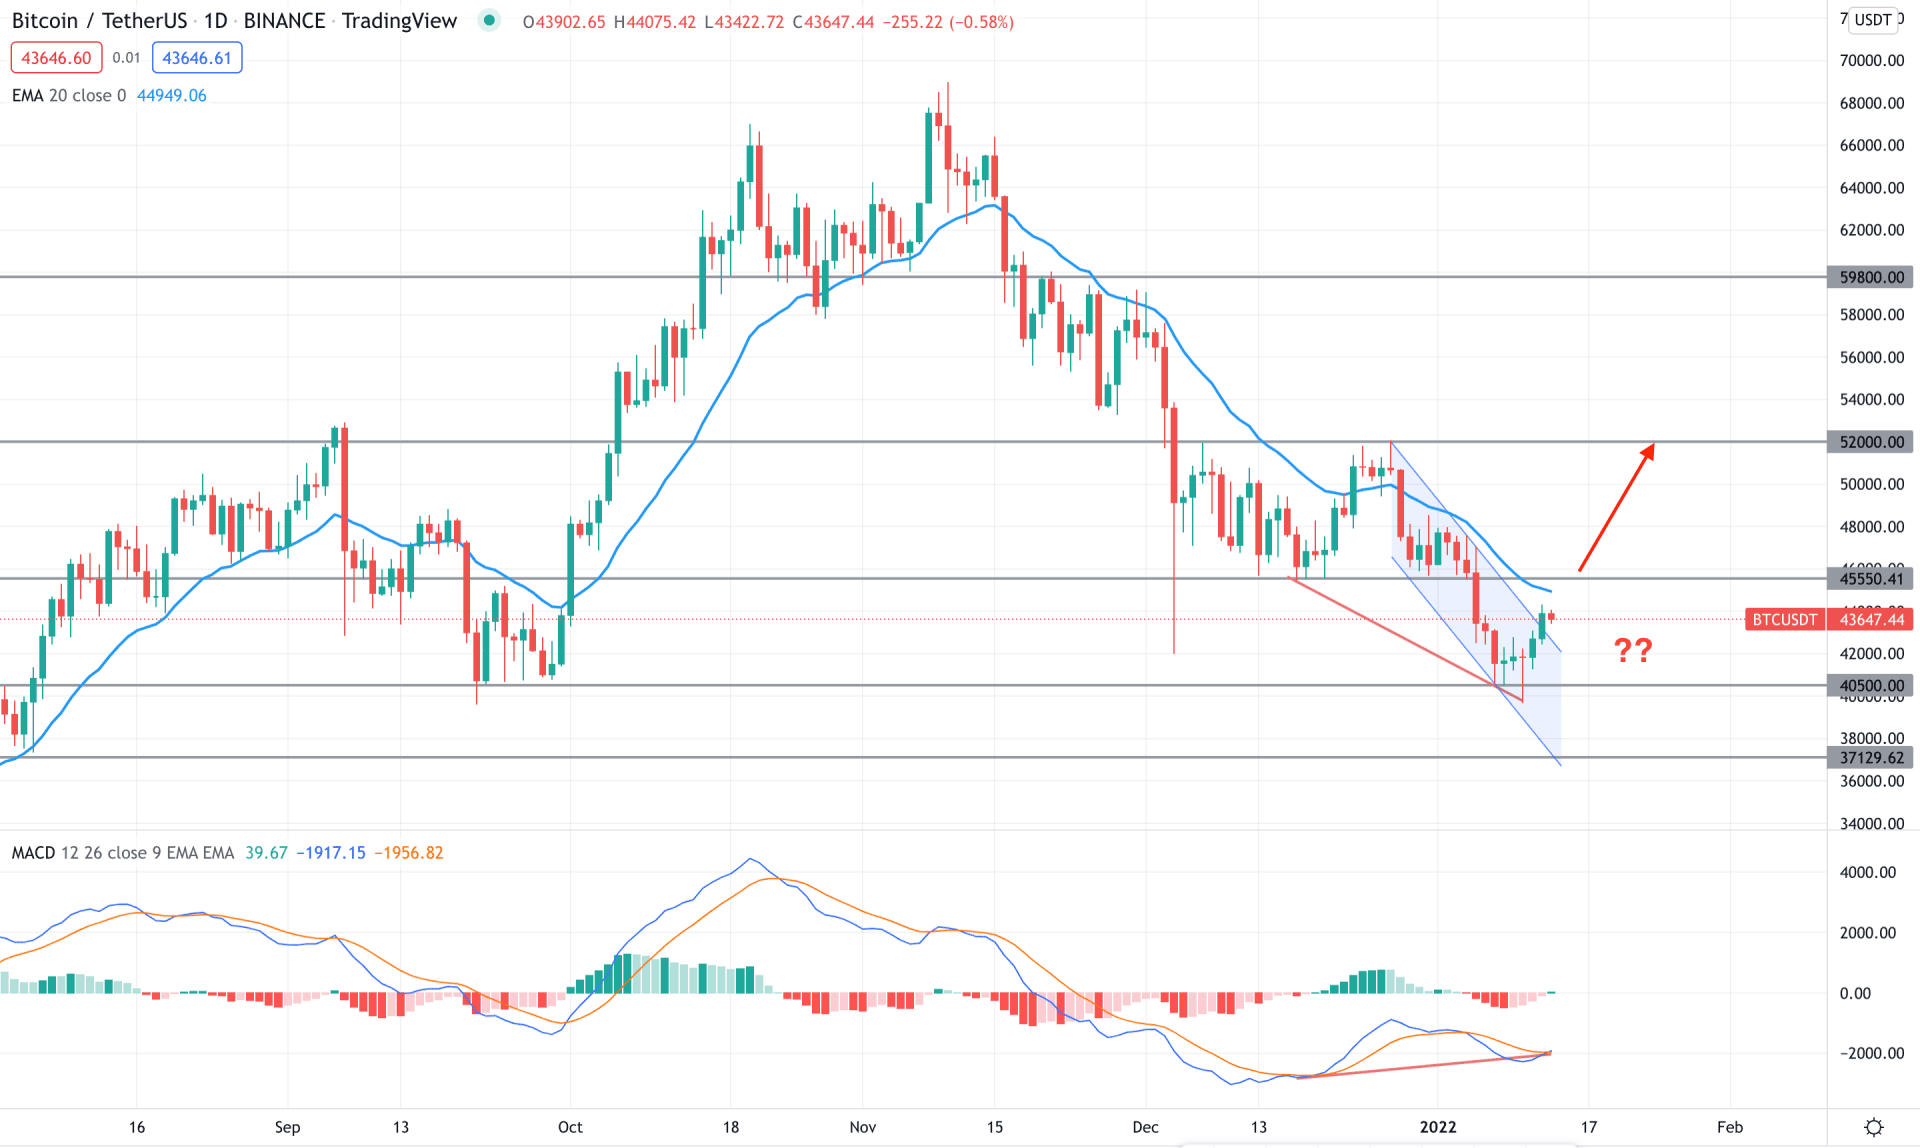
BTC/USDT has shown a bearish channel breakout in the daily chart followed by a bullish rejection from the $40k psychological level. Therefore, further bullish pressure may come in this pair if the price moves above the dynamic resistance level with a bullish daily close.
The above image shows how the price formed a divergence with the MACD line where the Histogram turned bullish. Meanwhile, the current price is below the dynamic 20 EMA and static 45,550.00 resistance level. Therefore, the buying pressure may increase if bulls overcome the dynamic 20 EMA resistance.
Based on the daily context, investors should wait for the price to close above the 45,550.00 level with a bullish daily close to see the price at the 52,000.00 level. On the other hand, a break below the 40,000.00 level with a bearish daily candle may alter the current market structure and lower the price towards the 37,129.00 level in the coming days.
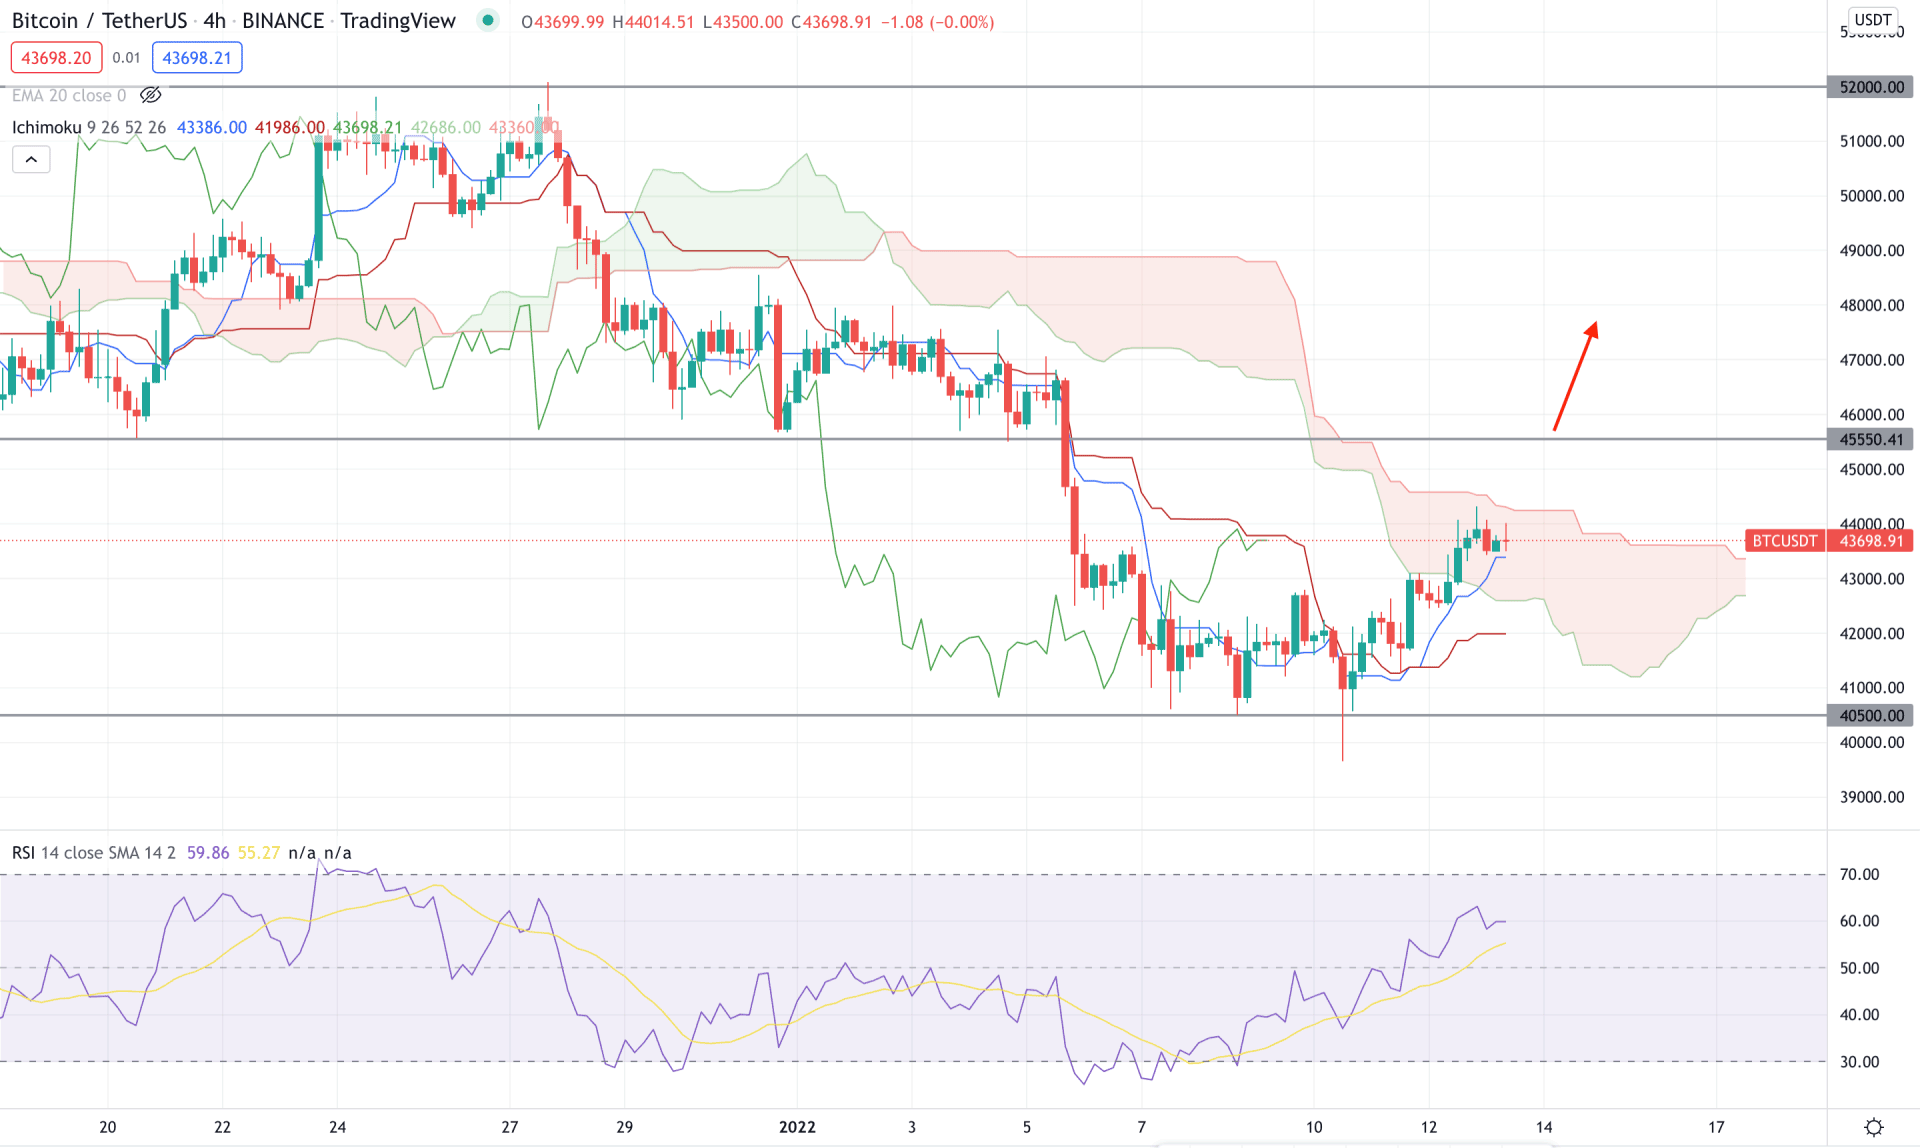
According to the Ichimoku Cloud, BTC/USDT is trading below the Kumo cloud where the current future cloud is neutral while the Senkou Span A is below the Senkou Span B and aiming lower. However, as the current price reached the 40,000.00 support level, the buying possibility is potent. In that case, investors should wait for the price to break above the Kumo Cloud with a bullish H4 close.
The above image shows that the current price moved to the Kumo cloud while the current price is above Tenkan Sen and Kijun Sen. On the other hand, the RSI is above 50 level and aiming higher, where the test of overbought 70 level would increase the buying pressure in the price.
Based on the H4 context, investors should wait for the price to move above the Kumo Cloud with a bullish H4 close relying on the possible buying pressure towards the 50,000.00 level. On the other hand, a bearish H4 close below the current Kijun Sen level may alter the existing market structure and lower the price towards the 35,000.00 level.
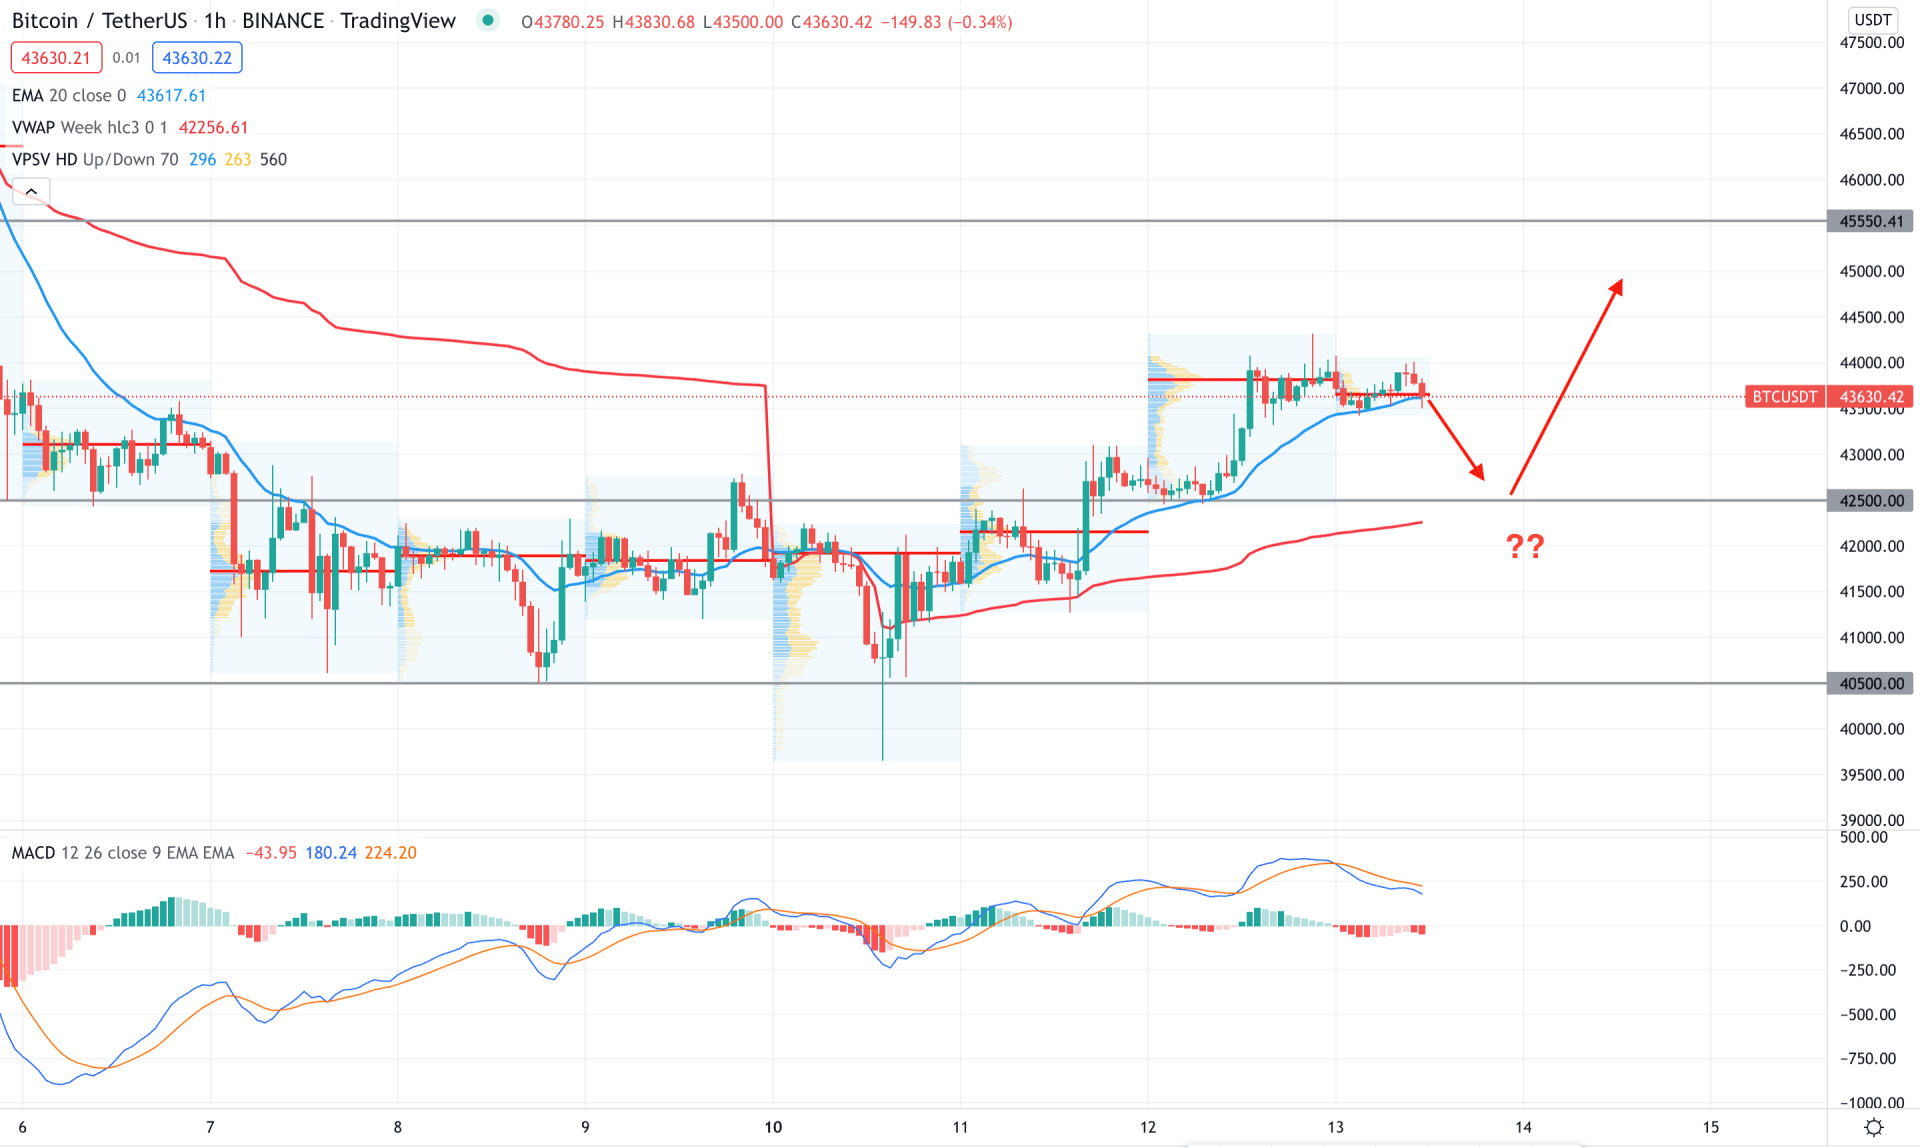
In the intraday chart, BTC/USDT is trading within a bullish pressure where the recent price showed multiple higher highs in the intraday high volume level. Moreover, the bullish rejection from the 40,000.00 level took the price above dynamic 20 EMA with strong bullish momentum.
The above image shows how the price trades correctively above the current dynamic support level while the weekly VWAP aims higher. Meanwhile, the MACD Histogram is bearish and aims lower where the price gap and dynamic VWAP are expanded.
Based on the intraday price action, any bullish rejection from dynamic 20 EMA and static 42,500.00 level would be a buying opportunity in this pair. In that case, the price may move higher towards the 45,550.00 level in the coming days. On the other hand, a break below the 40,000.00 level would alter the current market structure and lower the price in the coming hours.
According to the current observation, BTC/USDT has a higher possibility of moving up in the coming days. In that case, any bullish H4 close above the Kumo Cloud would be a buying opportunity in this pair.