
Published: March 6th, 2020
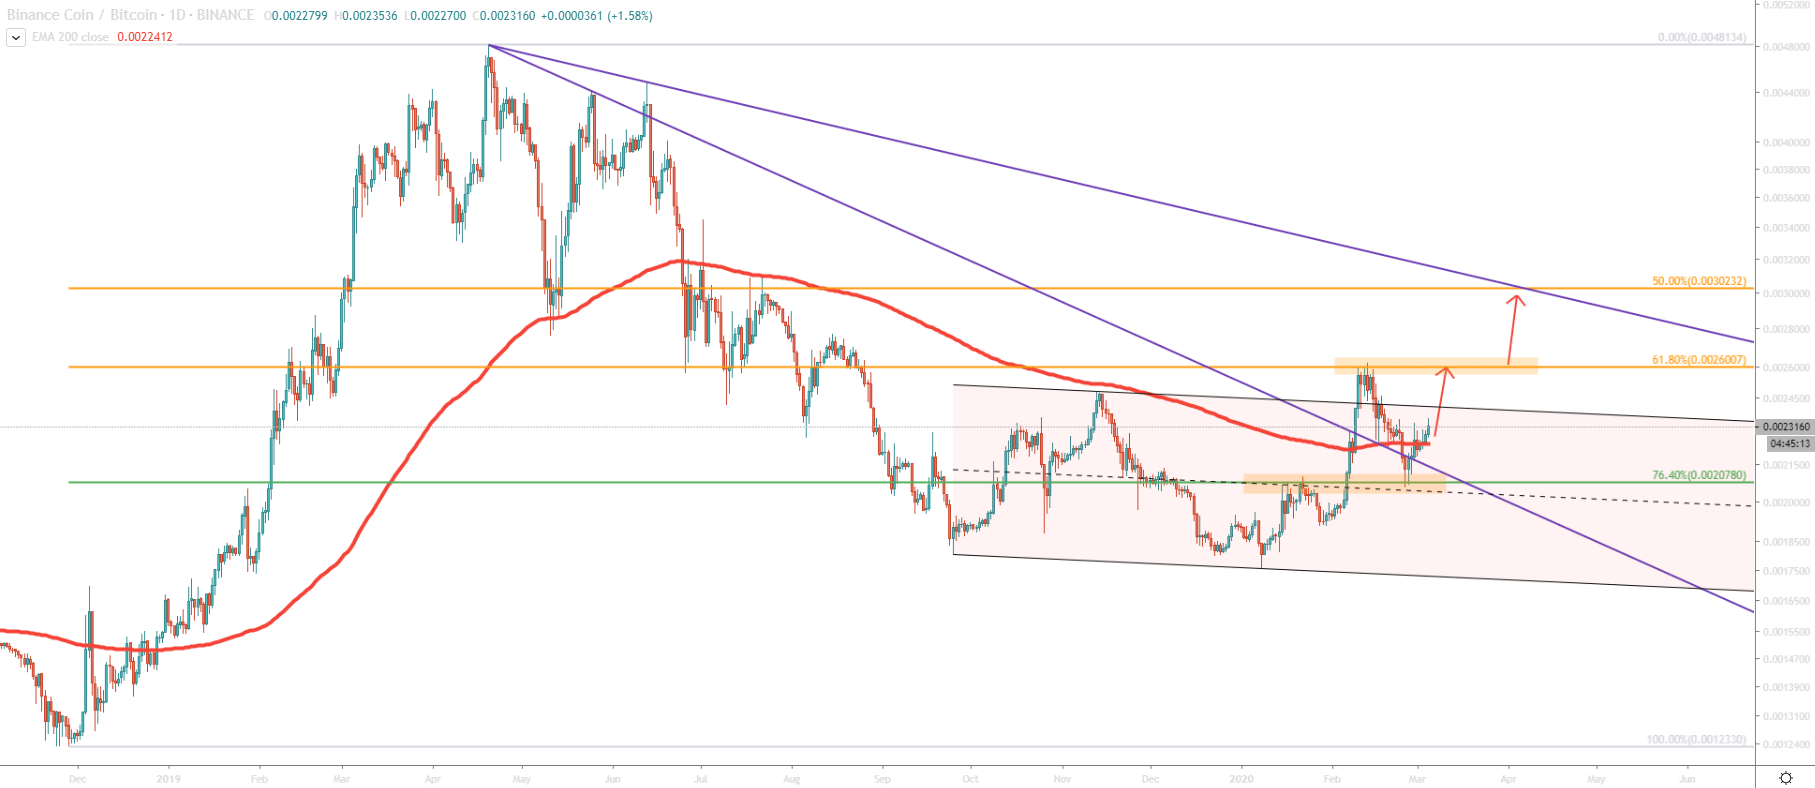
Finally, BNB/BTC broke above the 200 Exponential Moving Average on a daily chart. This is quite an achievement, considering that price stayed below for 225 Days. Fibonacci applied to the upside wave shows, that previously, the price was breaking all the support level, however recently one of them acted as the support and another as the resistance. After the 200 EMA breakout, BNB/BTC rejected the 61.8% Fibonacci retracement at 0.0026BTC. Then it moved down and rejected the 76.4% support at 0.0020. At the same time we can see the break above the downtrend trendline, yet another bullish signal, which means that eventually, BNB/BTC could rise further, towards the next Fibonacci level to test 0.0030BTC resistance.
Nevertheless, at this stage, it is likely that price will consolidate between formed support and resistance. But at the same time, break above the resistance could lead to fast growth towards 50% Fibonacci retracement level.
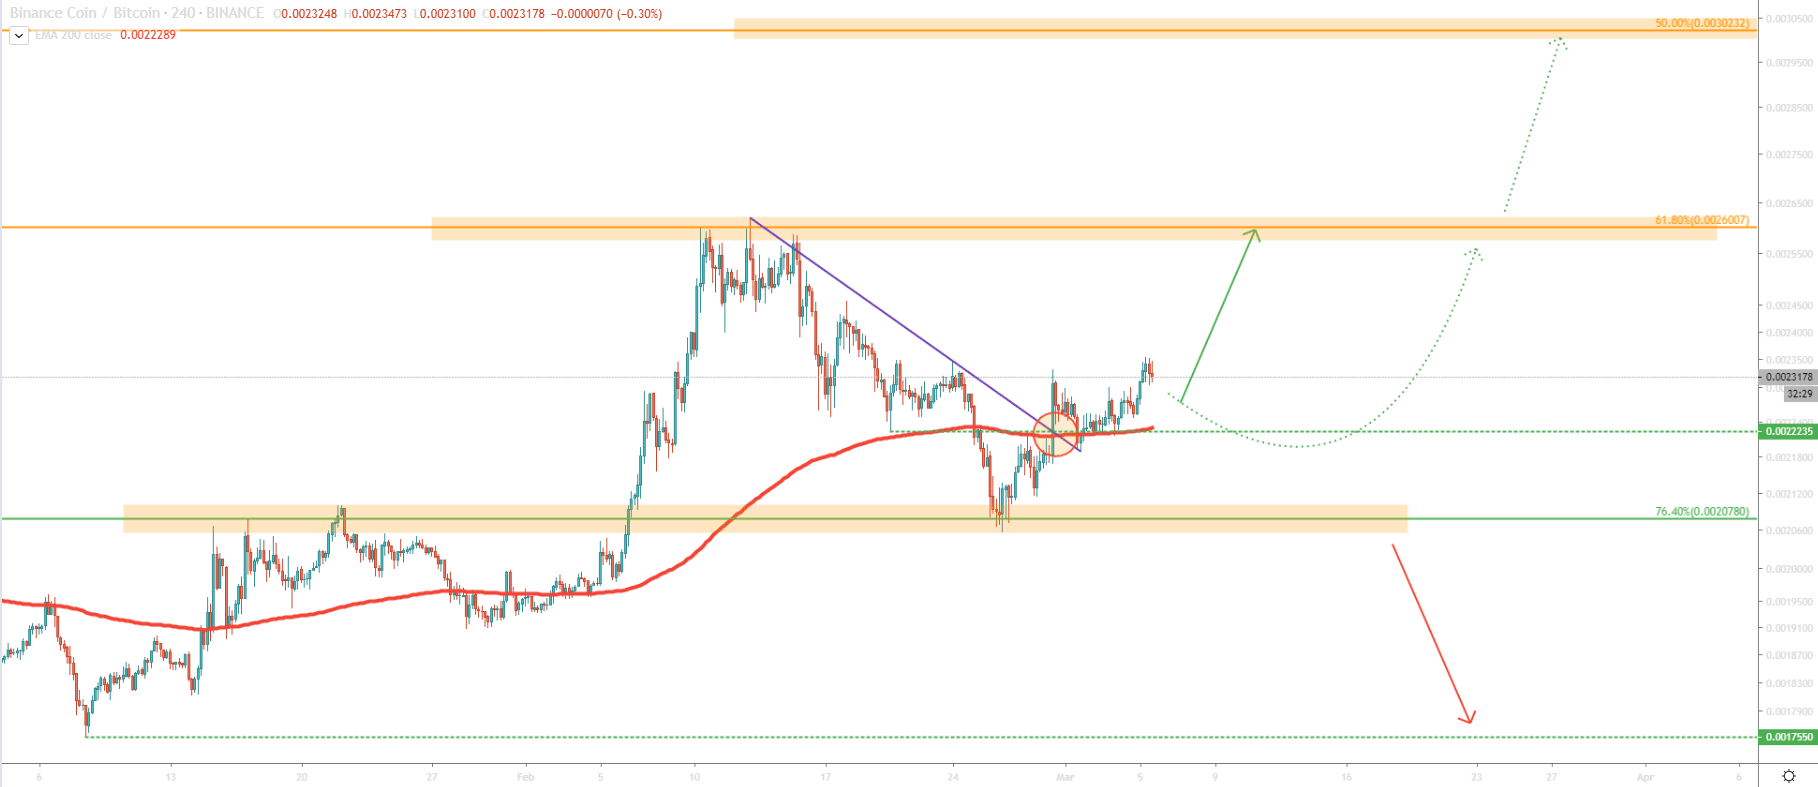
On 4H chart price broke the downtrend trendline as well as the 200 EMA. The breakout point is at 0.0022BTC, which also corresponds to the 200 EMA. At this is where BTB/BTC found the support. At this stage, there doesn’t seem to be enough buying power to push price up. This is why consolidation can be expected, although it might not last long. But at the same time, fast growth towards 0.0026BTC resistance can not be ignored.
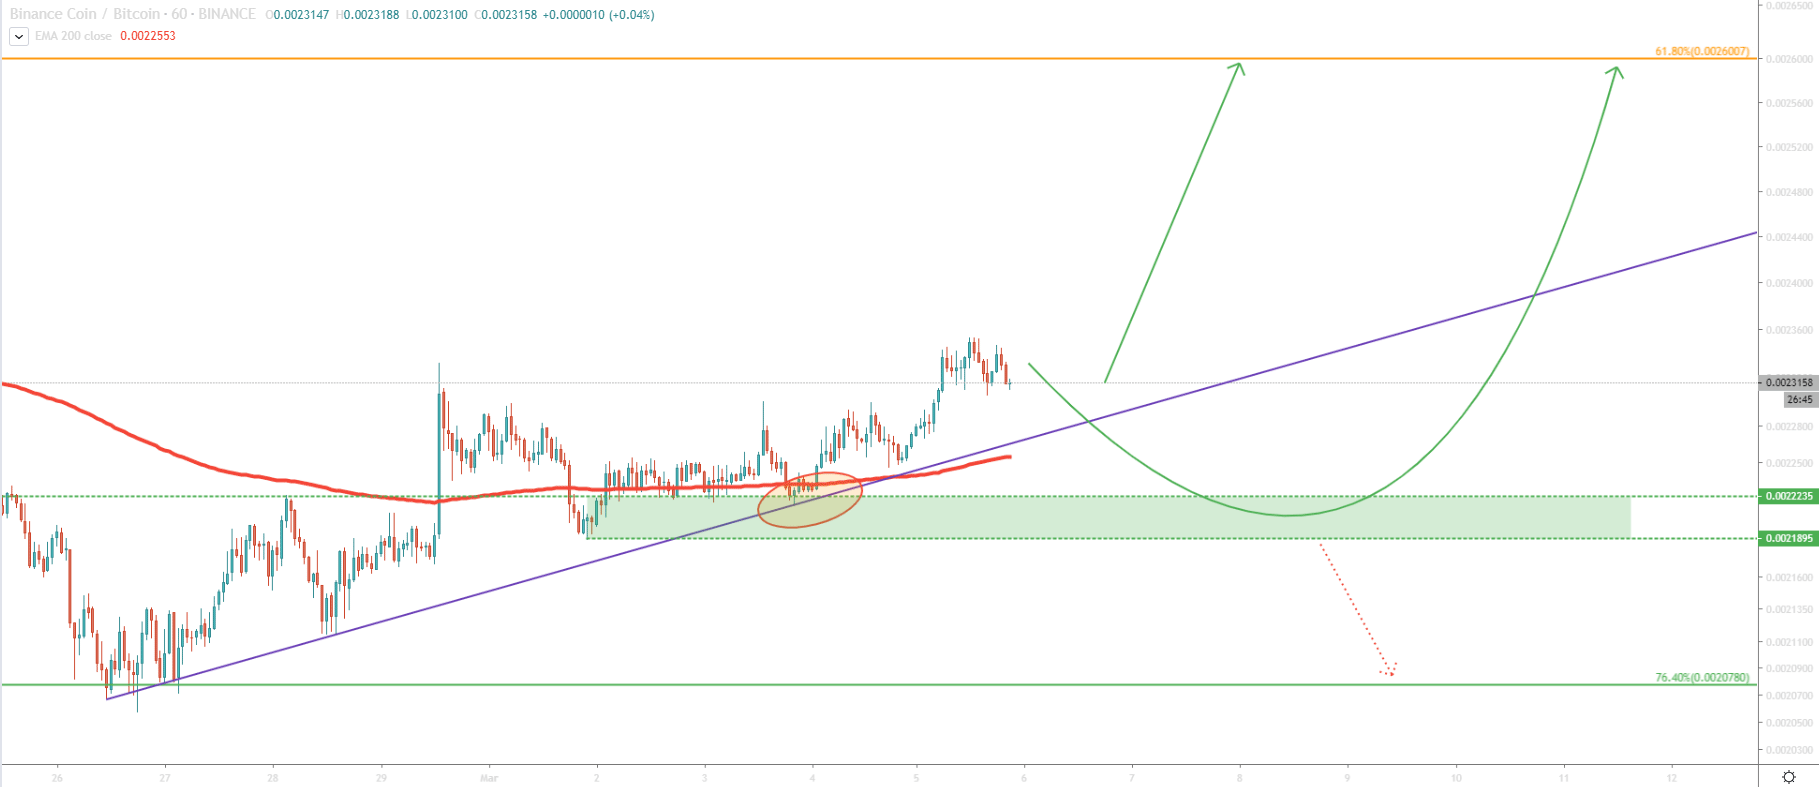
On the 1H chart, the price has rejected the uptrend trendline along with the 200 EMA. BNB/BTC is producing higher highs and higher lows, which looks extremely positive for this pair. Nevertheless, there is a support zone between 0.00219 - 0.00223, where pair can and probably should correct prior to any substantial move upwards. Buying opportunities are likely to present themselves within less than a week.
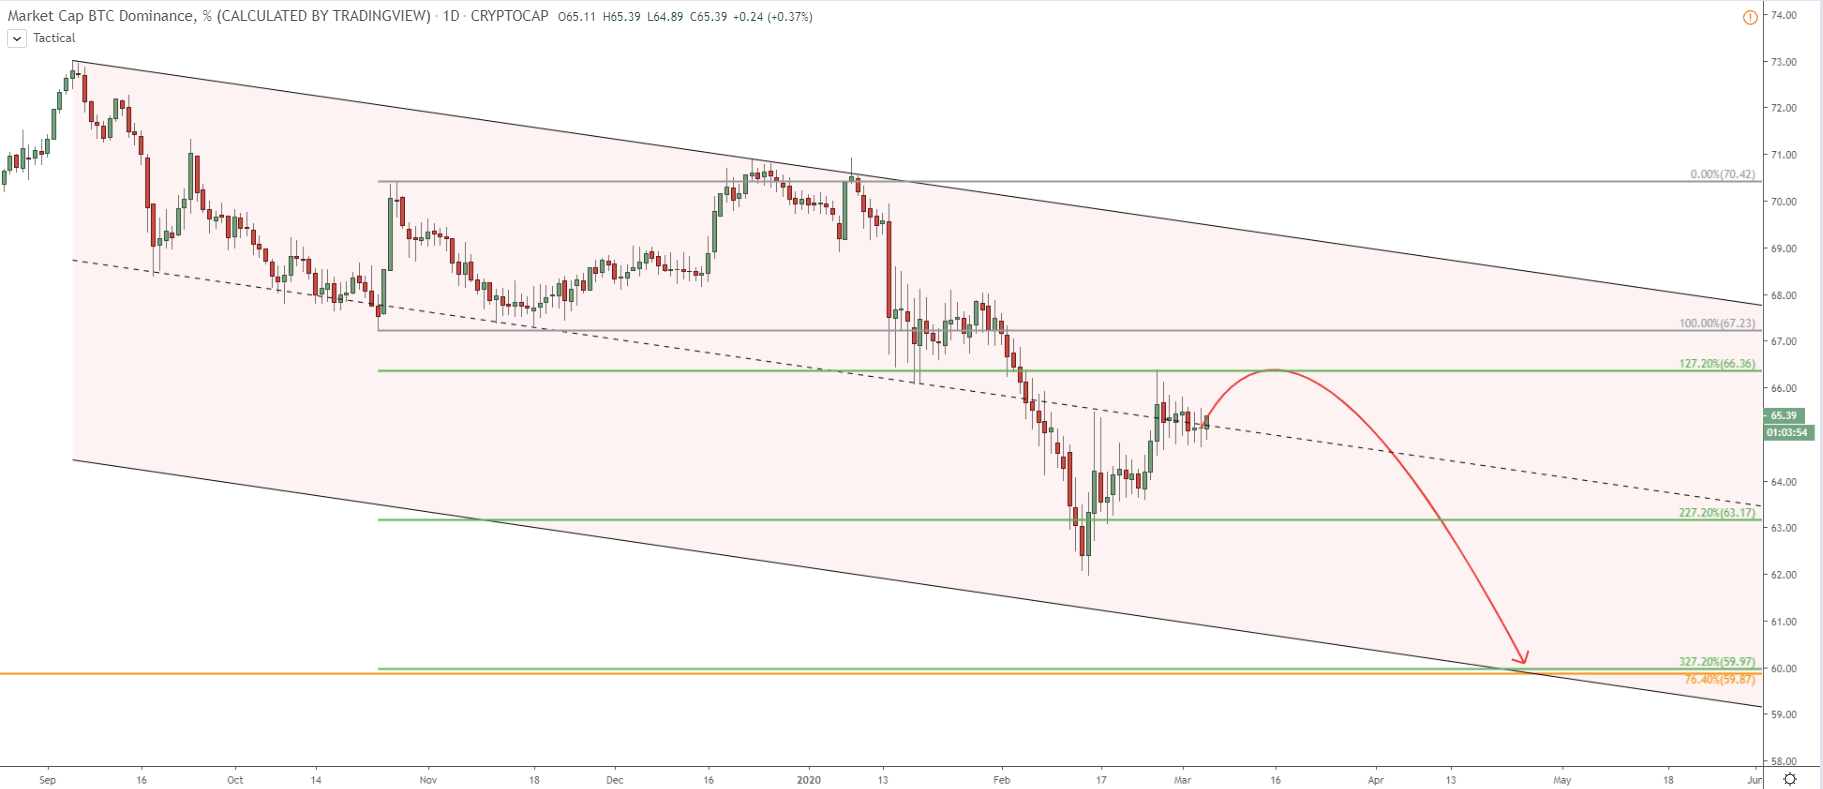
Finally, we will look at the Bitcoin Dominance daily chart where we can see a clear downtrend. Price broke below the descending channel and heading towards the lower trendline of the extended channel. Why do we have to look at this chart you might ask. Well, this chart carries information about whether altcoins will outperform the Bitcoin or not. According to this chart, BTC might be struggling to outperform alts in the coming months and domination can fall down to 60%. However, there might be a double top formation prior to BTC.D decline. And this is what can provoke the consolidation phase on BNB/BTC.
Binance Coin showing some healthy growth and managed to break above multiple resistances. While growth is likely to continue, it might take some time to take all buyers on board.
The nearest resistance and first upside target is at 61.8% fibs, which is 0.0023BTC. If broken, BNB should continue outperforming BTC and can reach 0.003BTC key resistance.
The key support is seen at 0.00218 BTC, and only daily break and close below this level will completely invalidate this bullish scenario. In this case, the price is likely to drop down to 0.00175BTC bottom once again.
Support: 0.00220, 0.00200, 0.00218
Resistance: 0.00260, 0.00302