
Published: August 26th, 2020
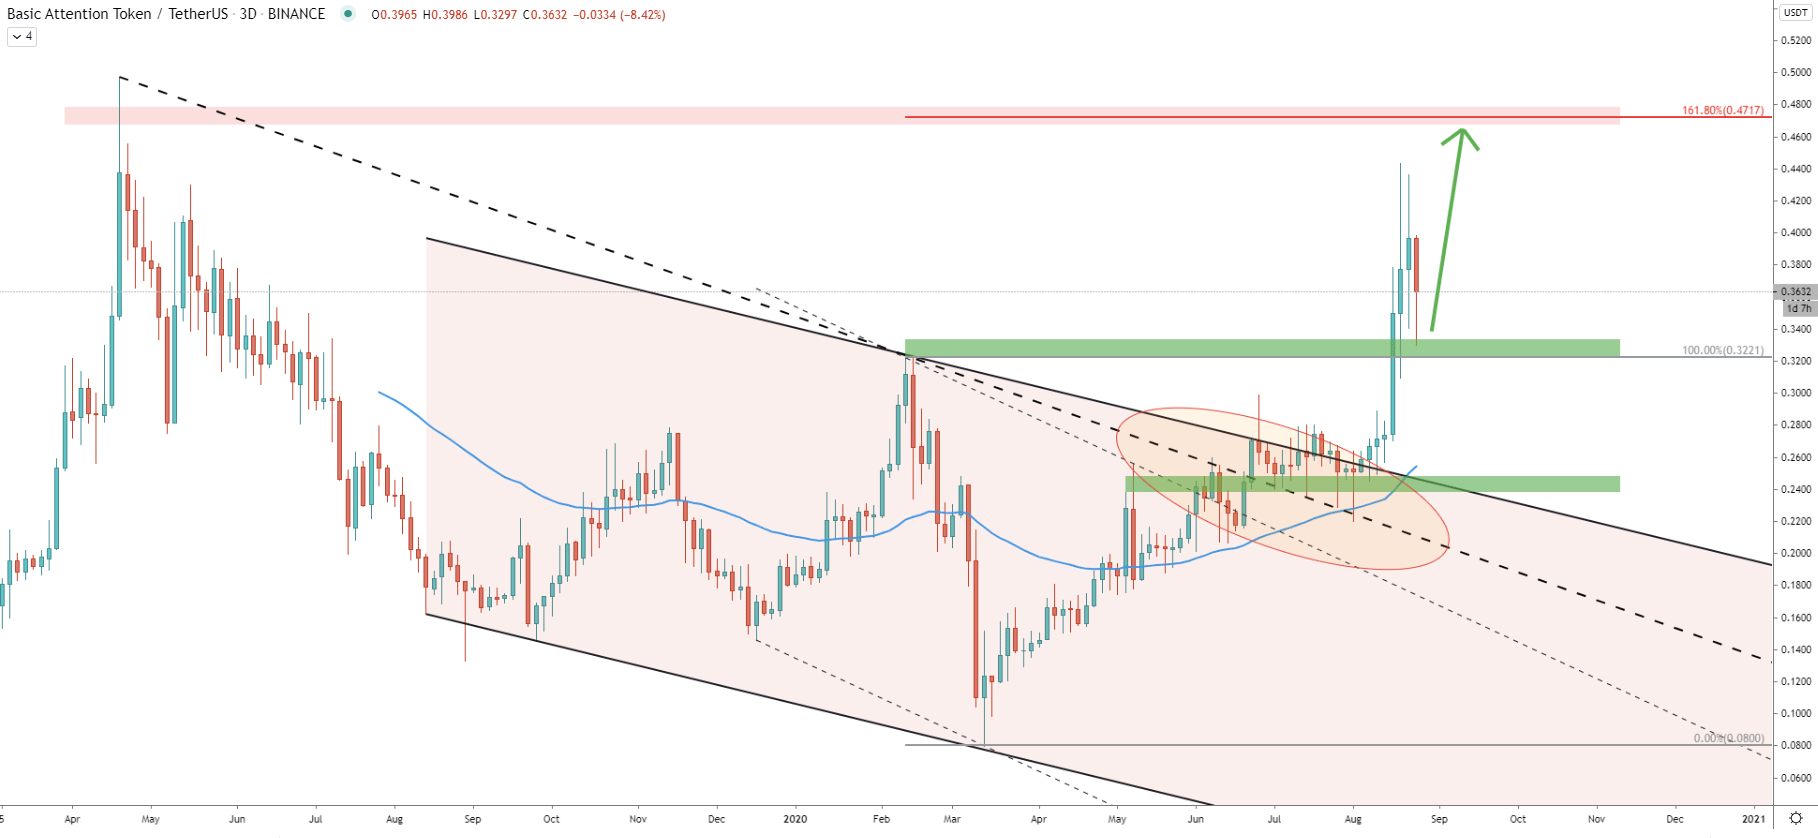
Back in March, BAT/USDT has bottomed out while rejecting psychological support at 0.08. Since then, the price has been on a steady rise and already increased by nearly 350% while currently trading near 0.35. The most important factor is the break above all possible obstacles back on August 16. Price broke and closed above two descending channels and the downtrend trendline while the 50 Exponential Moving Average was rejected consistently.
After the 0.44 high has been tested on August 21, Basic Attention Token corrected down to the previous area o resistance near 0.32. Obviously that resistance became the support that has been rejected this week. This could be an indication of the strong bullish intentions by BAT. The nearest resistance is located at 0.47, which is confirmed by 161.8% Fibonacci retracement level applied to the last wave down when BAT/USDT bottomed out. In the next charts we’ll show the importance of this resistance level.
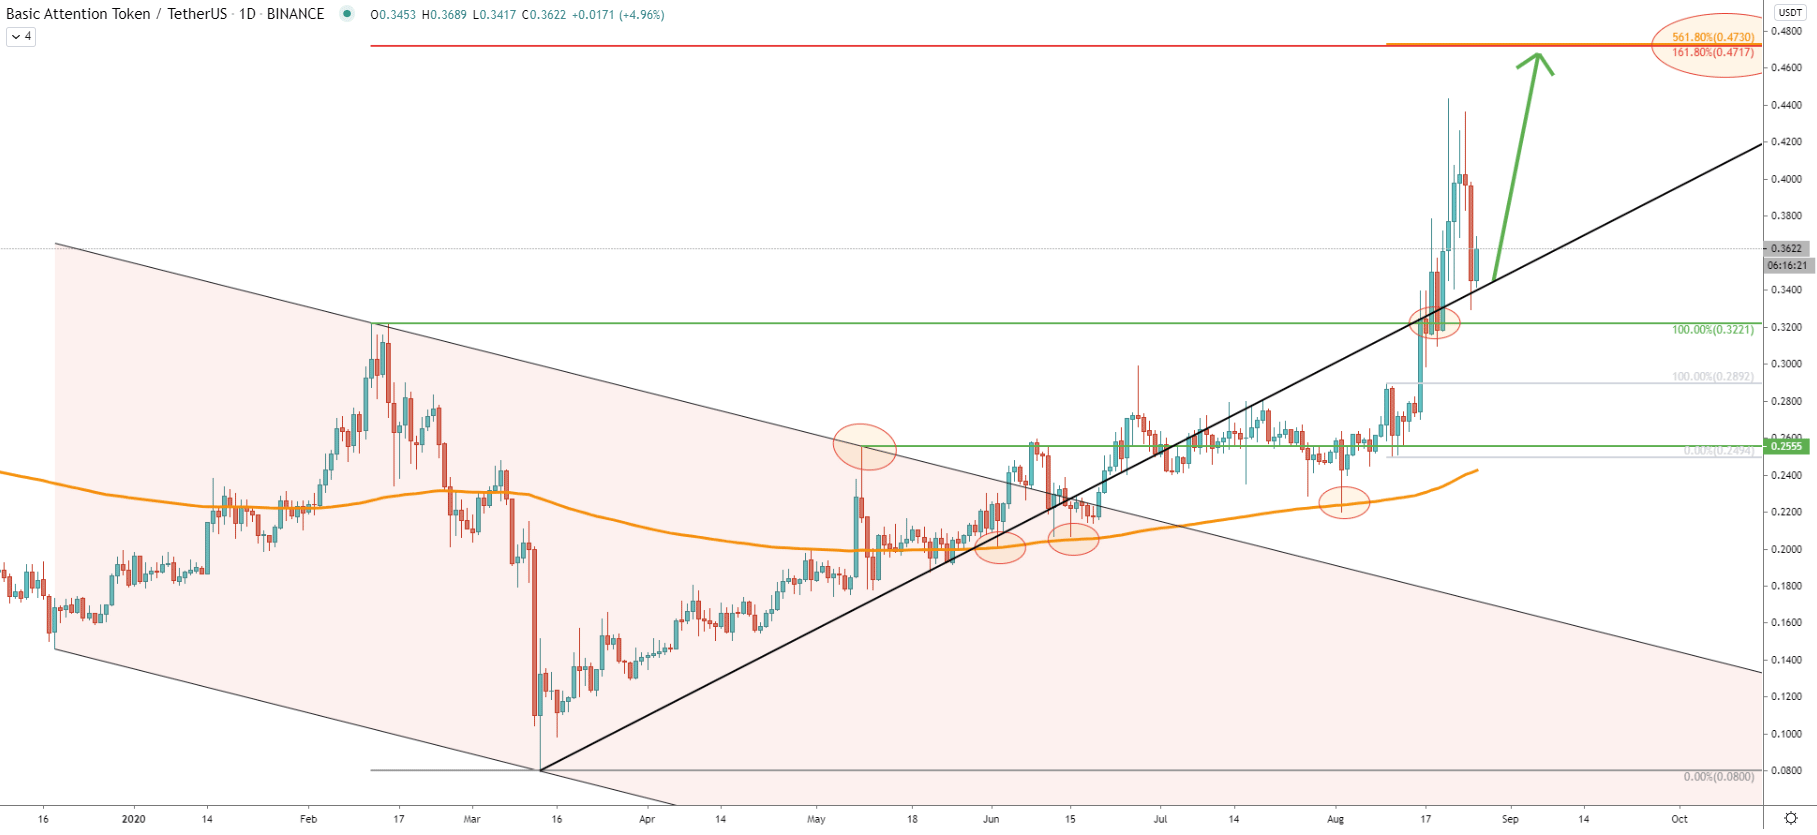
At first, there was a clear rejection of the descending channel back in May this year. But then, after multiple bounces off the 200 EMA price went up and broke above the 0.255 resistance. Price continued to rise and broke above the next resistance at 0.32, suggesting a very bullish trend for BAT/USDT. Yesterday price has corrected down strongly and rejected the average-price uptrend trendline. This might be the confirmation that the uptrend is far from over and there is still huge upside potential.
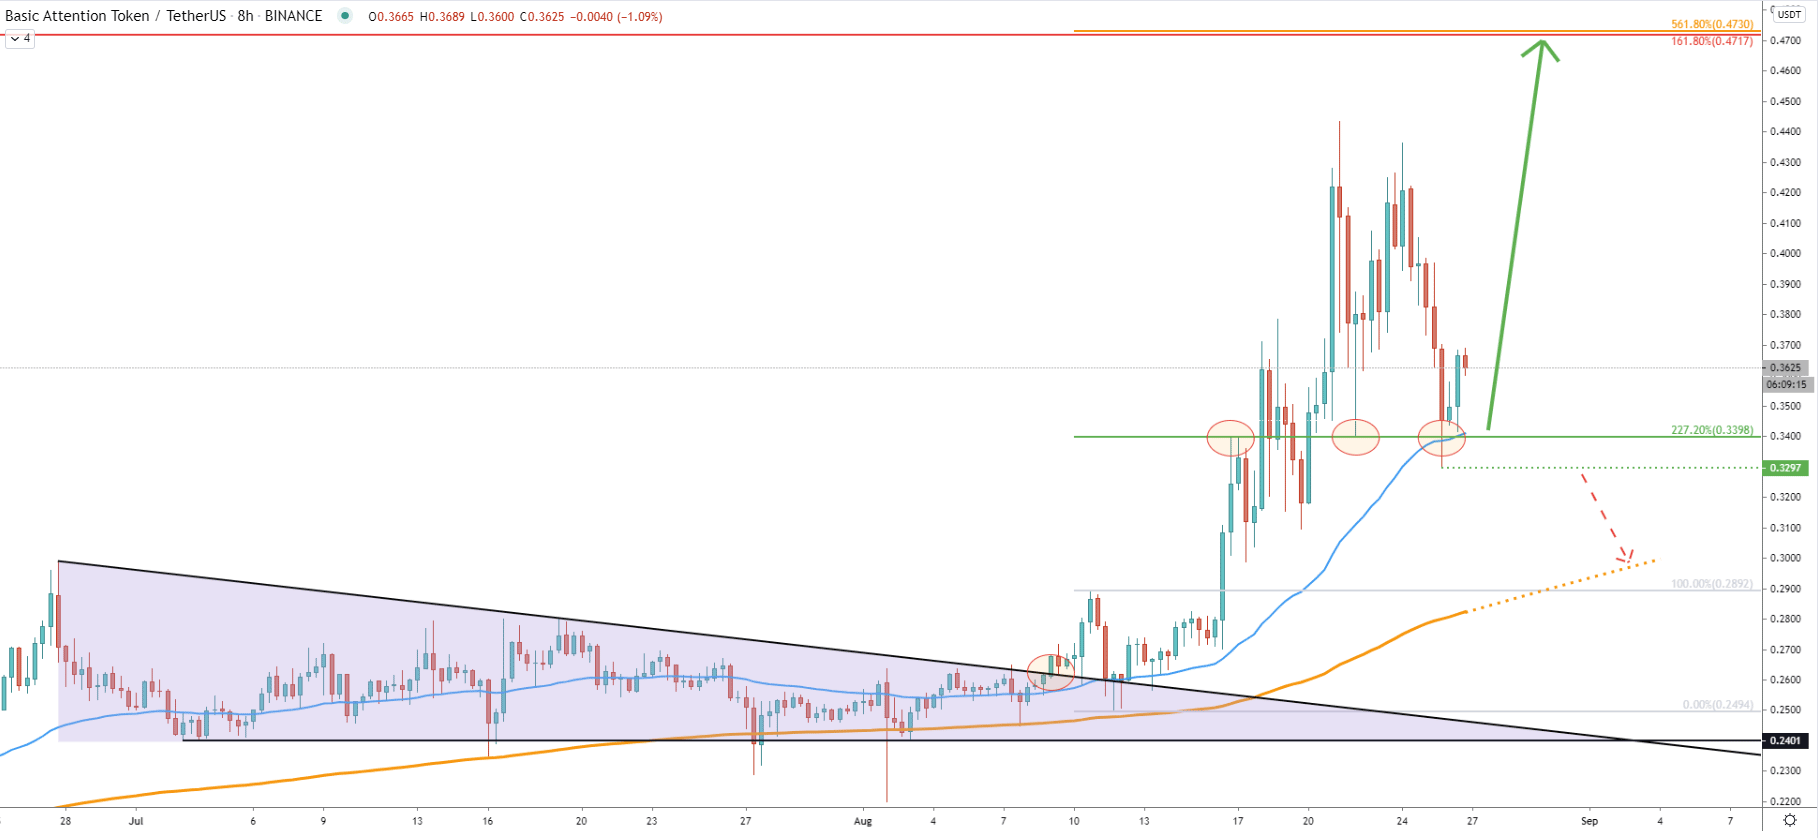
During the entire month of June, BAT/USDT was consolidating while forming a triangle pattern. On August 11, the price decided to break above the downtrend trendline of the triangle. Fibonacci was applied to the corrective wave down after the breakout, which shows that 561.8% Fibs almost exactly corresponds to the previously mentioned resistance at 0.47. Moreover, the 227.2% Fibs at 0.34 was acting as the resistance at first. But now, it is clearly acting as very strong support, which was rejected cleanly back on August 22.
Yesterday, the price spiked down below the 0.34 support, hitting 0.33 low. However, the closing price remained above and BAT rejected the 50 EMA. This is yet another confirmation of the uptrend validity, and the price will continue to rise and as long as price stays above 0.329.
Clearly the trend is bullish as price failing to produce a new lower low with confidence. BAT remains above the uptrend trendline and the 200 EMA. Besides the 50 EMA was rejected on two occasions and yet the price failed to close below any of the EMA rejection points.
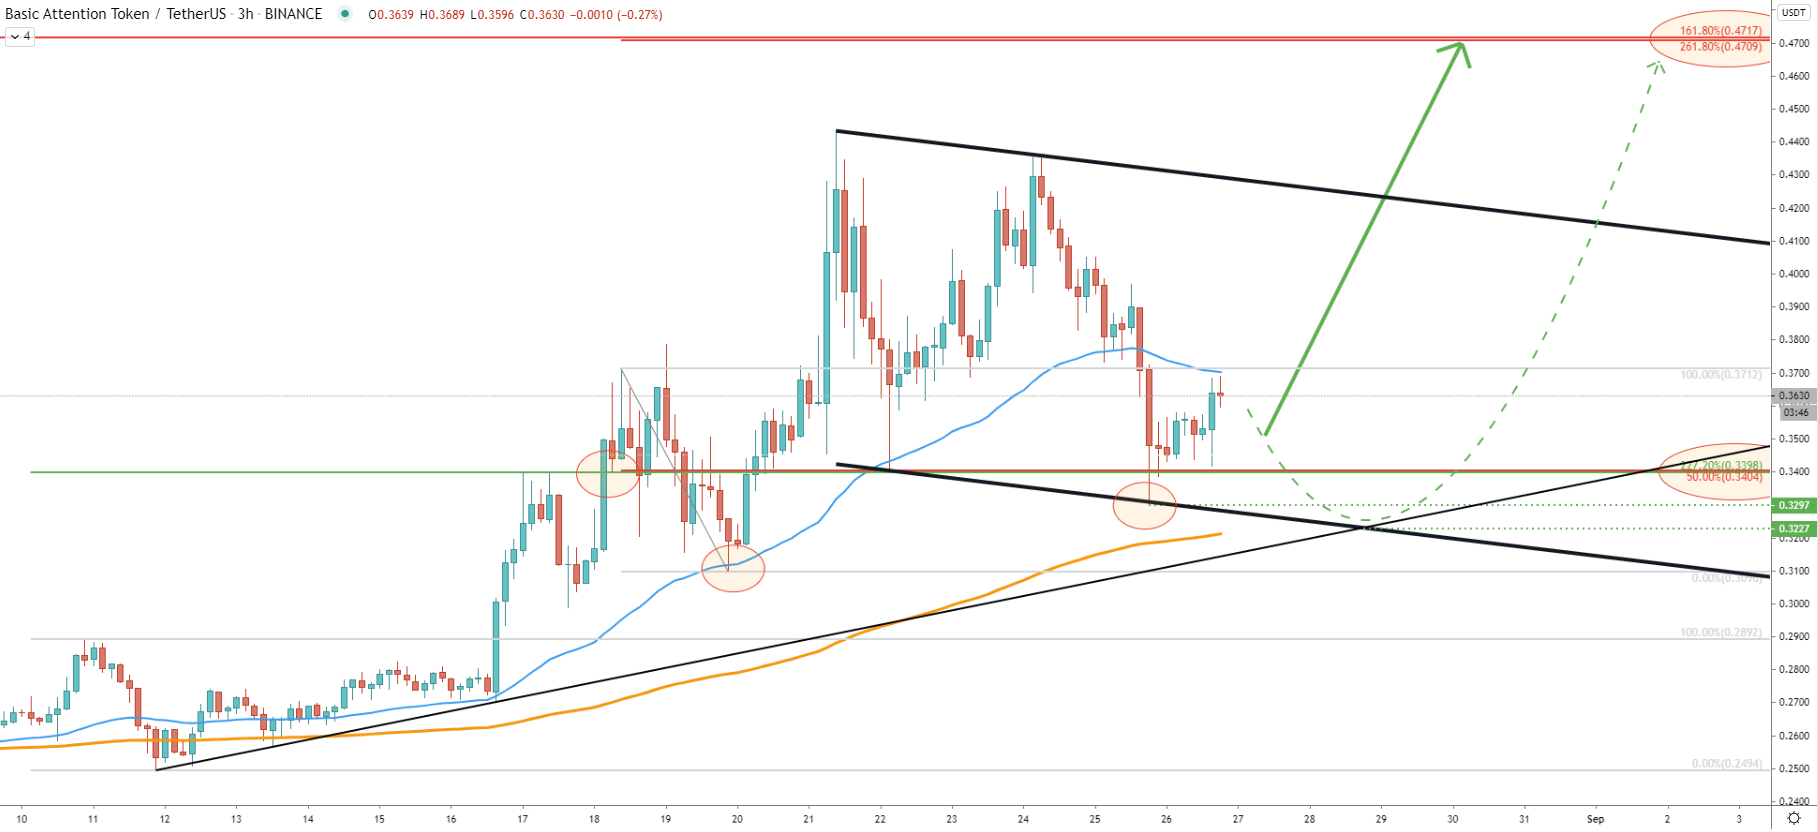
Fibonacci applied to the corrective wave down after breaking the 0.34 resistance shows that previously mentioned key resistance at 0.47, corresponds to the 261.8% Fibs, making it an extremely attractive selling point for the short term speculators in the combining weeks.
Currently, BAT is trading near the 0.34 support, confirmed by 50% and 227.2% Fibonacci retracement level. Buyers are in control and price should be expected to rise with high probability. Because not only Fib support levels are being rejected, but also the price has reached and bounced off the bottom of the descending channel. However, in the worst-case scenario of an uptrend, BAT might spike down, to test the crossing of the lower trending of the descending channel and the long term uptrend trendline at $0.322.
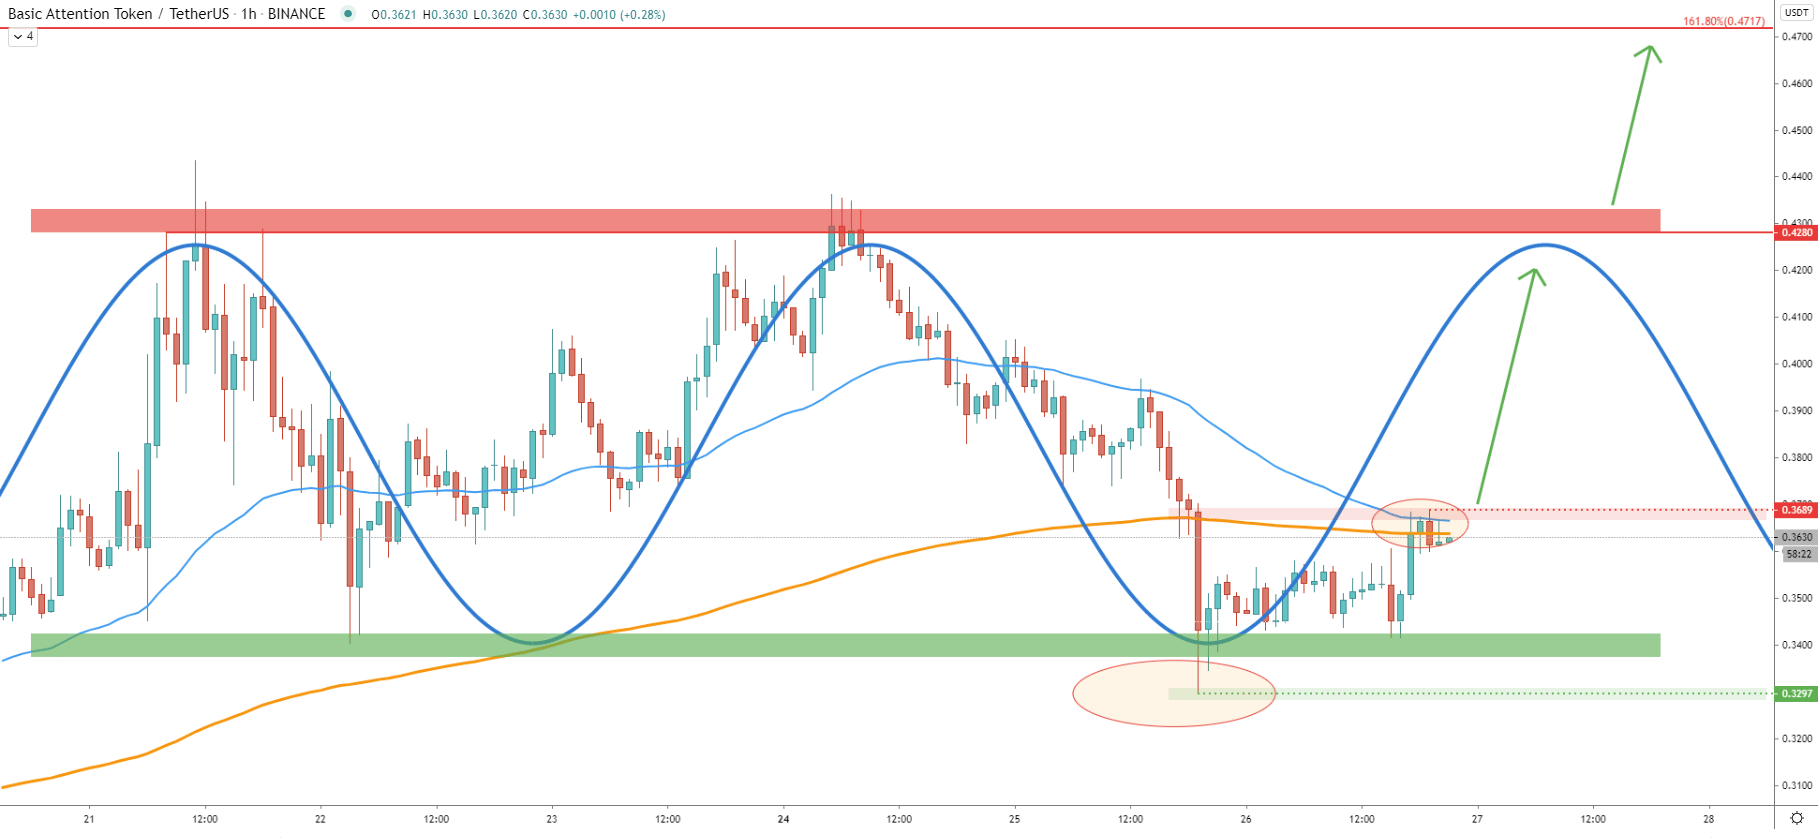
On the lower timeframe, specifically on the 1-hour chart, the range trading is in full power. Price is consolidating between 0.34 support and 0.43 resistance areas. Looking at the market cycles, it is clear that the time for a bull cycle has come and we might be witnessing the beginning of a yet another upside wave.
Currently, the price is rejecting the 200 as well as 50 Exponential Moving Average which are acting as strong resistance at 0.369. Long term investors could be waiting for the break and close above this level before taking any actions. Therefore, when/if the price will break above, exponential growth could be something to expect.
Along with many altcoins, BAT has corrected down and could be providing a good buying opportunity from the technical perspective. Support levels are being rejected and the new bull cycle is expected to begin. This could be the perfect price and time for bulls as long as daily close remains above the 0.329
As per 3-day, 8-hour, and 3-hour charts, the key resistance is located at 0.47 and is confirmed by at least 3 different Fibonacci retracement levels. This might not be the very top of the uptrend, but certainly should be a strong obstacle for the BAT/USDT in the coming days or weeks.
As per the 8-hour chart, the key support has been formed at 0.329. Only daily break and close below this level will completely invalidate the bullish forecast. In this scenario price can be expected to continue trending down, to potentially test the 200 EMA or even previous level of resistance near 0.289.
Support: 0.329, 0.340
Resistance: 0.369, 0.428, 0.471