
Published: April 20th, 2022
Bank of America Stock (BAC) gained 3.8% on Monday as soon as it released the first-quarter result, although the broader market is volatile. However, the BAC is still 15.55% down on the yearly basis and 23% from the latest quarter.
In Q1, Bank of America’s earnings fell 12% to $0.80 a share, while analysts expected earnings of $0.75. Meanwhile, revenue increased by 1.8% to $23.33 billion, which is above the analysts’ forecast of $23.2 billion. The most positive fact for the bank is its “net write-offs on loans” that fell 52% yearly to $392 million, which is almost half of the analysts’ expectation of $848.7 million. Among other metrics, the credit loss provision came at $30 million, below the expectation of $468 million. However, the fixed-income revenue failed to show a good result by coming at $2.65 billion while the anticipation was $2.69 billion.
Bank of America Stock (BAC) immediately reacted to the earnings release by moving up while the broader market direction remained bullish. So let’s see the future price direction from the Bank of America Stock (BAC) Technical analysis.
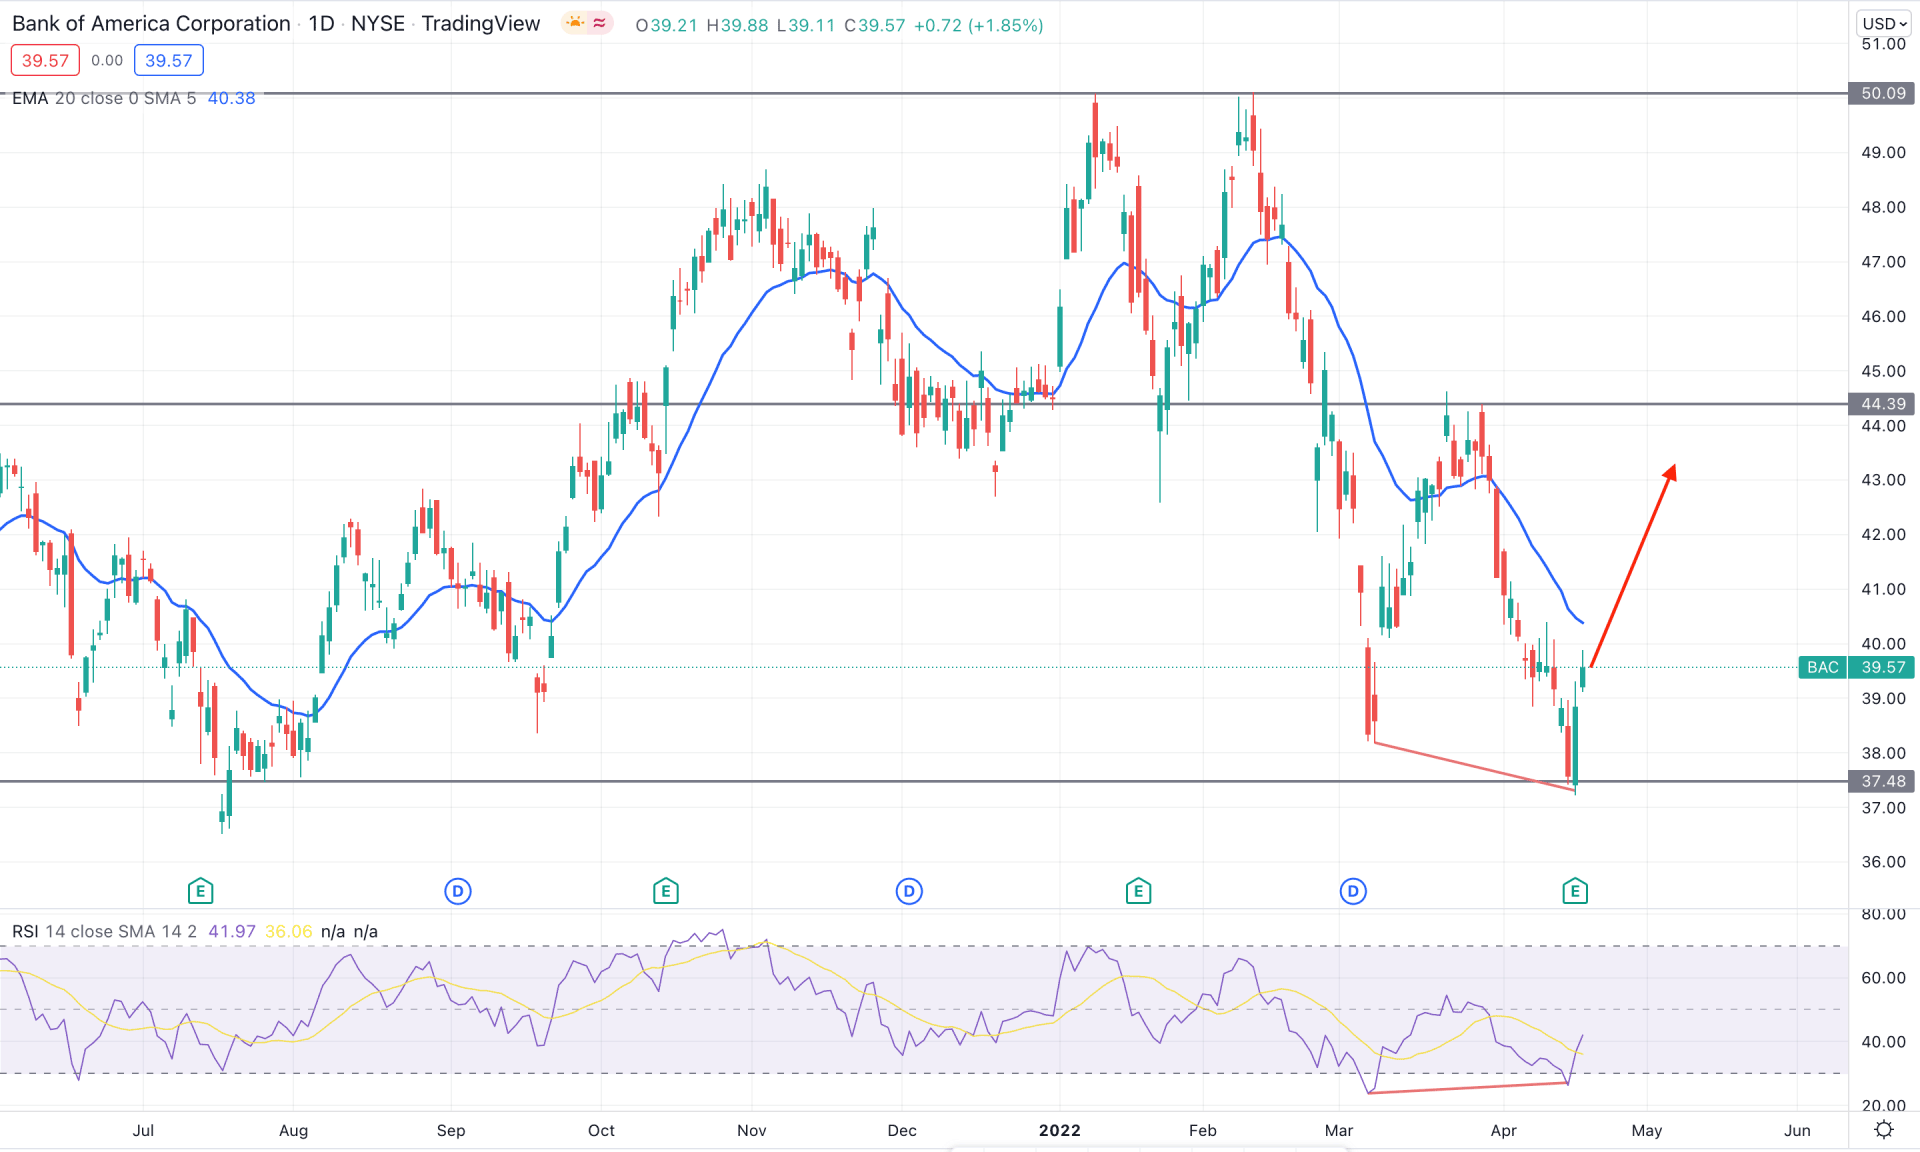
The selling pressure in BAC stock came with a potential double top formation at the 50.09 resistance level from where bears have taken control over the price. Later on, the price made multiple lower lows, but the most recent swing low at 37.48 level came with a divergence with RSI. Although the price remained below the dynamic 20 EMA, the better-than-expected earnings report with a strong engulf bar candlestick from the 37.48 support level is a sign of a possible buying pressure in this stock.
The above image shows how the price formed an engulfing candle from the key support level with an RSI divergence. Moreover, the RSI reached the oversold 30 level and rebounded higher with a candle close. However, the dynamic 20 EMA is still above the price, but the corrective price structure may violate the dynamic resistance by taking the price at the 44.39 resistance level.
Based on the daily structure, the broader market direction is still bearish, followed by three swing lows from the 50.09 level. However, the current divergence and bullish RSI signify that bulls are likely to take the price up towards the 44.39 resistance level in the coming days. However, investors should closely monitor how the price trades at the dynamic 20 EMA area from where any bearish rejection would eliminate the current bullish structure.
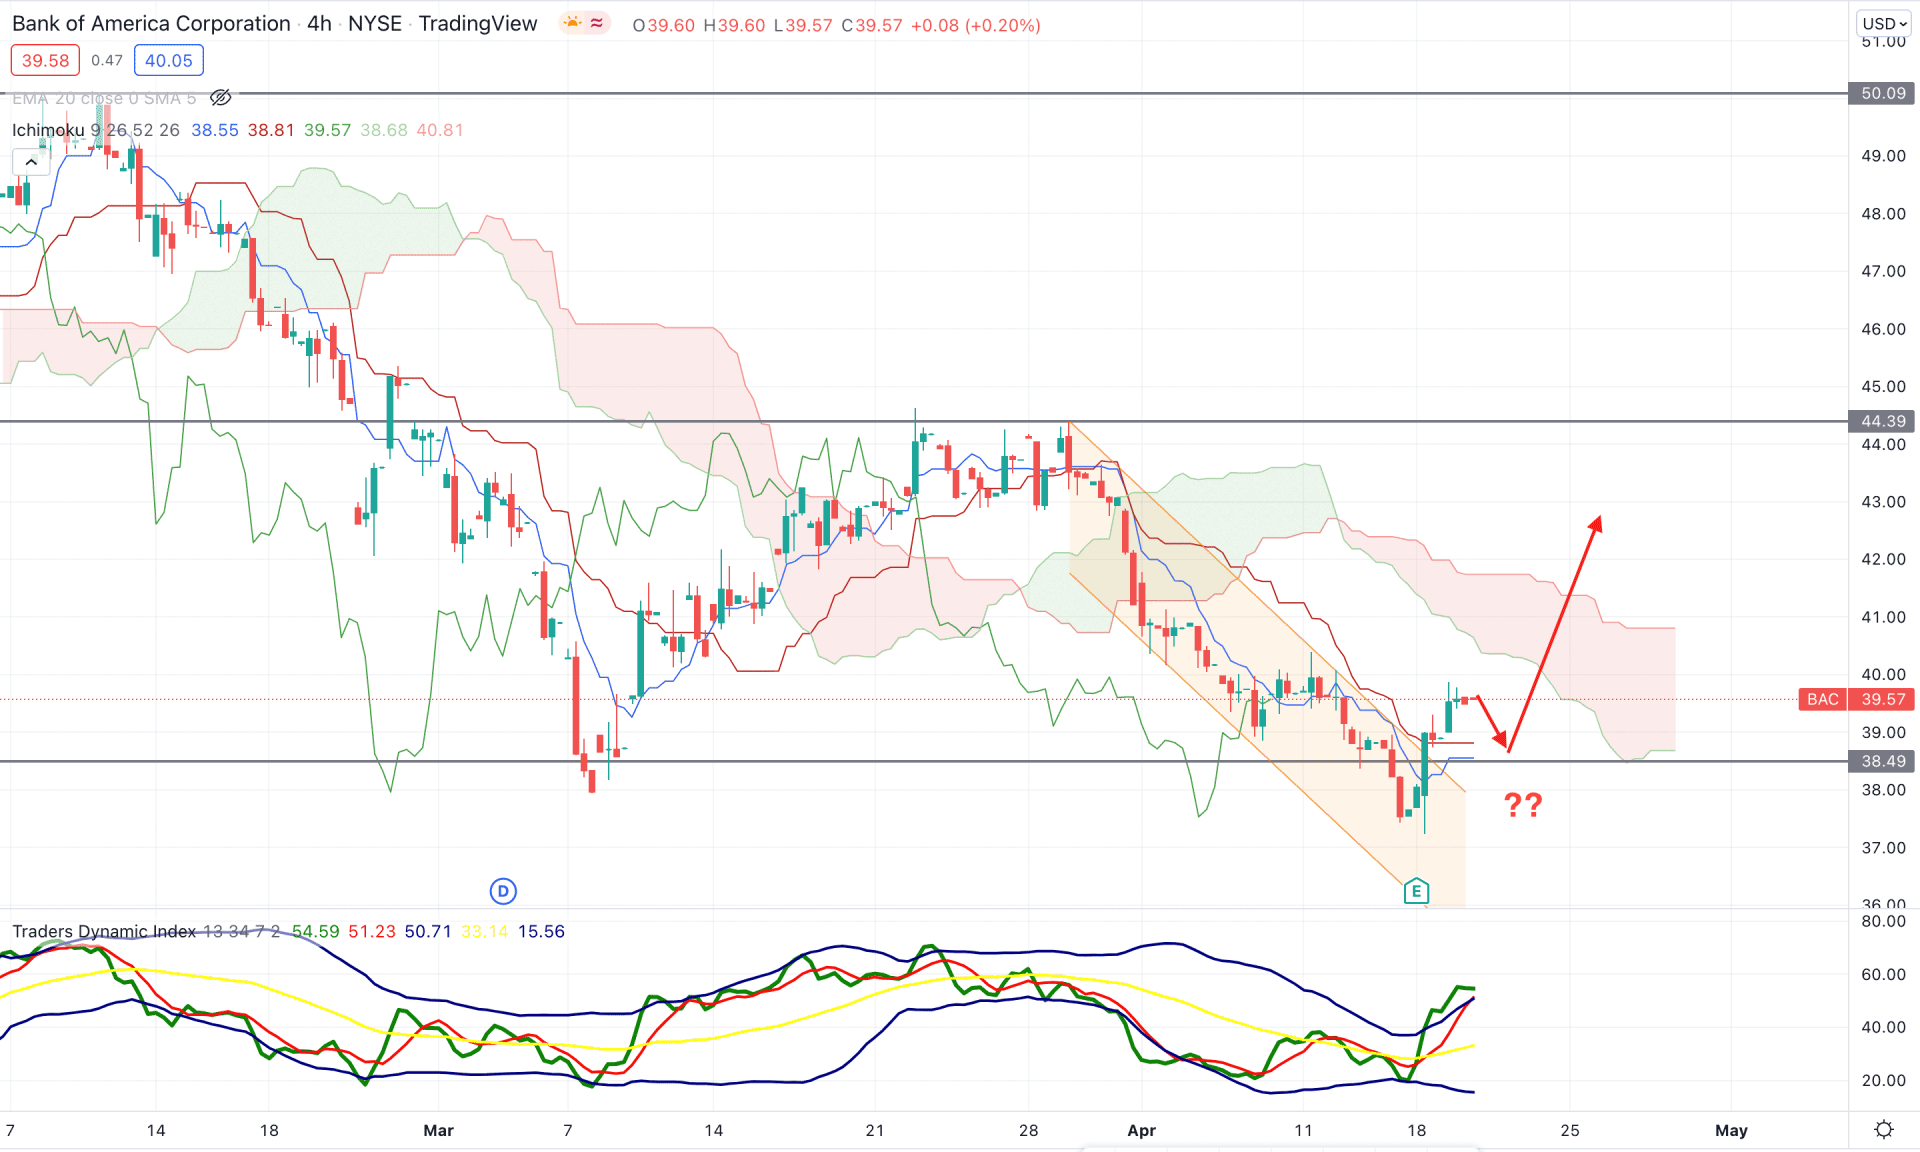
According to the Ichimoku Cloud on the H4 chart, the current trend is bearish as the most recent price trades below the Kumo Cloud for a considerable time. Moreover, the Senkou Span A is still below the Senkou Span B in the future cloud, which is a sign of further bearishness to the price. In that case, any violation from the near-term resistance level with a selling pressure below the 38.49 level would be a bearish opportunity for this stock.
The above image shows how the price breaks out from the bearish channel while the Trader's Dynamic Index is extremely bullish. Moreover, the bullish sentiment from the Q1 earnings report took the price above dynamic Kijun Sen, which is a sign of a trend reversal. Therefore, the buying momentum may extend if the price shows any bullish rejection of the H4 candle from the dynamic Kijun Sen.
Based on the H4 structure, investors should closely monitor how the price trades at the 40.00 to 38.00 area from where any bullish signal would increase it towards the 44.39 resistance level. On the other hand, an immediate rebound and an H4 close below the dynamic Kijun Sen line would alter the current market structure and increase the possibility of testing the 36.00 support level.
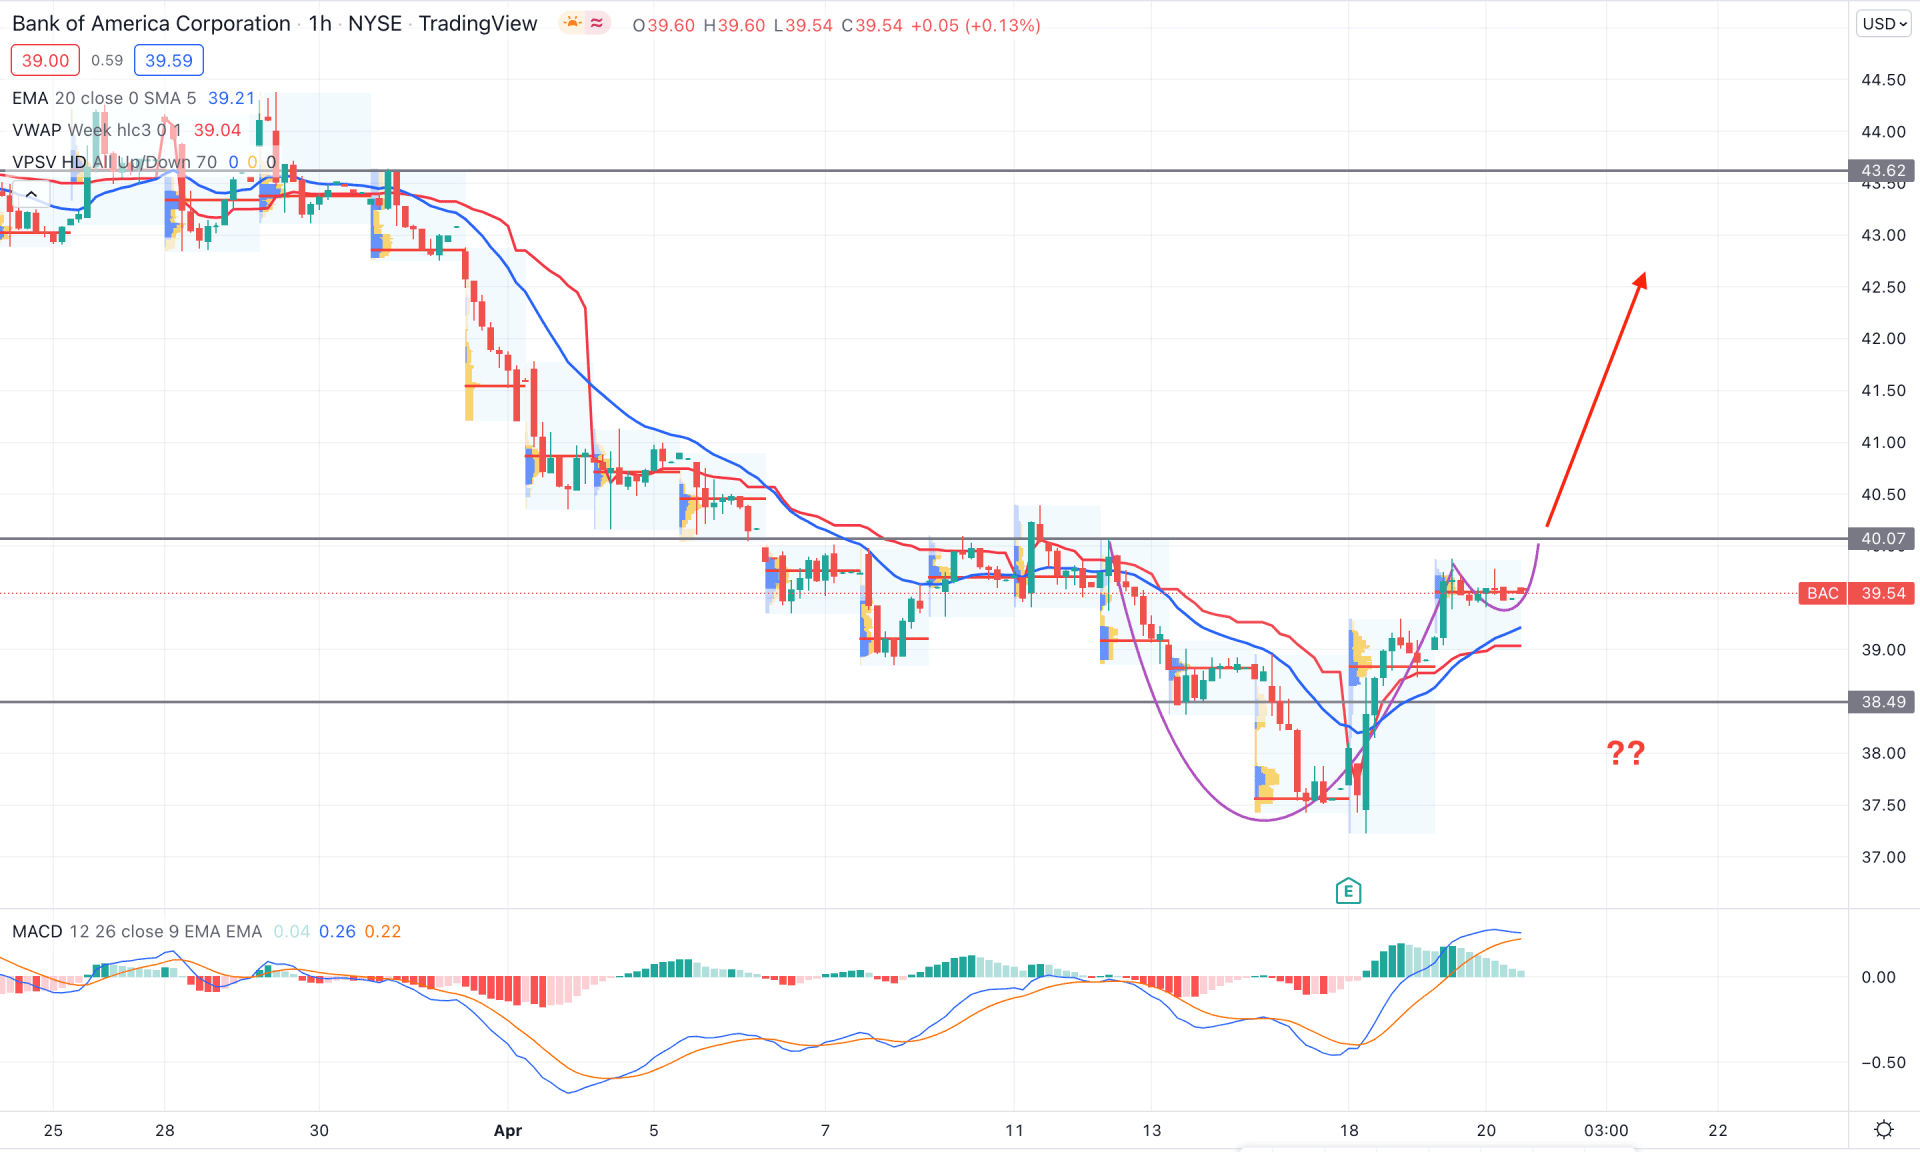
BAC stock is trending up in the intraday chart while the dynamic 20 EMA is below the price in the intraday chart. Moreover, intraday high volume levels made multiple higher highs, while the most recent level remains below the price. On the other hand, the V-shape recovery toward the buyers' direction awaits a Cup and Handle breakout where the neckline is at 40.07 level.
The indicator window shows how the MACD Histogram squeezes to the neutral level while the dynamic weekly VWAP is below the price. Therefore, any bullish pressure with an H1 close above the 40.07 level would increase the buying possibility towards the 43.62 level in the coming hours. On the other hand, the bearish trend may resume if the price rebounded lower below the 38.49 level with a solid bearish H1 close.
Based on the current multi-timeframe analysis, BAC stock is more likely to extend the buying pressure followed by multiple bullish rejections from the 37.48 support level. However, the broader market context is corrective that needs a bullish break of structure above the 44.39 level before aiming for the long-term bullish trend.