
Published: December 15th, 2021
Avalanche (AVAX) is a layer one blockchain platform for decentralized applications and blockchain networks. It appears as a rival to Ethereum, a popular blockchain network with smart contract facilities. However, the significance of Avalanche is that it can handle 6,500 transactions per second with maximum scalability. There are three networks in the Avalanche architecture where each chain serves different purposes that make it different and superior to traditional Bitcoin and Ethereum’s architecture. Avalanche uses a different consensus algorithm based on its requirement.
Avalanche’s main net was launched in 2020 and built its ecosystem in DApps and DeFi sectors. Moreover, other Ethereum-based projects like TruUSD and SushiSwap were integrated with Avalanche. Furthermore, the Avalanche project grabbed investors’ attention due to its interoperability with the Ethereum blockchain.
Currently, there are 243,115,746.24 AVAX in circulation among 395,297,230 AVAX of total supply. The current market capitalization is at $22,244,079,707, 15% up from last 24 hours. The trading volume is impressive and improved by 21.62% in the last 24 hours. Moreover, the corrective recovery from the all-time high and a stable position above the $77.00 key event-level made this instrument an attractive investment opportunity.
Let’s see the upcoming price direction from the AVAX/USDT technical analysis:
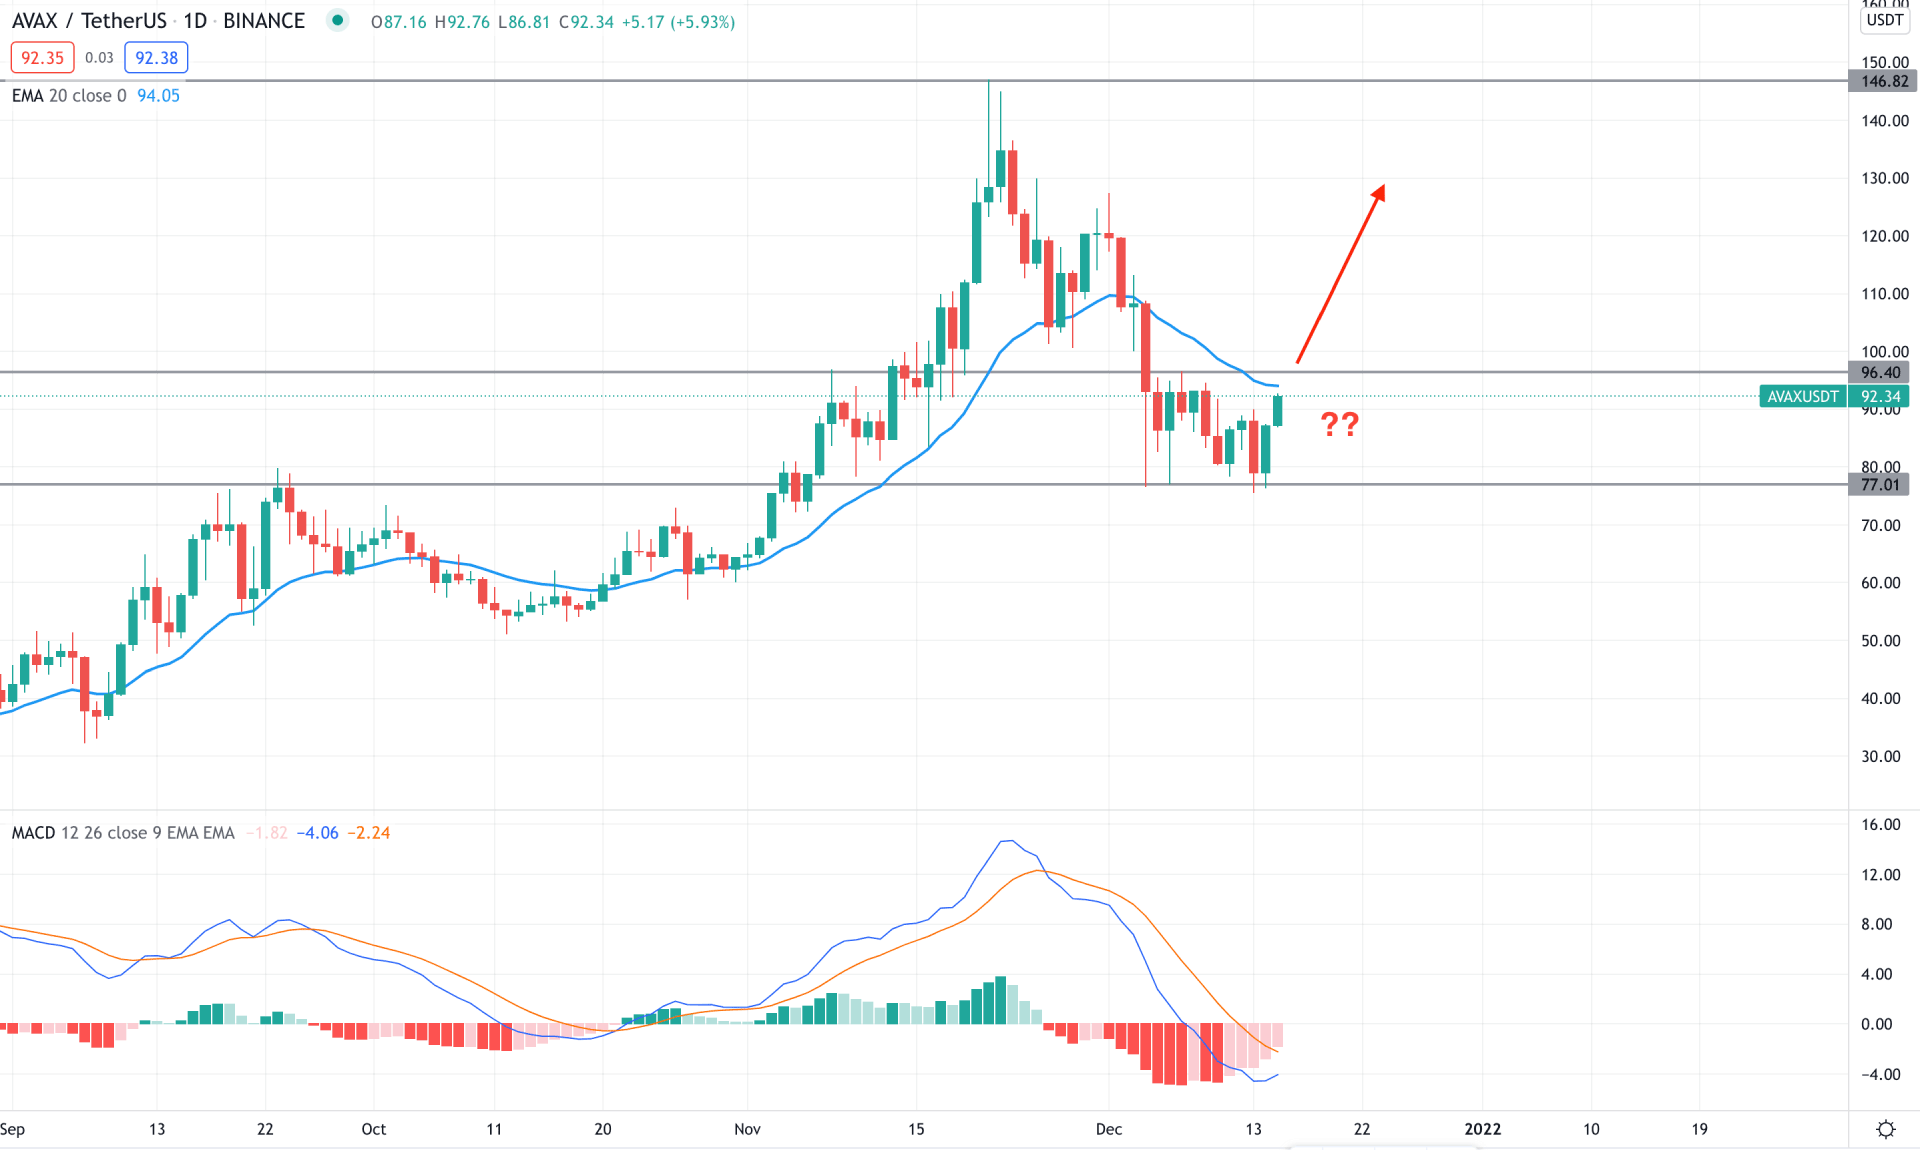
AVAX/USDT remained within a strong bullish trend since the beginning of 2021, where the price soared higher from $3.20 to 147.00 all-time high level with a 49X return on investment. Later on, the price initiated a bearish correction where the speed of selling pressure was not intense compared to the earlier bullish pressure. However, the selling pressure was extended below the dynamic 20 EMA but the price formed as exhaustion from the 77.00 key support level. Therefore, as long as bulls hold the price above the 77.00 level, it is more likely to move up in the coming days.
The above image shows how the MACD Histogram squeezes to the neutral zone, indicating a reduction in the selling pressure. However, the bullish sentiment awaits the Histogram to move above the zero level where the dynamic 20 EMA appears as a barrier.
Based on the daily context, any breakout and a bullish daily close above the 96.40 resistance level would be the firth buying point in this pair. Moreover, any downside pressure and a bullish rejection from 77.00 to 70.00 would be another buying opportunity in this pair with a discounted price. Conversely, a break below the 70.00 level with a bearish daily candle would alter the current market sentiment.
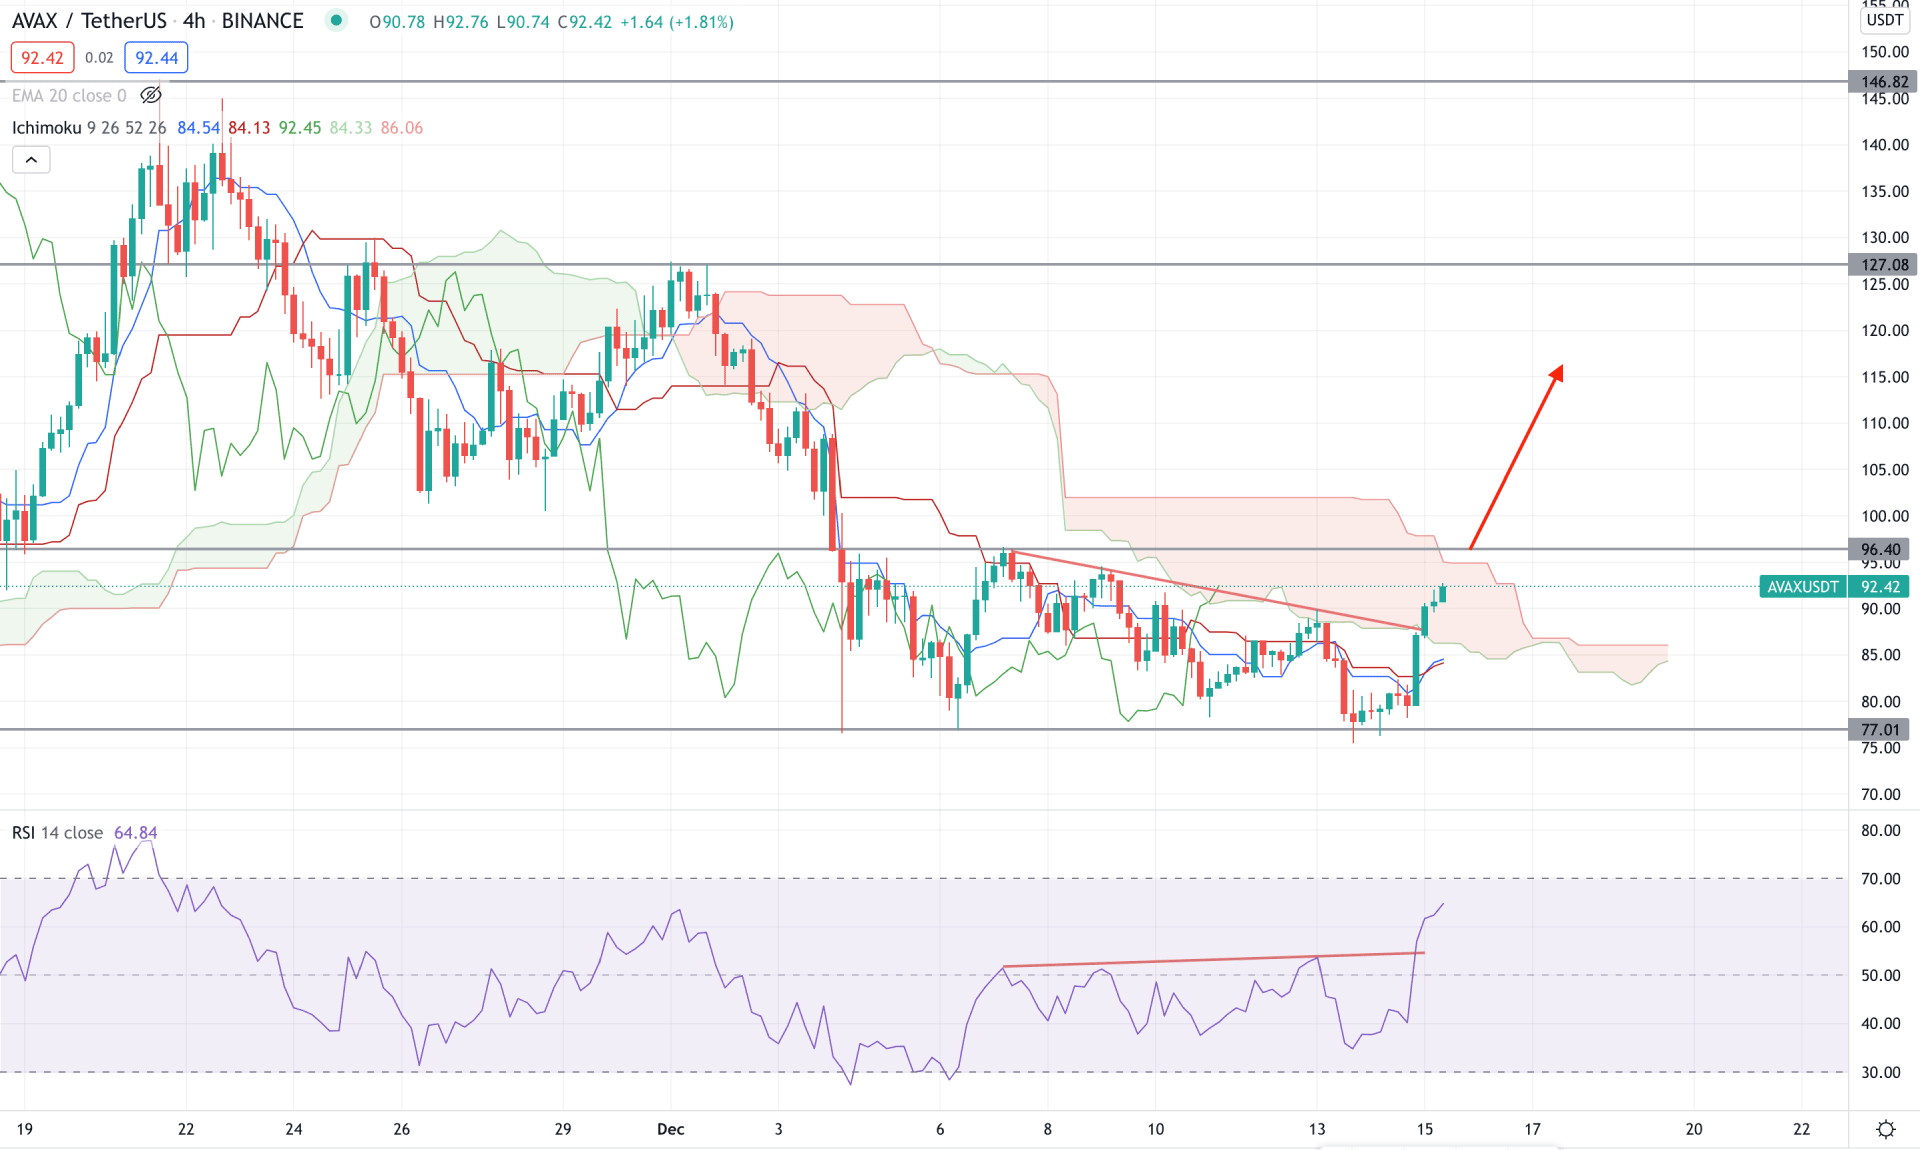
According to the Ichimoku Cloud analysis, AVAX/USDT remained below the Kumo Cloud, where the future cloud is corrective. Senkou Span A is below Senkou Span B but aiming higher while the thickness of the future cloud is not substantial. Therefore, any bullish breakout above the Kumo Cloud would be the primary indication of a trend change in this pair.
In this indicator window, a clear divergence is visible where the price made lower highs while the RSI made new swing highs. Moreover, the current RSI is bullish, with a higher possibility of reaching the overbought 70 level.
Therefore based on the H4 context, the possible market direction is bullish as the price moved above the dynamic Tenkan Sen and Kijun Sen. However, a bullish breakout above the 96.40 static resistance would increase the buying pressure towards the 127.00 area. Conversely, a break below the dynamic Kijun Sen would alter the current market structure and resume selling pressure towards the 70.00 area.
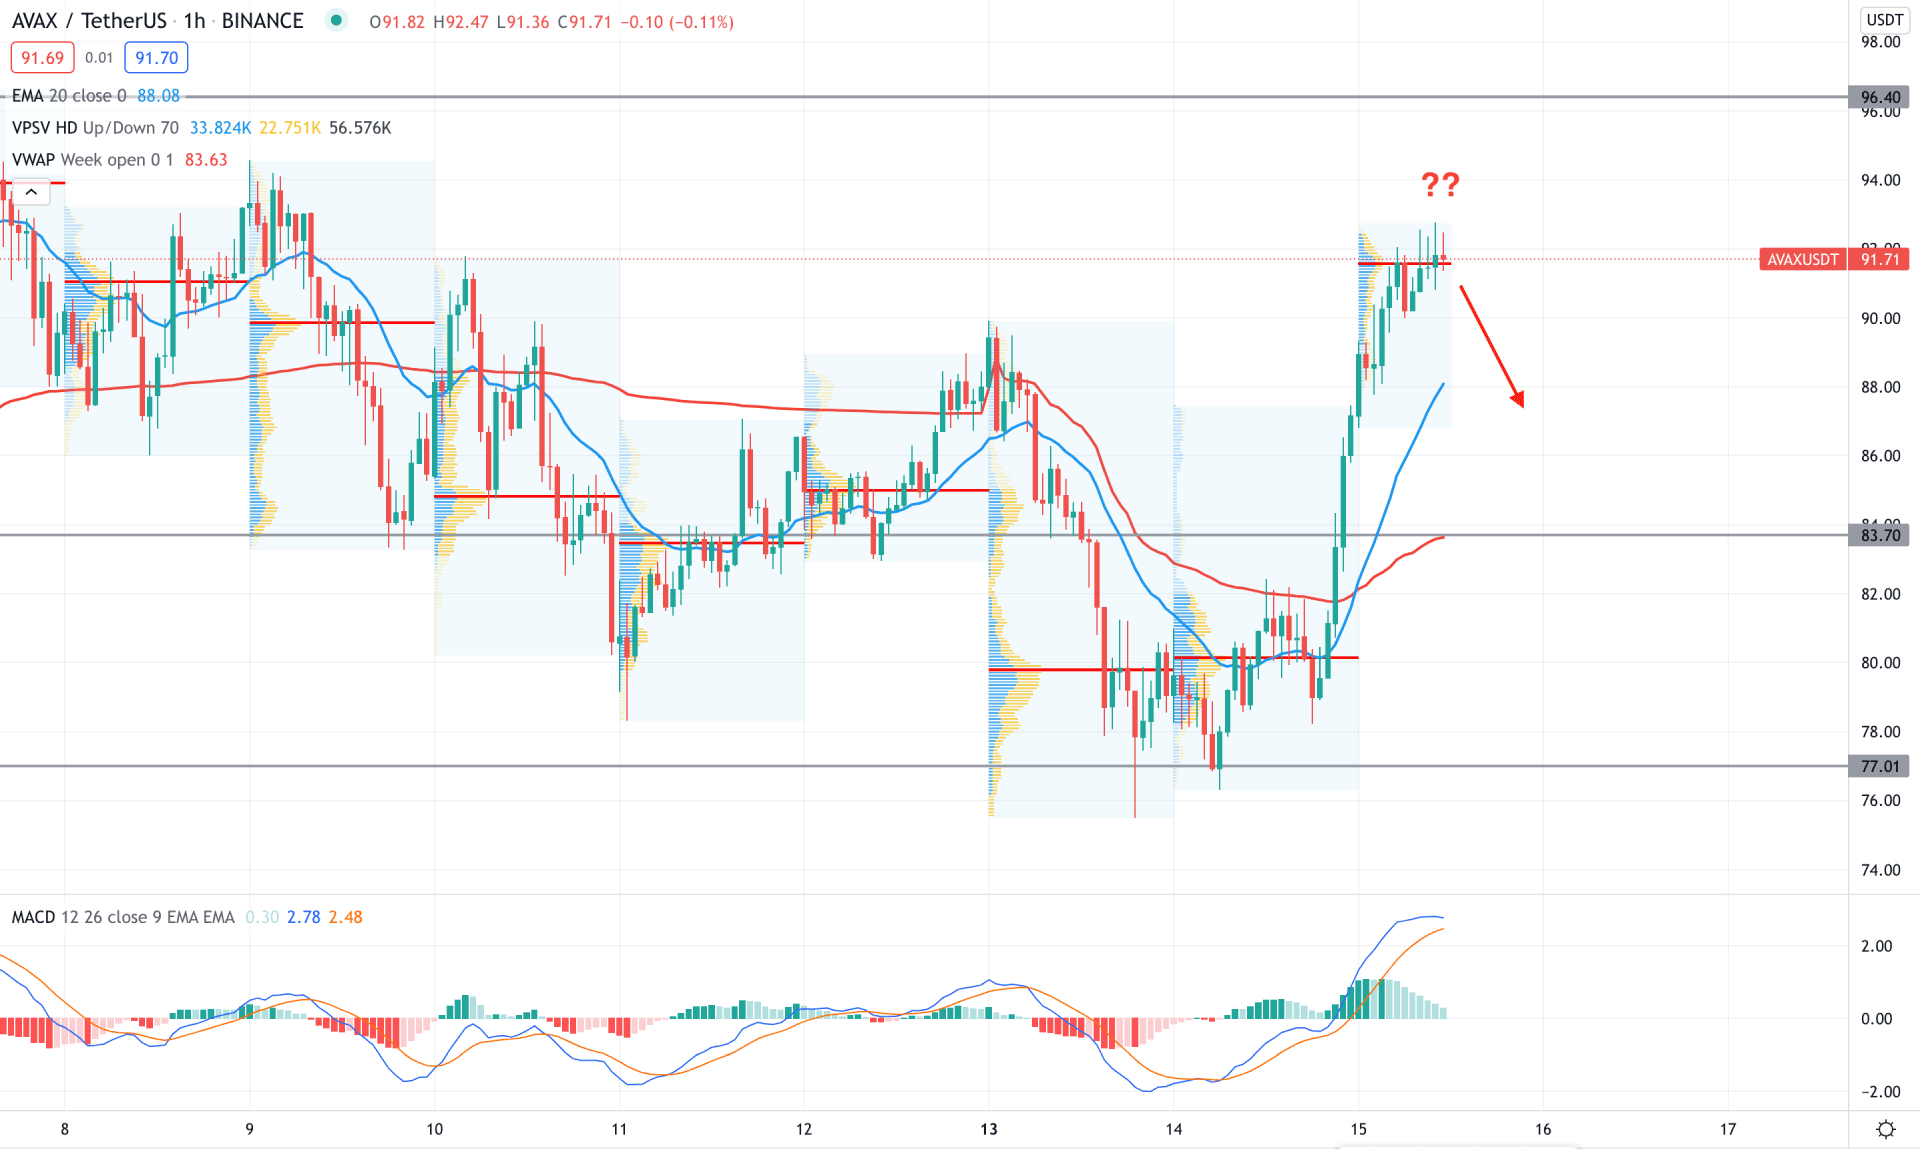
AVAX/USDT showed a tremendous bullish pressure in the intraday chart by breaking the market structure from the 89.90 swing high. Moreover, the buying pressure took the price above the dynamic 20 EMA and made a new high volume level at 91.60 level. However, the price became corrective at the high-volume level, where a bearish pressure is likely to happen in the coming hours.
The above image shows that the MACD Histogram is bullish but losing momentum. Moreover, the dynamic 20 EMA is above the VWAP, where a bearish correction is pending as a mean reversion. Based on the current price context, a bearish pressure from the 89.90 level would lower the price towards the 83.70 intraday support level. Therefore any bullish rejection from 86.00 to 77.00 area would be a buying opportunity in this pair. However, a break below the 77.00 level would alter the current market structure and initiate a bearish trend towards the 60.00 area.
As of the current observation, AVAX/USDT is likely to extend the current bullish pressure where the ultimate target would be 147.00 level. In that case, any bullish rejection above the 77.00 level would boost the buying pressure. On the other hand, a break below the 77.00 level with a bearish daily candle would require a HODLing approach to gain profits from the market.